How to Add an Image to a Tableau Tooltip
This year marked the introduction of a long-awaited Tableau feature: Viz in Tooltip. I believe this will be a game-changer in how we analyze data, but I have been taking my time to process its applications and see how I intend to use them as a consultant. There’s no doubt this feature has the ability to reduce the time to insight and make our visualizations more engaging; two of my three tenets of good visualization. For me, it will also blur the line between descriptive and prescriptive analytics.
It’s a lot to take in! My friend, Jeffrey Shaffer, has already shared twenty different ideas for using the Viz in Tooltip functionality (see Tableau Tips Volume 12 and Volume 13). While I’m still working my way through the most practical and useful applications of this, I’ve come across my first real-world usage. This post shares how to use Tableau’s Viz in Tooltip and how to use this feature to add an image to a tooltip.
This content is excerpted from my book, Innovative Tableau: 100 More Tips, Tutorials, and Strategies, published by O’Reilly Media Inc., 2020, ISBN: 978-1492075653. Get the book at Amazon.
How to Add an Image to a Tableau Tooltip
For the past two years, I’ve used the following Tableau Public visualization to share my speaking schedule.
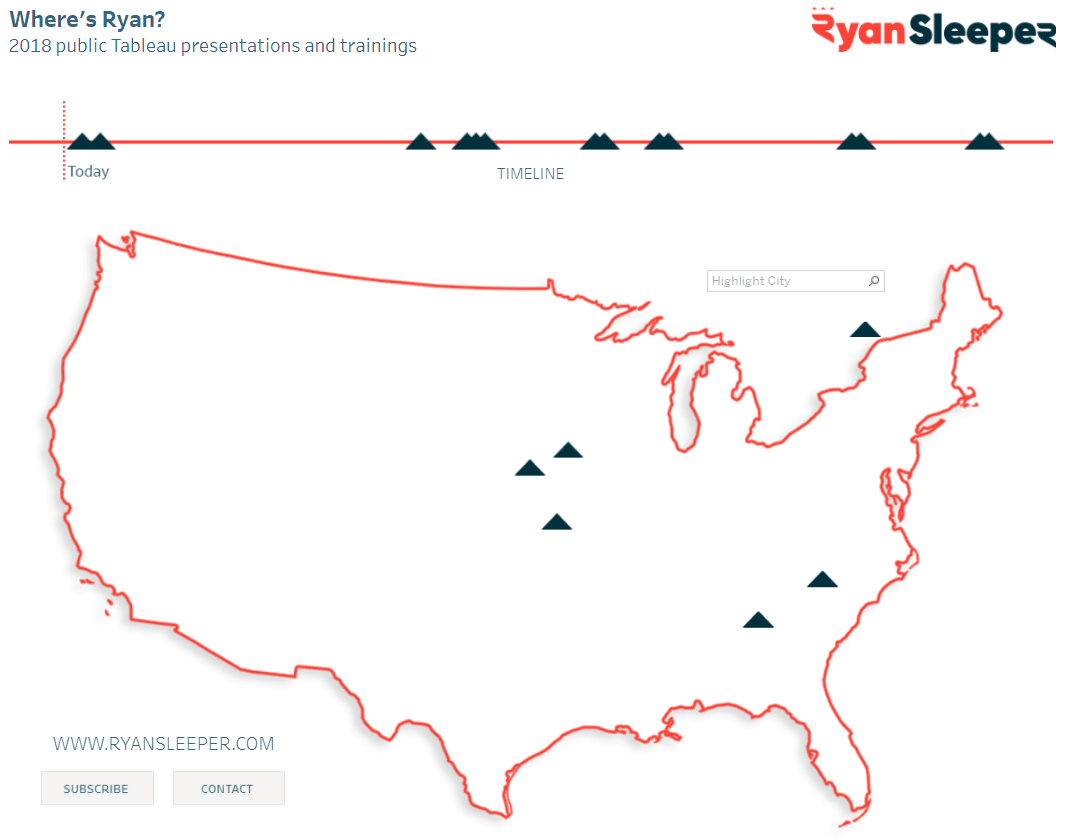
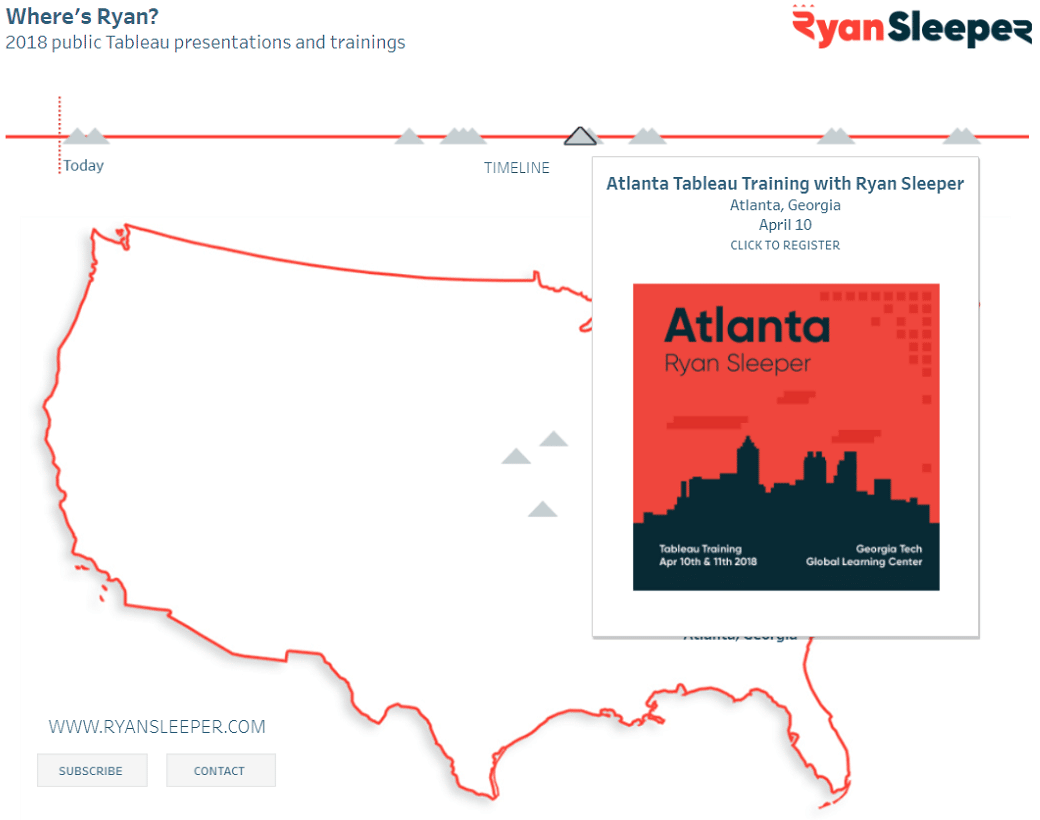
The new Viz in Tooltip feature provides a great opportunity to integrate your own branding through the use of images. This year, I was able to improve the map visualization by adding my own custom images to the tooltips on hover.
Now, when the viewer hovers over a date for one of our public training events, they will see a product image along with the existing event information.
To add an image to a tooltip, start by putting the images that will eventually be used into the Shapes folder in your Tableau Repository. On a PC, this is located at C:\Users\[User]\Documents\My Tableau Repository\Shapes. Here you can create a new folder for your custom shapes. You can name it anything you like – and create as many individual folders as you wish – but I will place the images in a new folder called “Training Images”.

Create a free account, or login.
Unlock this tutorial and hundreds of other free visual analytics resources from our expert team.
Already have an account? Sign In
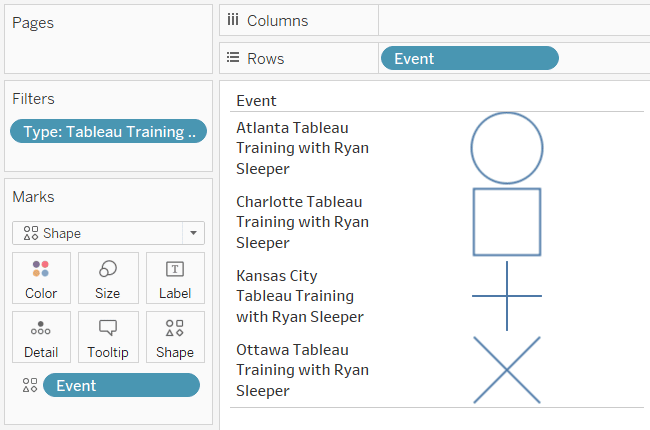
Next, make a new worksheet that will be used to map the new images to specific dimension members. This is similar to the approach used to create icon-based filters in my Odds of Going Pro viz. For best results, put the dimension you want to map the images to on the Rows Shelf, change the Mark Type to Shape, and place the same dimension you are mapping onto the Shape Marks Card. After filtering my view to only the dimension members I want to map, my sheet looks like this.
To map the image to dimension members, click on the Shape Marks Card. Use the dropdown menu to find the custom shapes palette that you added to your Tableau Repository. If you already had Tableau open, you will need to click “Reload Shapes” for the new palette to appear.
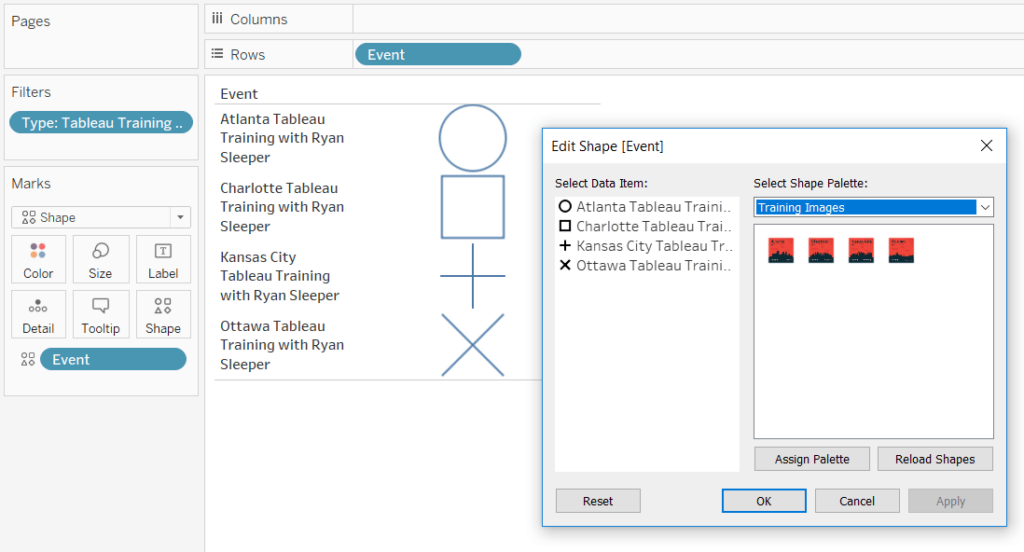
To map each image, click the dimension member first, then the shape you want to assign to that dimension member. You can always click the “Apply” button to preview the change.
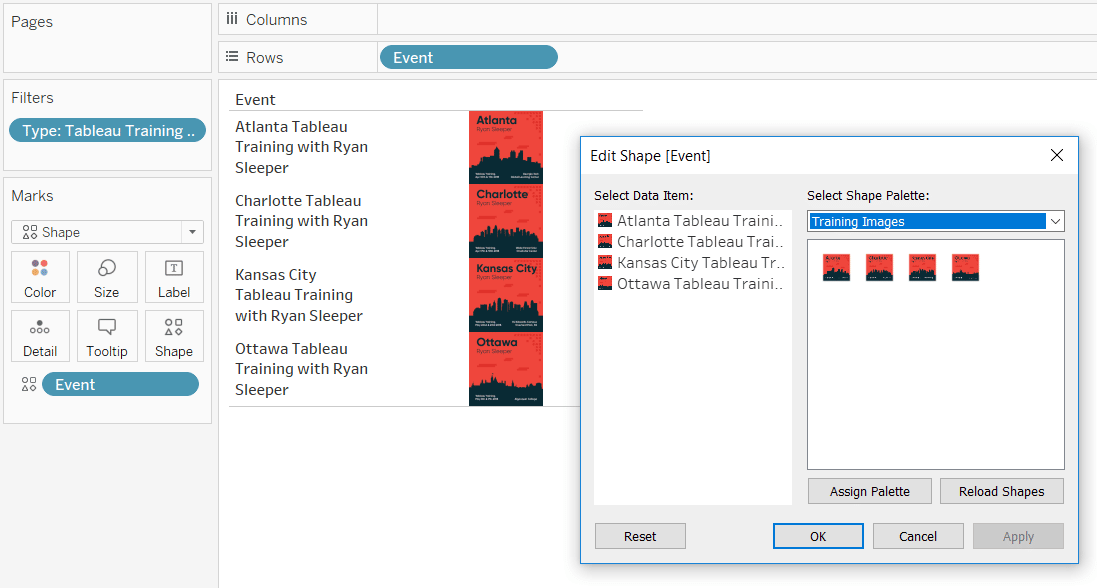
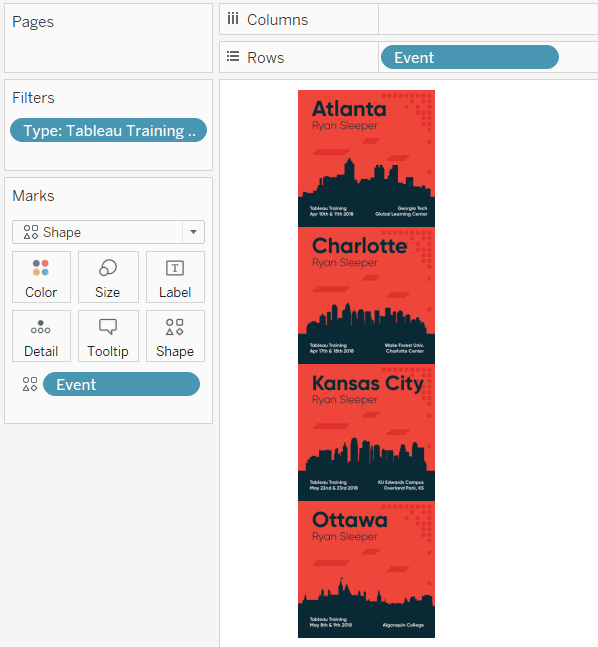
After clicking the “OK” button to accept the changes, finalize the sheet by hiding the row headers (right-click on any header and deselect “Show Header”), and remove all lines with the formatting options.
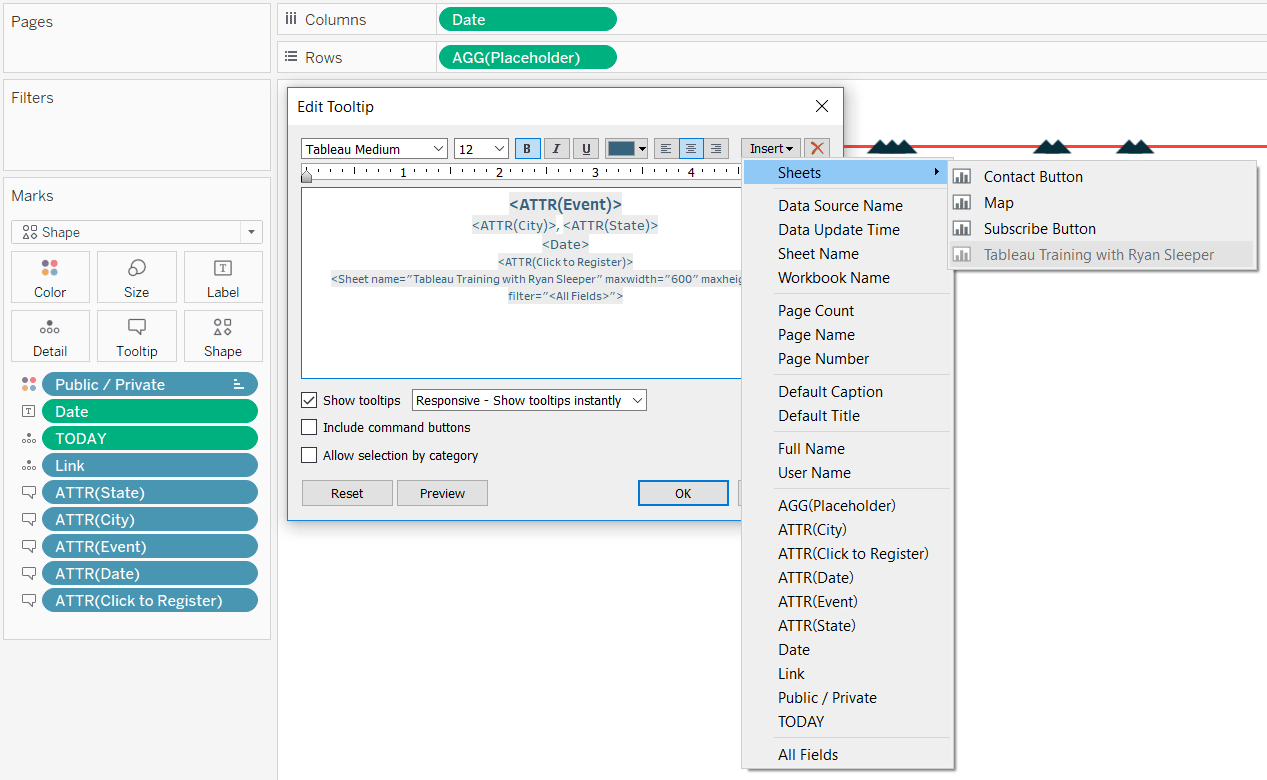
Lastly, navigate to the sheet where you want to add an image in a tooltip. To add a Viz in Tooltip, click the Tooltip Marks Card, click “Insert” in the top-right corner, hover over “Sheets”, and choose the sheet containing your images.
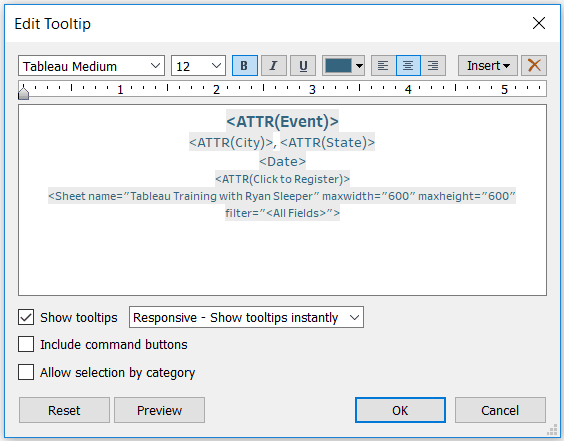
Note you can also set a maximum height and width of the image.
Now if the dimension member that is hovered over where you added the Viz in Tooltip matches the dimension member from the worksheet containing the images, the corresponding image will be displayed in the tooltip!
In my case, I used the Event dimension, but of course, this approach will work with whatever dimensions are relevant for your business.
Thanks for reading,
– Ryan
Related Content
Ryan Sleeper
Make engaging explanatory dashboard elements with any images Learn how to create custom shape palettes in Tableau and how to…
Ryan Sleeper
Hack Tableau to Display Additional Information when Hovering over Dimensions By default, Tableau only displays tooltips when hovering over measures.…
How to Show Top 10 Lists in Tableau Tooltips
You may have heard the recommendation to provide your dashboard users details on demand. While I generally agree with the…


