How to Automatically Create Pages in Tableau Visualizations

Pagination is a useful tactic to add additional user experience to a dashboard while keeping them clean and orderly. Sometimes it can get tricky to implement when you have data that will update and change the number of total rows you are trying to separate. Before I would use the index function and hard code each page number to be a certain range of index values. I have come up with a few calculations to use to create pages in Tableau that will make it so that you do not have to update any formulas when your data grows.
How to do Pagination in Tableau
Setting up the parameters
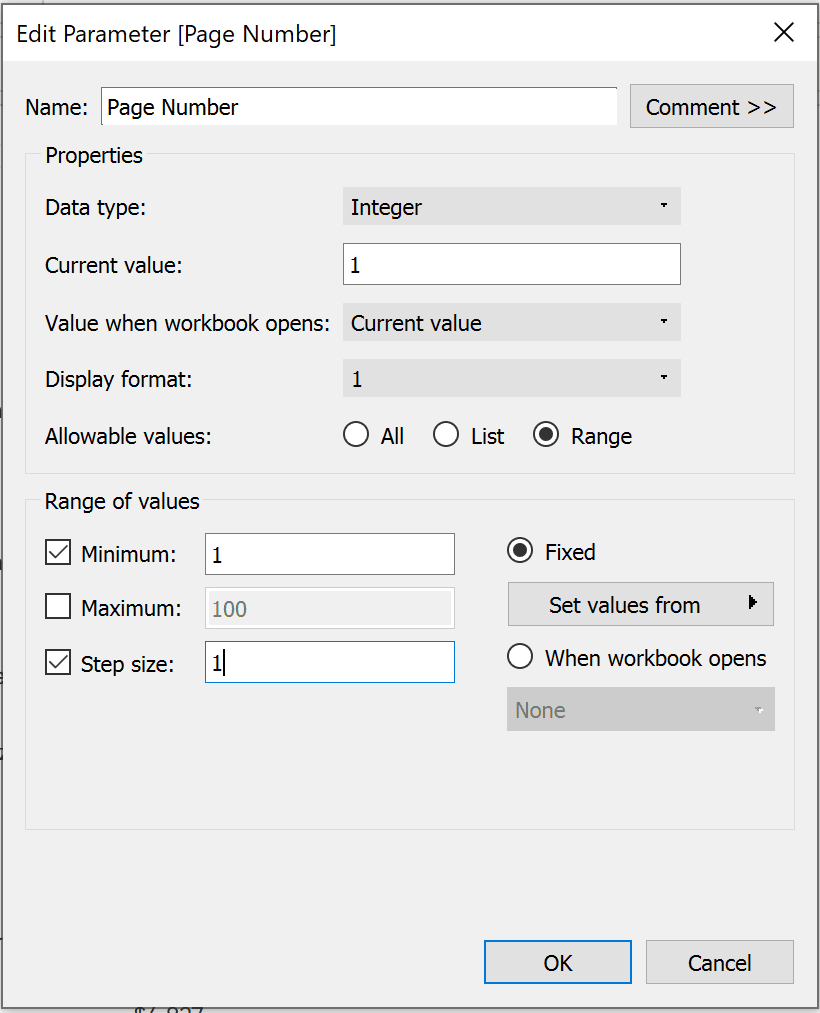
Using the Superstore data set, the first step is creating a couple of different parameters. The first is your page number parameter. This parameter will control your page number selection. The Data type is Integer and Range for Allowable values. Set Minimum and Step size to 1, leaving Maximum unchecked.
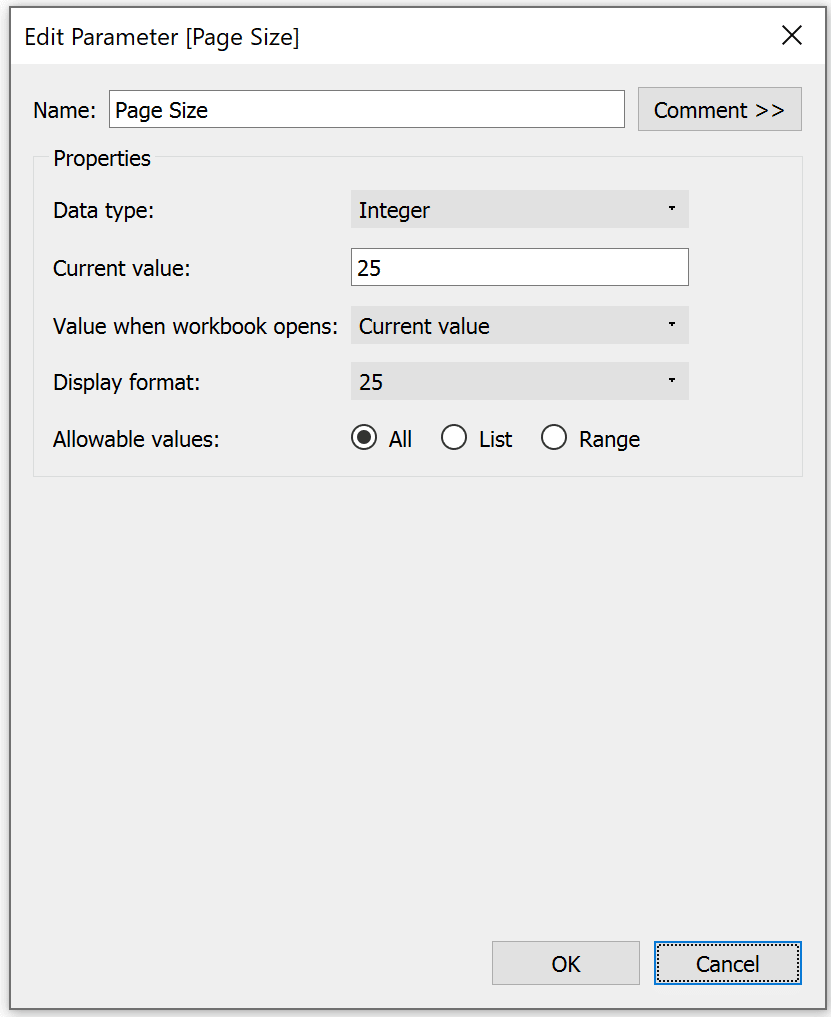
Create a parameter called Page Size. This parameter allows the user to change the number of rows they want on each page. Set Data type to Integer and Allowable values as all.
![]()
The Current value depends on the size of the area you are displaying data. I am going to start with 25 so that 25 rows are displayed.
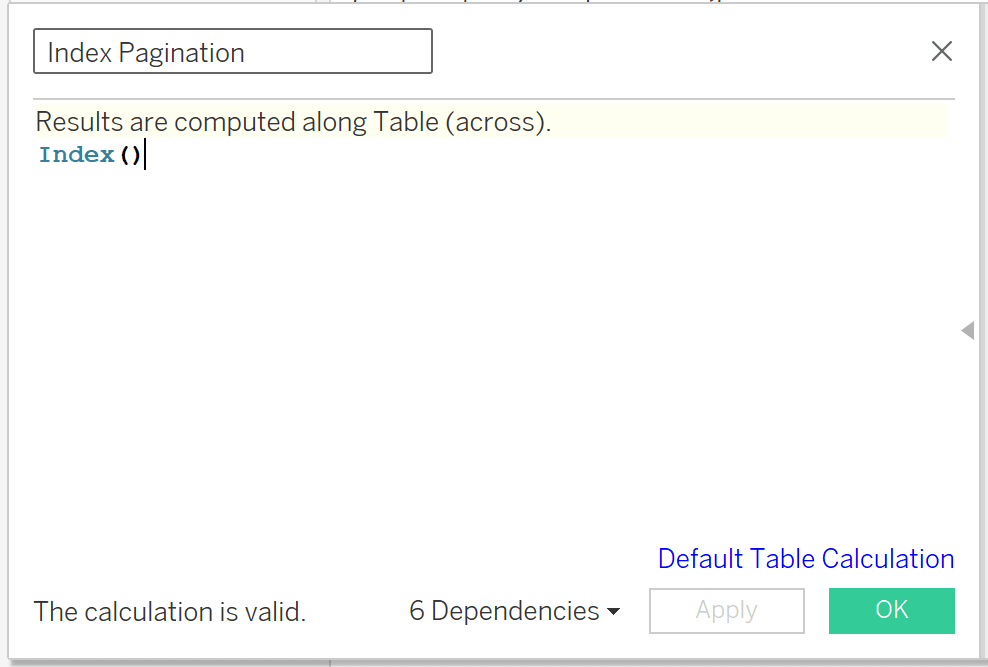
Now I am going to create a calculated field that is called Index Pagination. It is just the Index function and will be used in future calculations as well as on the dashboard display.
Continue reading with a free account, or login.
Unlock this tutorial and hundreds of other free visual analytics resources from our expert team.
Already have an account? Sign In
By continuing, you agree to our Terms of Use and Privacy Policy.
Create the pagination logic
Next, create the calculated field that will serve as the pagination logic. This formula is essentially saying that if for instance, if the number of rows per page is 25, and the page number is 3, then rows 51 through 75 will be shown. If the page number is equal to 1 and if the row number is less than or equal to the page number times page size, then true.
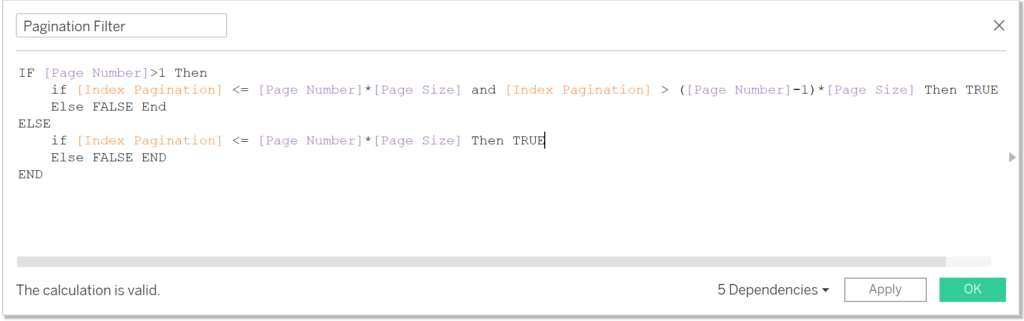
IF [Page Number]>1 THEN
IF [Index Pagination] <= [Page Number]*[Page Size] AND [Index Pagination] > ([Page Number]-1)*[Page Size] THEN TRUE
ELSE FALSE END
ELSE
IF [Index Pagination] <= [Page Number]*[Page Size] THEN TRUE
ELSE FALSE END
END
Assemble the data visualizations
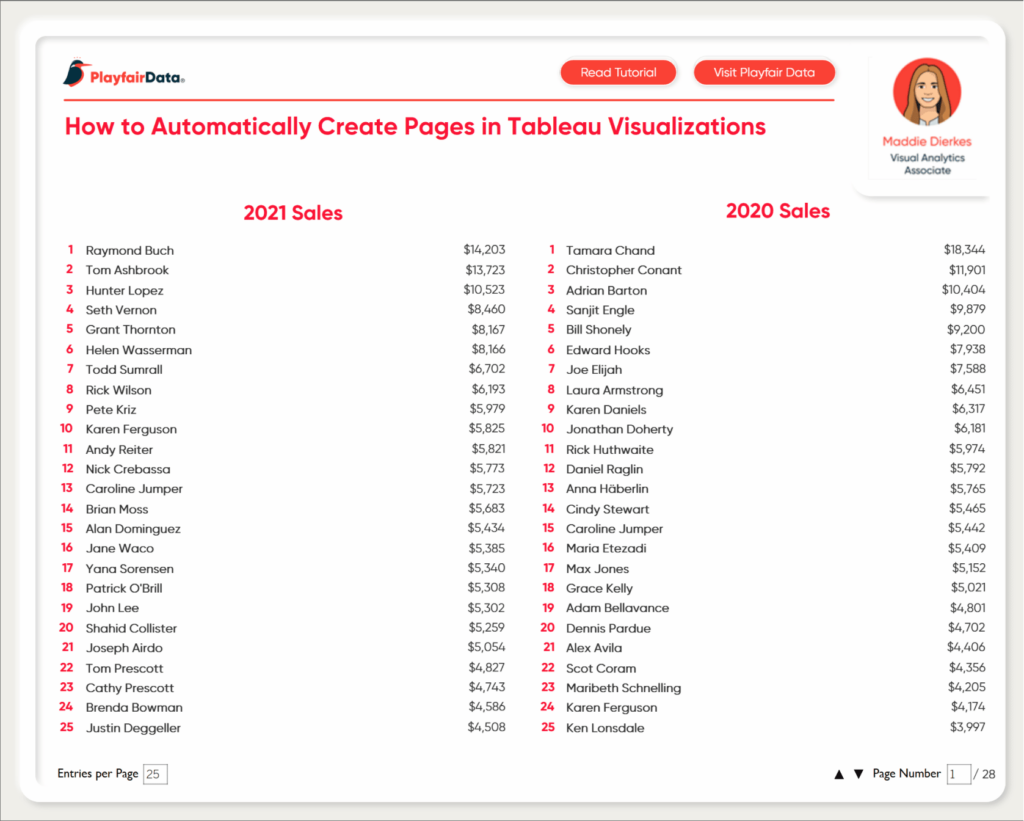
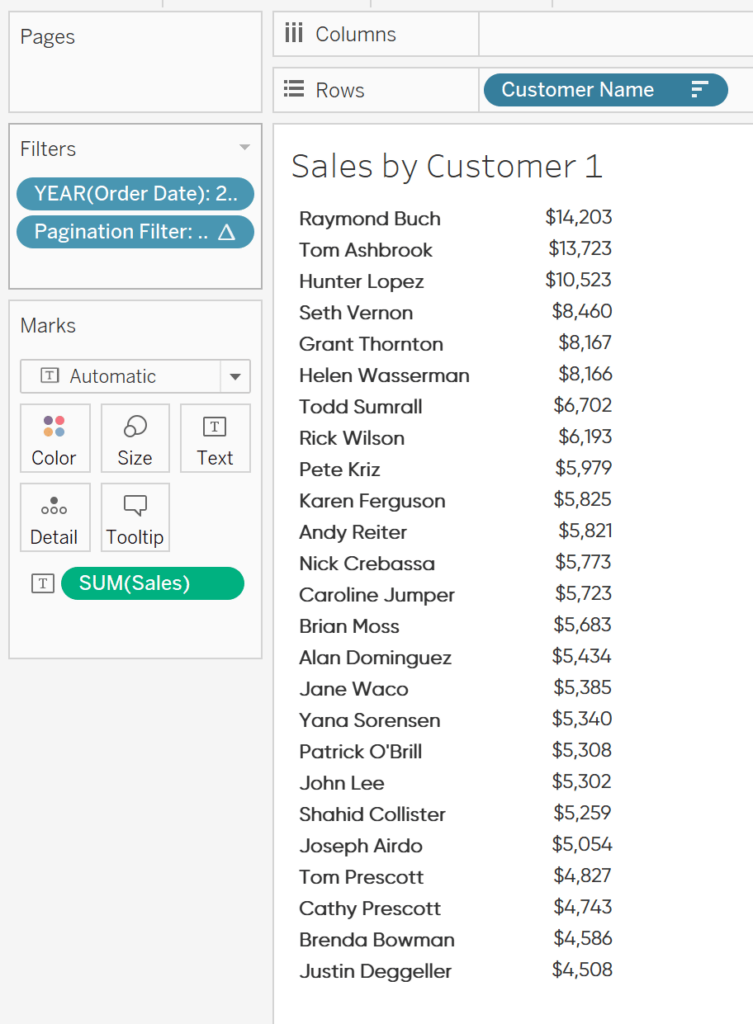
Now it is time to assemble the charts. I am going to create two text tables. For the first, drag Customer Name to the Rows shelf and Sales to the Text property of the Marks card. The aggregation should automatically be SUM. Drag Order Date to the Filters shelf and set it equal to 2021. Then drag the Pagination Filter calculated field we created to the Filters shelf and set it as True. Sort descending by Sum of Sales. To create the second table, duplicate this sheet and change the year of Order Date to 2020. Now you will be able to see the top 25 customers for both 2020 and 2021. You should have something that looks like this:
Before I assemble my dashboard, I am going to create one more sheet. Create a calculated field and call it Max Pages, which will calculate the total pages based on the page size and number of customers. Since the max number of pages per year we are looking at could differ between the two years, I will need to create an LOD that is fixed on the Year of the Order Date. The formula may change depending on the fields you use.
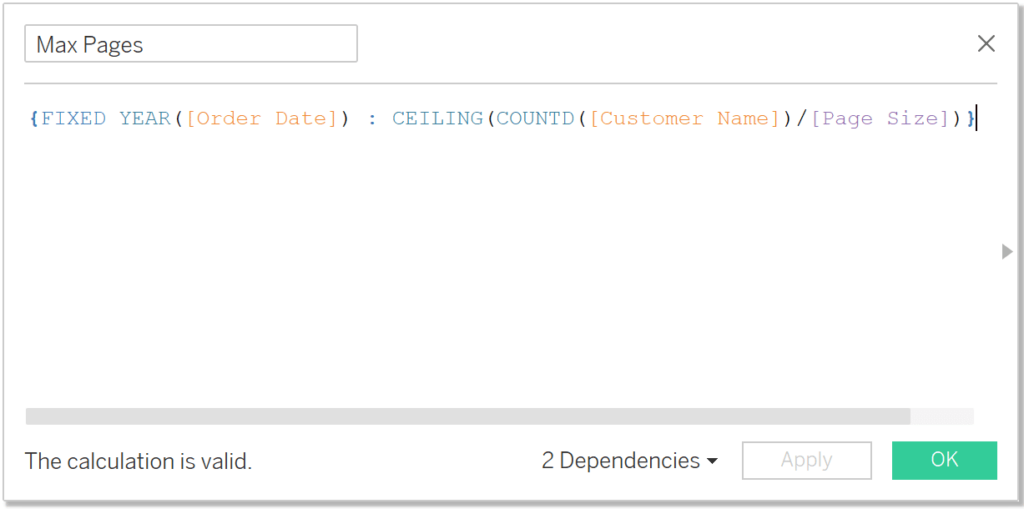
{FIXED YEAR([Order Date]) : CEILING(COUNTD([Customer Name])/[Page Size])}
Drag Max Pages to the Text property of the Marks card and change the aggregation to MAX. Now drag Order Date to the Filters shelf and select 2020 and 2021. I am going to open up the text editor and add a backslash in front of the Max Pages field, but feel free to format however you see fit. Once I assemble the dashboard you will understand its purpose.
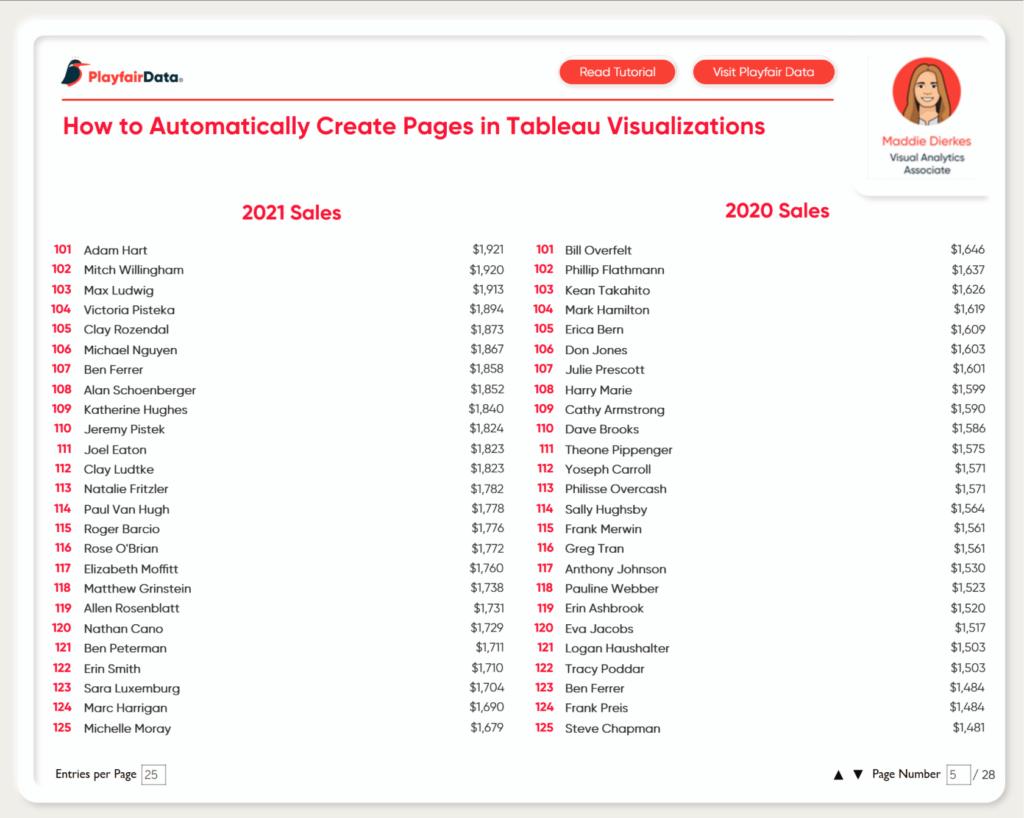
Now you can assemble your dashboard. Line up your two text tables and label the sales year. I am also going to add my parameters for Page Size and Page Number. You can format this how you see fit, but I am going to hide the titles, add some text boxes to create some labels, and drag in the Max Pages Sheet and line it up with the Page Number parameter. Below is the dashboard.

The user can now update the numbers of rows they want to see per page as well as the page number they want to navigate to.
You can take this one step further and create up and down arrows to navigate through the pages. To do this create two calculated fields one titled Page Up and the other Page Down. Below are the two calculations:
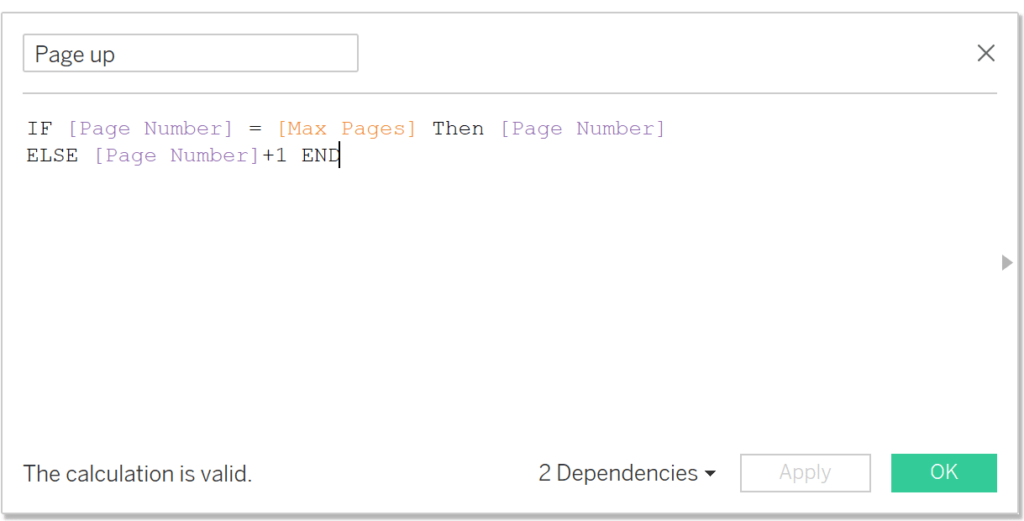
IF [Page Number] = [Max Pages] THEN [Page Number]
ELSE [Page Number]+1 END
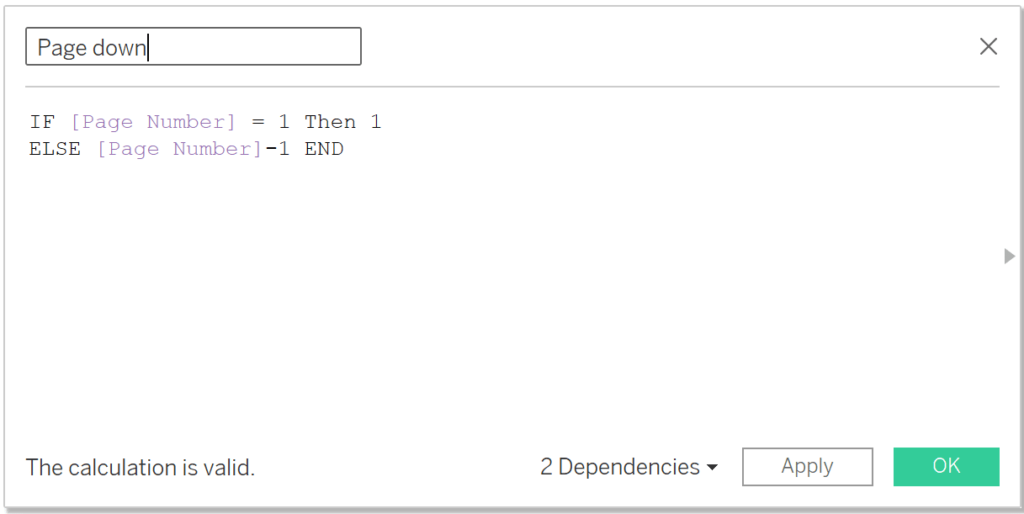
IF [Page Number] = 1 THEN 1
ELSE [Page Number]-1 END
![]()
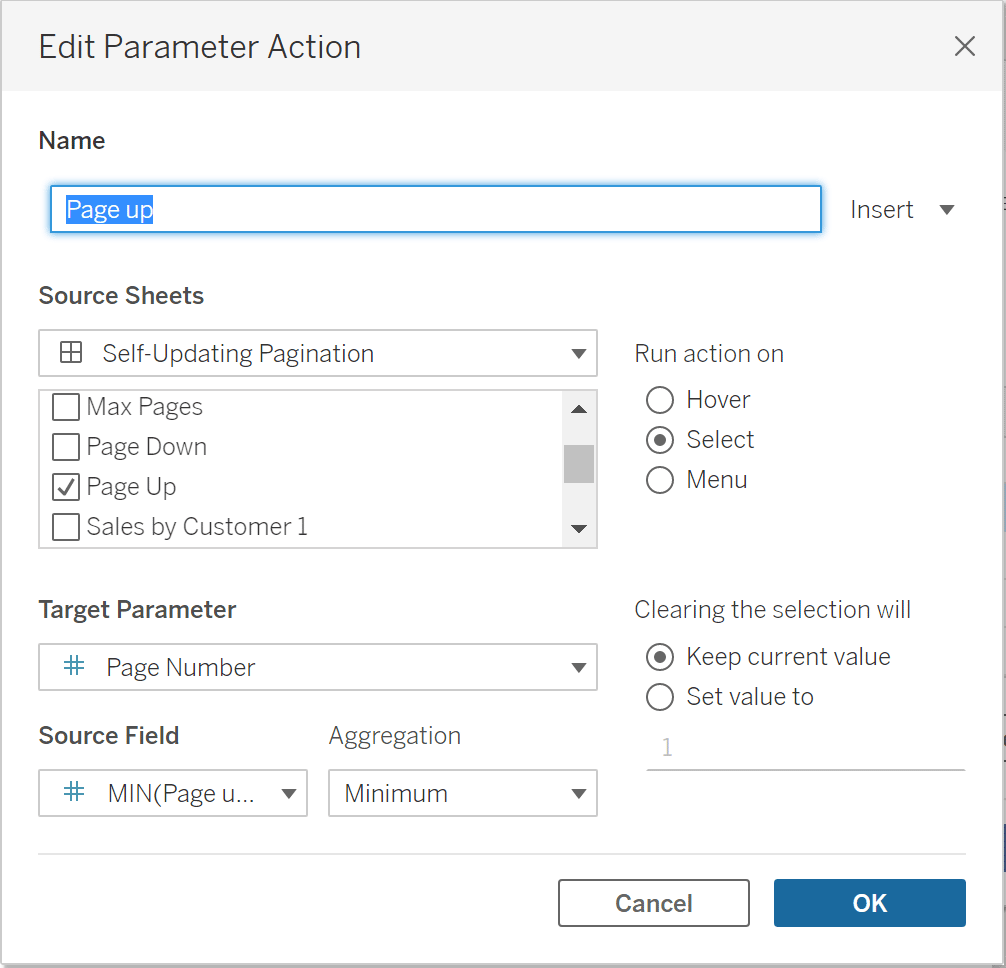
These two formulas are saying that if the page number is equal to either 1 or the max number of pages, leave as is. If not, add or subtract 1. Create two separate sheets and drag these to the Detail property of the Marks card. Change the aggregation to Minimum. Change the Mark type to Shape and then choose whichever shape you desire. I went with the classic up and down triangle. Drag onto your dashboard and format as you would like. Now you will need to create two parameter actions, one targeting the Page Up sheet and Page Up as the Source Field and the other Page Down. Both will have Page Number as the Target Parameter. Below is an example of the Page Up Parameter Action.
That’s it! Now your user can easily navigate through the pages and you can rest easy knowing that if the data updates, you won’t have to go back in and make any adjustments to the pages.
Stay after it,
Maddie


Written By
Maddie Dierkes

Peer Review
Alyssa Huff
Assoc. Director, Information Design

Graphic Design
Dan Bunker
Manager, Decision Engineering
Related Content
3 Ways to Implement Dynamic Pagination in Tableau

Pagination is a great tool you can use to improve user experience and minimize the footprint that tables occupy within…
How to Do Pagination in Tableau

To celebrate the release of Innovative Tableau: 100 More Tips, Tutorials, and Strategies, I’m releasing some bonus content to show…
How to Do Customer Segmentation with Dynamic Clustering in Tableau
Tableau has a few different built-in analytics features that allow you to both summarize and model your data in various…