How to Do Pagination in Tableau
To celebrate the release of Innovative Tableau: 100 More Tips, Tutorials, and Strategies, I’m releasing some bonus content to show you how to get more out of text in the software including Tableau pagination. Innovative Tableau contains 15 different ‘innovation’ series including “3 Innovative Ways to Use Text”, and this new series will share three more of my favorite tactics.
In this first of three posts, you will learn how to limit the number of rows being shown on a table until the user clicks a button to “turn the page” to the next set of rows. I will also share a trick for creating control sheets with custom dimension members without the need for a separate data source – and you’ll see how to use pagination to create better commenting systems on your dashboards.
Watch the related video with Playfair+
How to let users flip between ‘pages’ of crosstab rows in Tableau
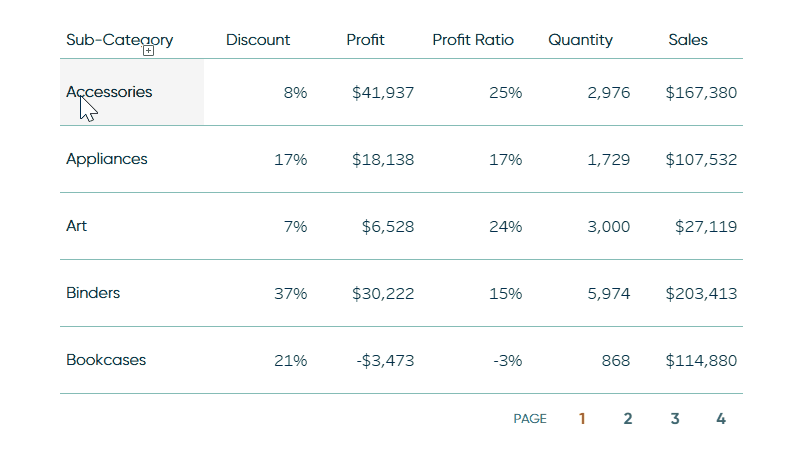
By the end of this tutorial, you will be able to use Tableau pagination to show five rows of sub-categories at a time in the Sample – Superstore dataset. Clicking a page number on the control sheet at the bottom of the table takes the user to a different subset of five sub-categories.
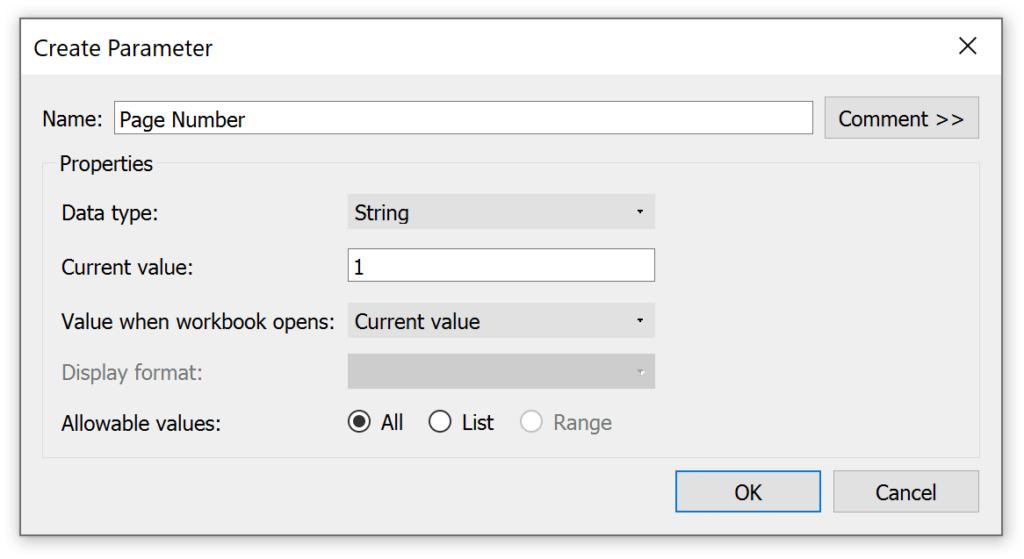
First, create a parameter with a data type of String and allowable values of All. The data type of String will help prevent confusion with aggregation in future steps (i.e. strings aren’t aggregated) and the allowable values of all means you can scale the number of page options for your table indefinitely (i.e. I can have 4 pages or 400 pages).
Next, create a control sheet with the page number options you need. I want the user to see five rows at a time, and there are 17 sub-categories, so for my Tableau pagination, I need four pages. Page one will eventually display rows 1-5, page two will display rows 6-10, page three will display rows 11-15, and the final page will show the remaining two rows.
![]()
I don’t have any fields in my dataset with the dimension members of “1”, “2”, “3”, and “4”, so one option is to use the trick I’ve shown before that involves connecting to a separate data source with custom parameter values. This makes it easier to create control sheets because you can create a dimension containing any custom values (i.e. 1, 2, 3, and 4).
Instead of connecting to a second data source, I’ll share another trick that allows you to create a dimension with custom dimension members. While I don’t have a dimension containing the members 1, 2, 3, and 4, I do have a dimension called Region which I know contains four members: Central, East, South, and West. If I can convert those dimension members into the selections I need, I can use the new dimension to create the page selector / control sheet.
Continue reading with a free account, or login.
Unlock this tutorial and hundreds of other free visual analytics resources from our expert team.
Already have an account? Sign In
By continuing, you agree to our Terms of Use and Privacy Policy.
To do so, duplicate the Region dimension by right-clicking on it and choosing “Duplicate”. Once the copy shows up, edit it by right-clicking on the copy and choosing “Edit…”. This will open a calculated field dialog box where you can rename the field to “Page Number” and create this calculation:
IF [Region] = ‘Central’ THEN ‘1’
ELSEIF [Region] = ‘East’ THEN ‘2’
ELSEIF [Region] = ‘South’ THEN ‘3’
ELSEIF [Region] = ‘West’ THEN ‘4’
END
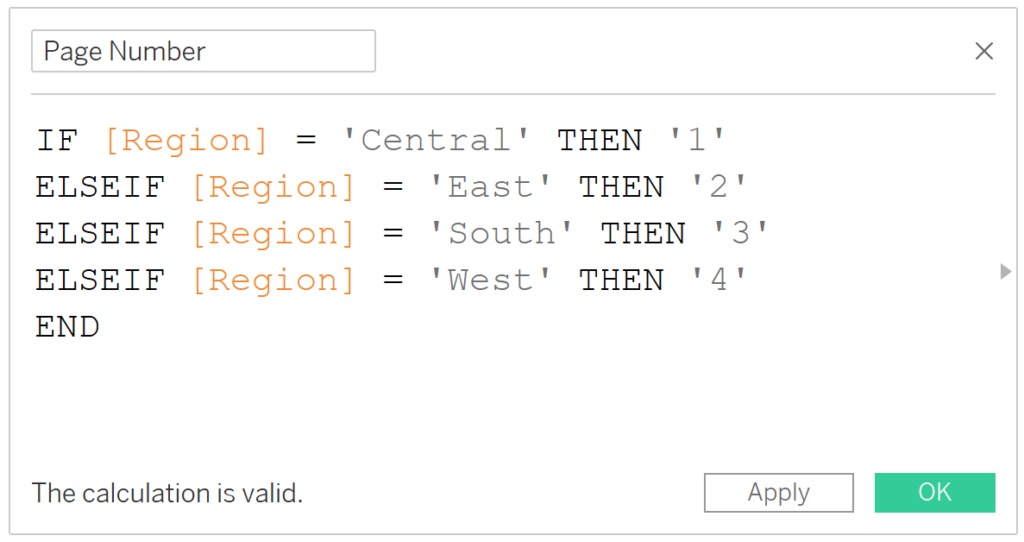
Note the tick marks around the numbers which ensure the data type of this calculated field matches the data type of the Page Number parameter I set up earlier.
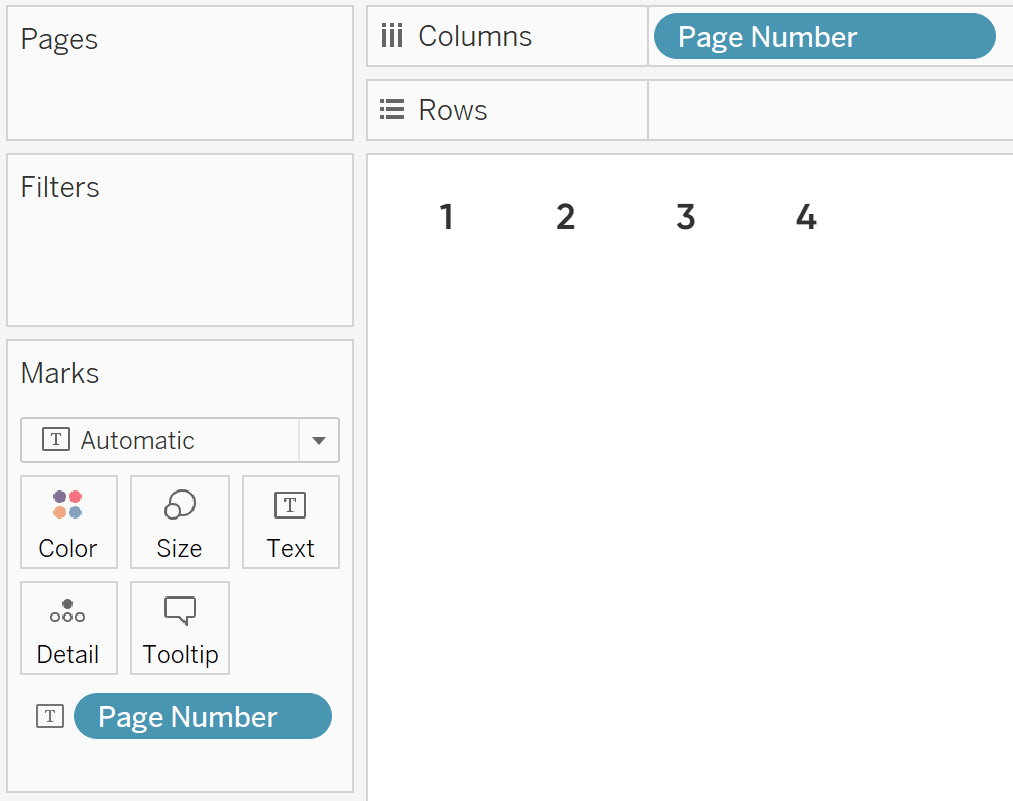
To create the control sheet for your Tableau pagination, place this new dimension on the Columns Shelf and Text Marks Card; then hide the first set of numbers by right-clicking any column header and deselecting “Show Header”.
You can stop here because this control sheet will work as is for the user’s page selection experience. However, one nice touch to add would be to highlight the page that the user is viewing, implying that clicking a different number will navigate them to a different page. To highlight the current page within the the Tableau pagination selector, create a Boolean calculated field with this formula:
[Page Number (calculated field)] = [Page Number (parameter)]
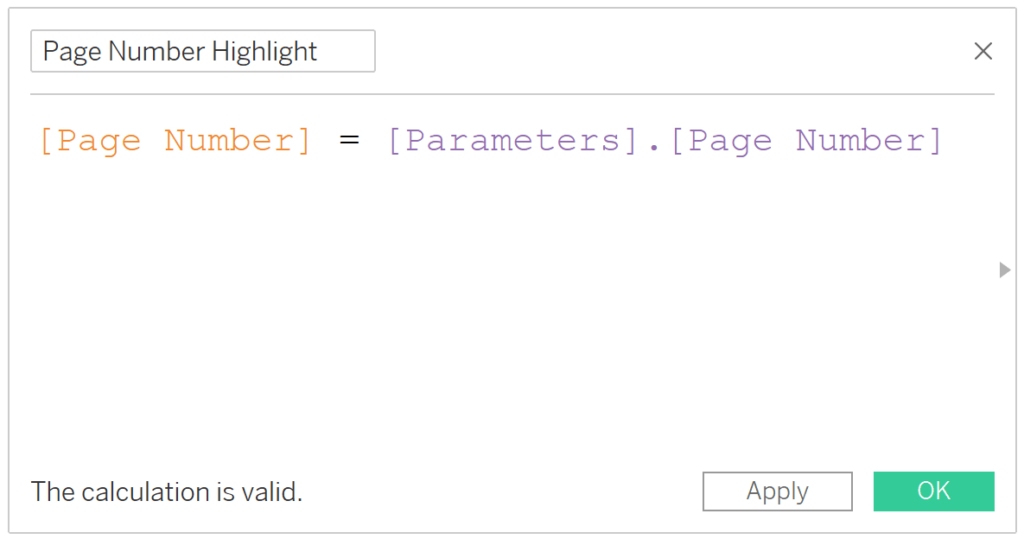
Then place this calculated field on the Color Marks Card of your control sheet.
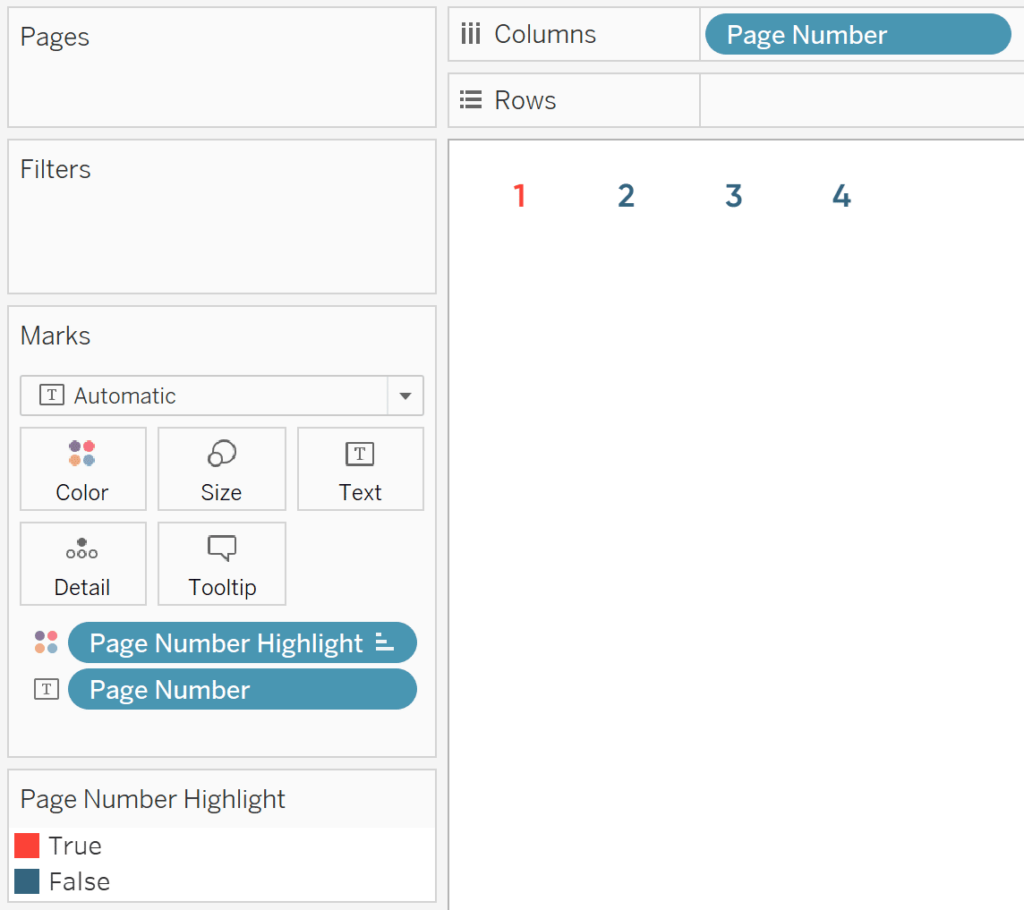
This will always color the page number that has been selected in the control sheet. Since the default current value of the Page Number parameter is 1, we are seeing the 1 on the view get classified as True and colored one way while everything else is classified as False and colored a second way.
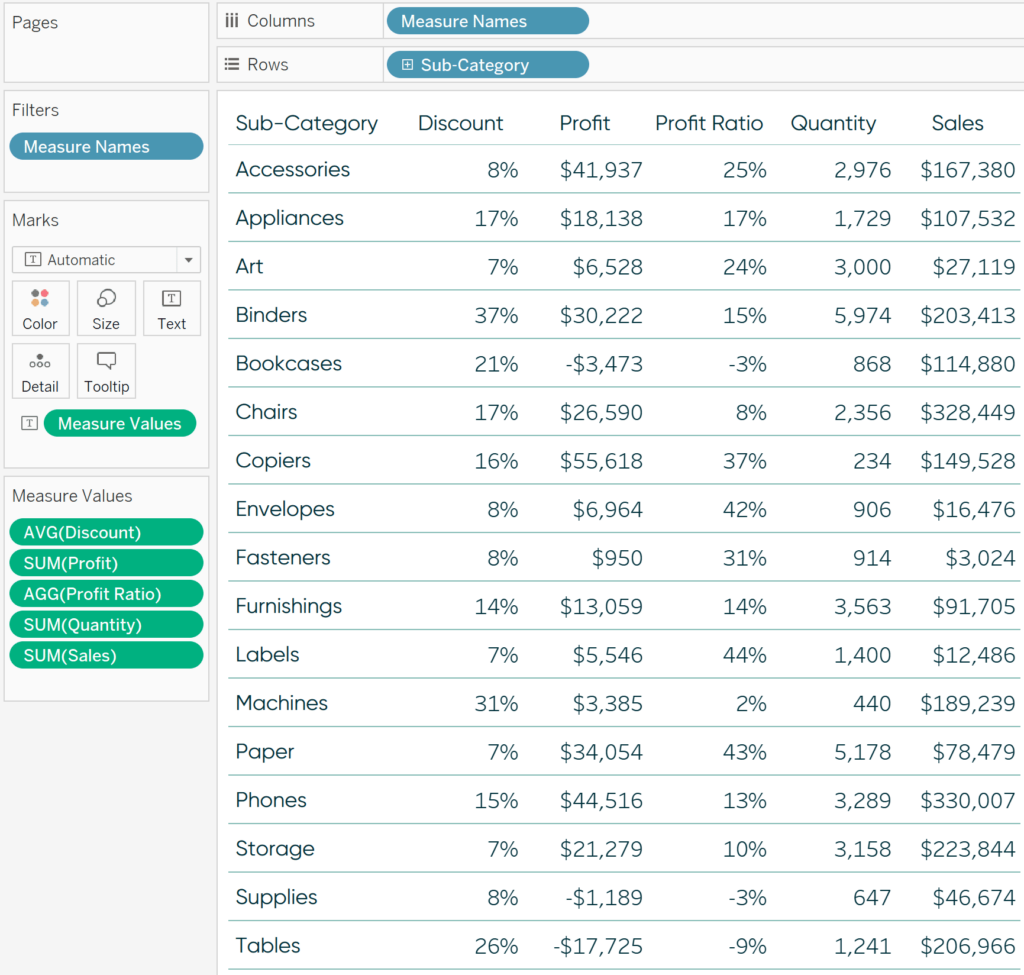
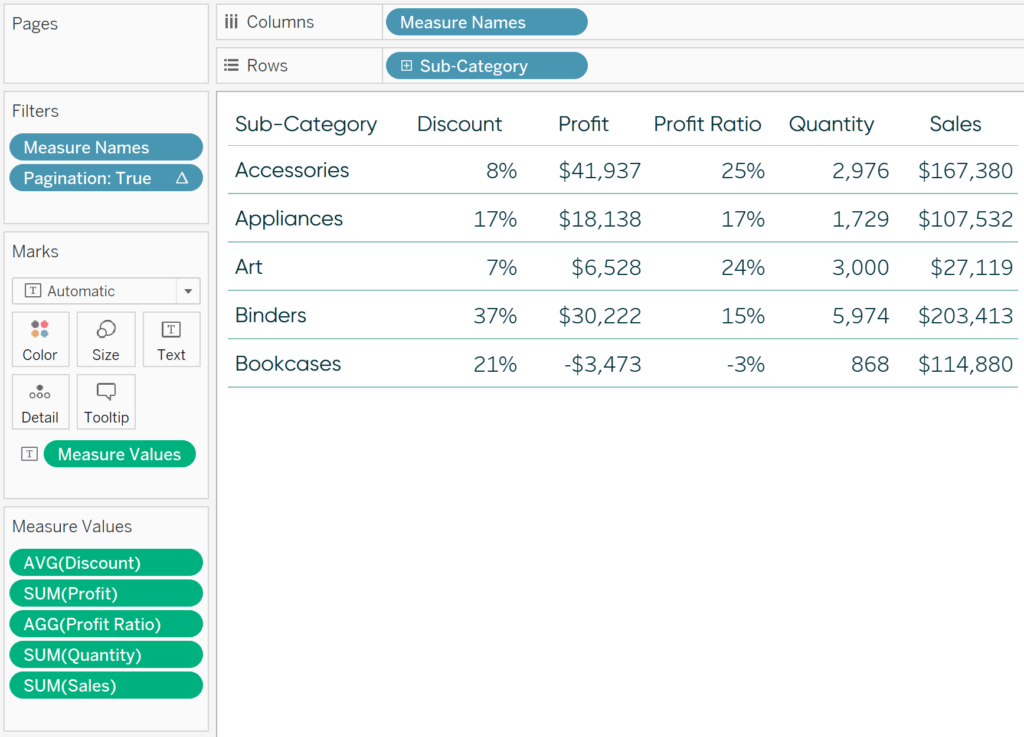
We’re now ready to create the corresponding table that goes with the Tableau pagination buttons. This table can be created with any combination of dimensions and measures, but for the purposes of illustration, I’ll create a crosstab that contains all of the measures in the Sample – Superstore dataset by the Sub-Category dimension.
Tips for Formatting Text Tables in Tableau
Now for the calculation that makes pagination in Tableau go. To create pagination, we need to use the INDEX() function, which I think of as being synonymous with “row number”, to display a subset of rows that are mapped to each selection in the Page Number parameter. For my use case of showing three “pages” of five rows and a fourth page with two rows, the formula is:
CASE [Parameters].[Page Number]
WHEN ‘1’ THEN INDEX() <= 5
WHEN ‘2’ THEN INDEX() > 5 AND INDEX() <= 10
WHEN ‘3’ THEN INDEX() > 10 AND INDEX() <= 15
WHEN ‘4’ THEN INDEX() > 15
END
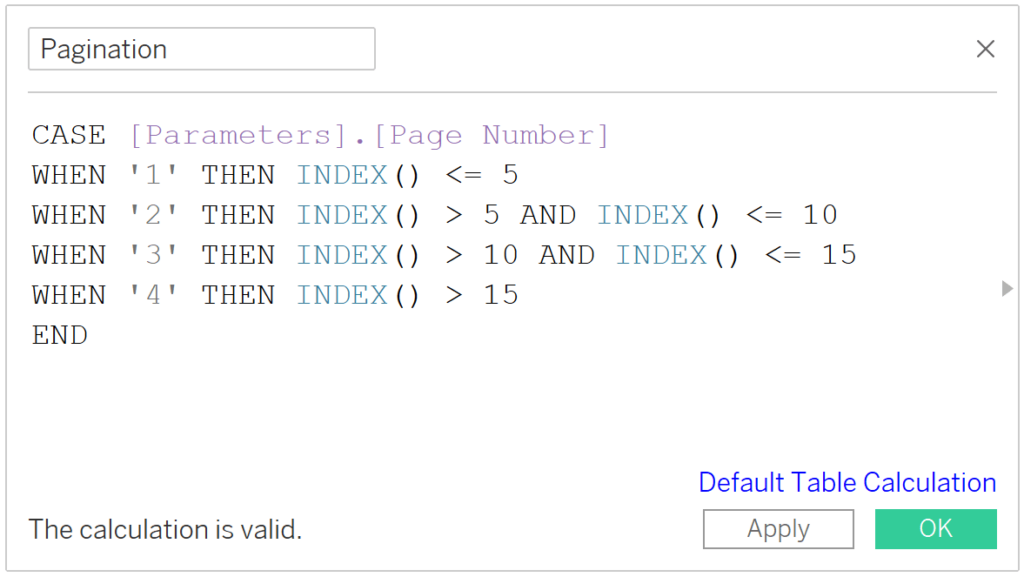
This calculated field creates a unique Boolean filter for each page number selected. When page 1 is selected (and only True values are kept on the view), the filter will keep rows less than or equal to 5; when page 2 is selected, the filter will keep the rows greater than 5, but less than or equal to 10; when page 3 is selected, the filter will keep the rows greater than 10, but less than or equal to 15; and when page 4 is selected, the filter keep the rows greater than 15.
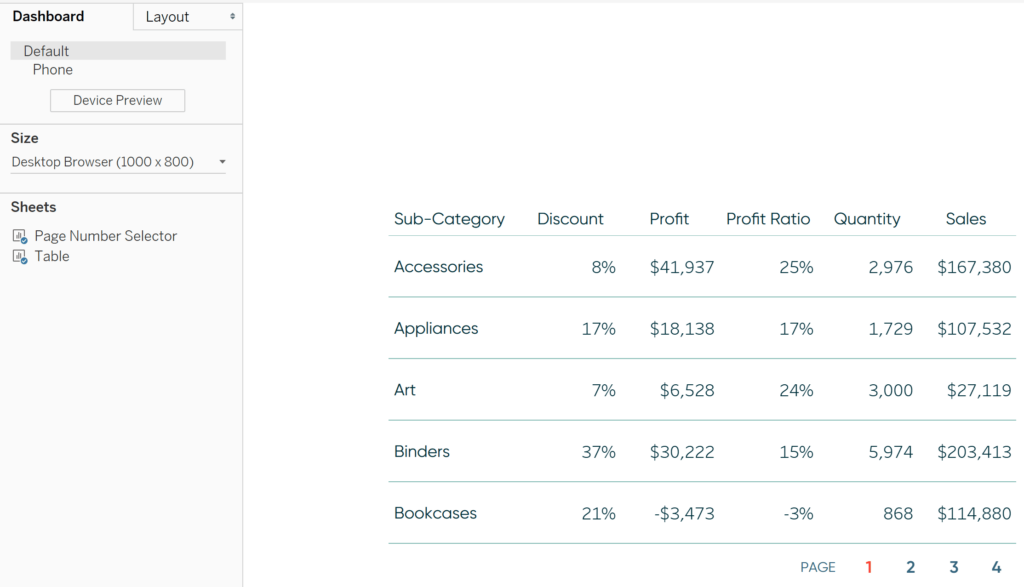
Here’s how the table looks after adding the new Pagination calculated field to the Filters Shelf and keeping only “True” values.
Remember, the current value of the Page Number parameter is still 1. The number 1 is mapped to rows less than or equal to 5 in our Pagination calculated field, and by using this calculated field as a filter, we are left with the first five rows in the table.
Using Tableau’s INDEX() Function for Easier Top N Filtering
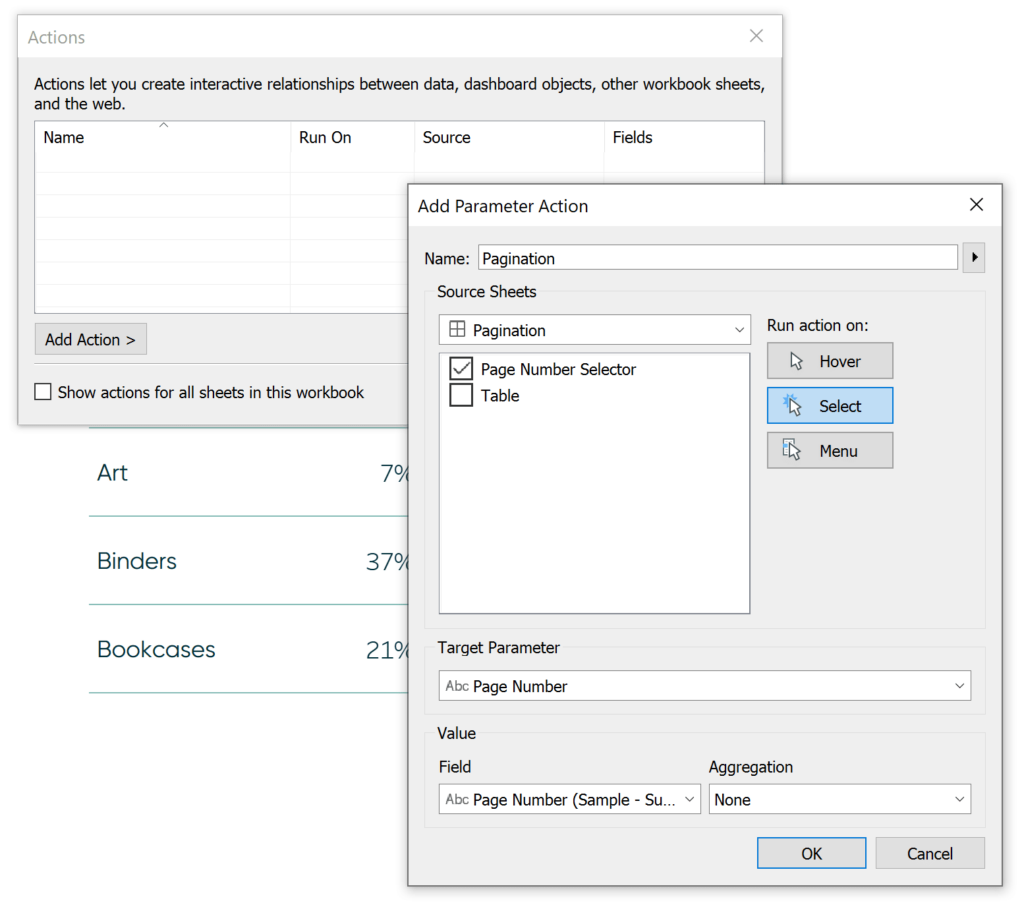
To link our Page Number Selector to this table, place both sheets on a dashboard and add a Change Parameter dashboard action.
To add the parameter action, navigate to Dashboard > Actions… in the top menu. When the dialog appears, click the Add Action button and choose “Change Parameter”. For my Tableau pagination use case, we are overwriting the Page Number parameter with the Page Number calculated field value when a user clicks anywhere on the Page Number Selector sheet; my settings are as follows:
How to Use Tableau Parameter Dashboard Actions
Now if I click the number 2 on my Page Number Selector control sheet, the value of 2 overwrites my Page Number parameter. That value then causes the Page Number Highlight calculated field to move the red coloring to the second value and my Pagination calculated field to keep rows 6 through 10.
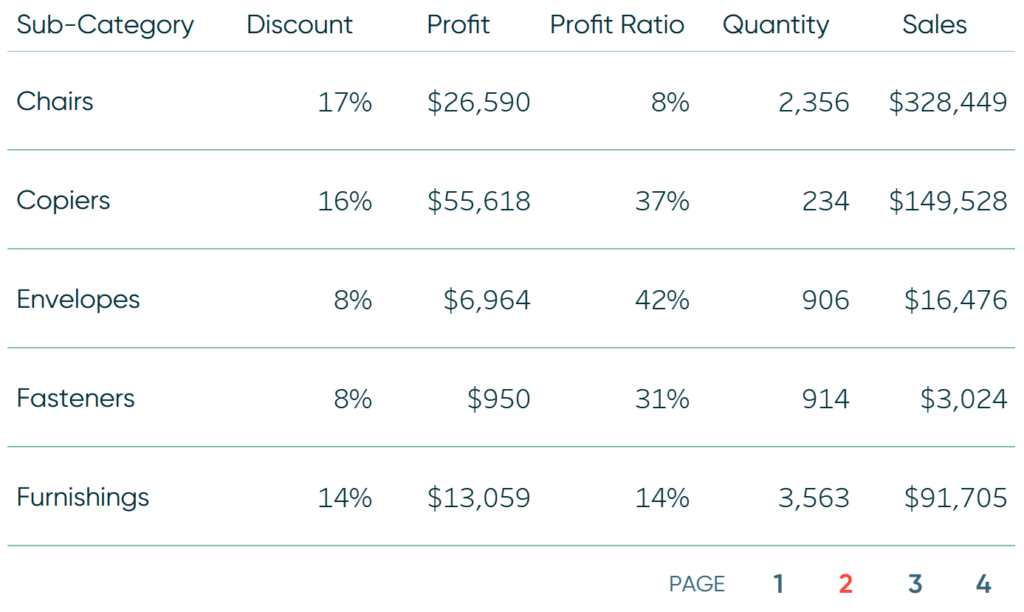
If I click the 3, I see rows 11 through 15.
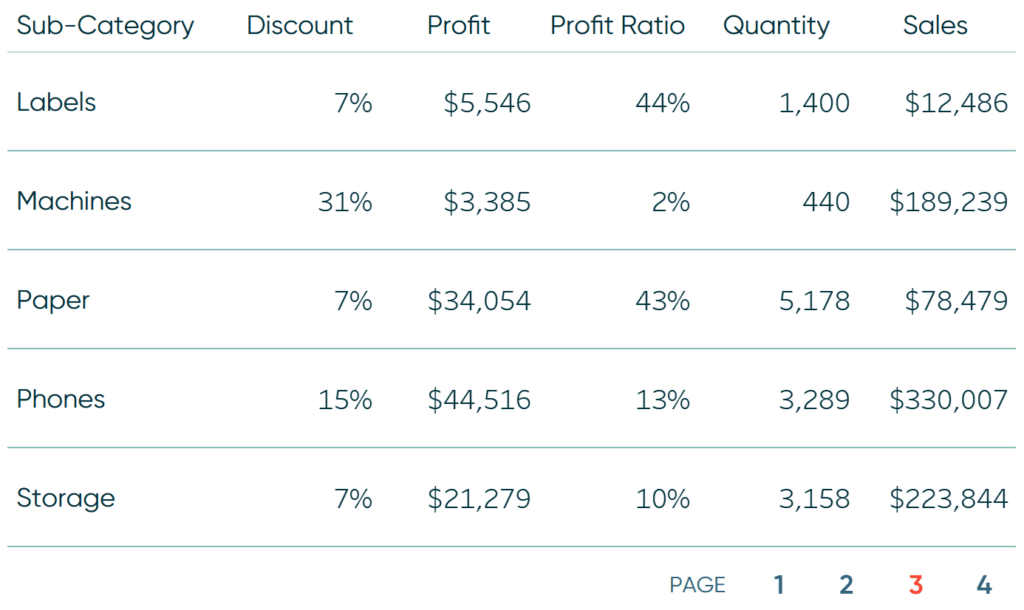
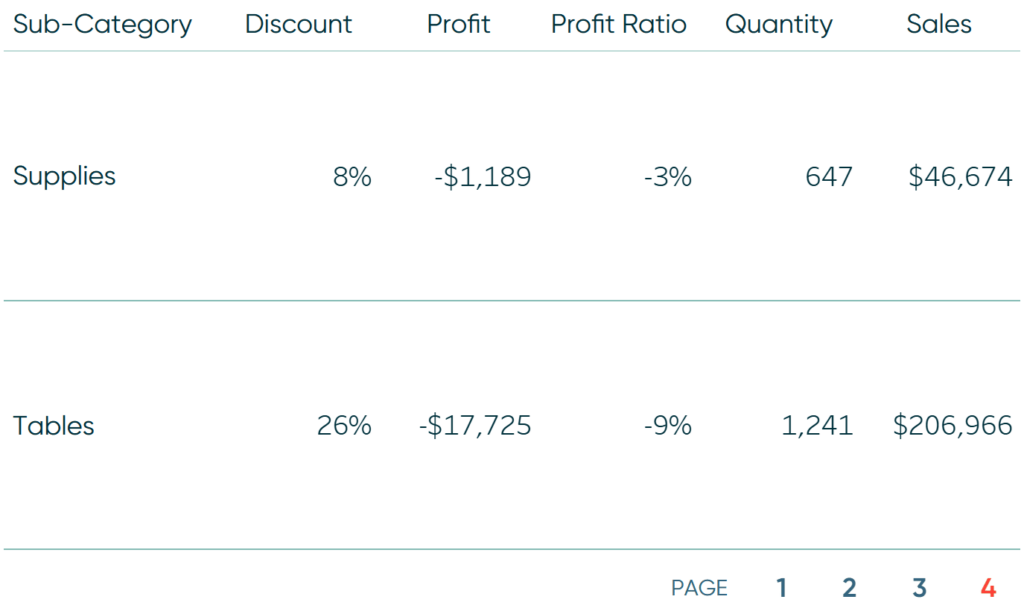
And if I click the 4, I see the final two rows.
How to use Tableau pagination for better commenting systems
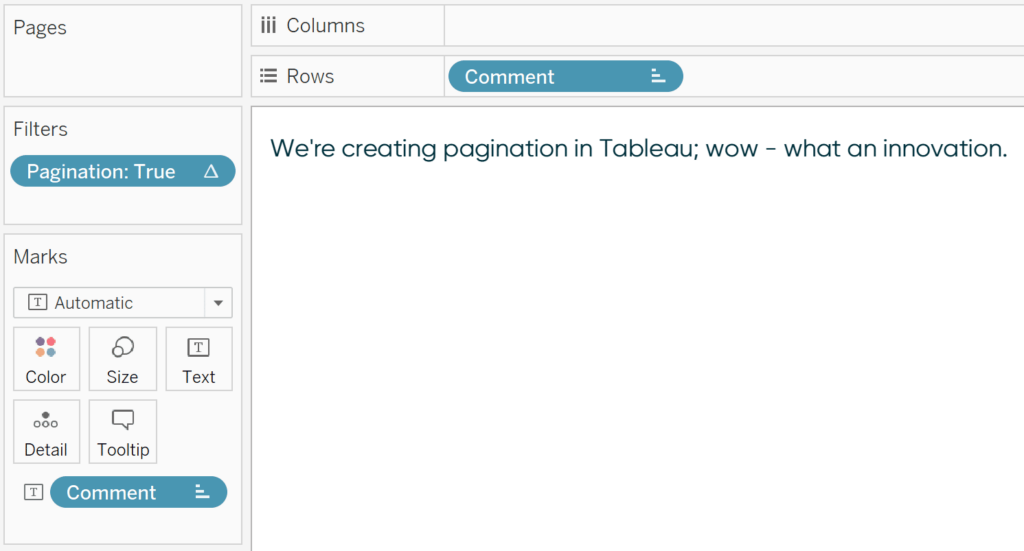
Another application of pagination in Tableau is to display a limited number of custom comments at a time. Commenting is an excellent way to provide context and make dashboards actionable, but they can be bulky / challenging to accommodate in a dashboard. Let’s say you created my favorite commenting system in Tableau, but only want to display one comment at a time.
First, I’ll connect to my data source with my comments and make a table.
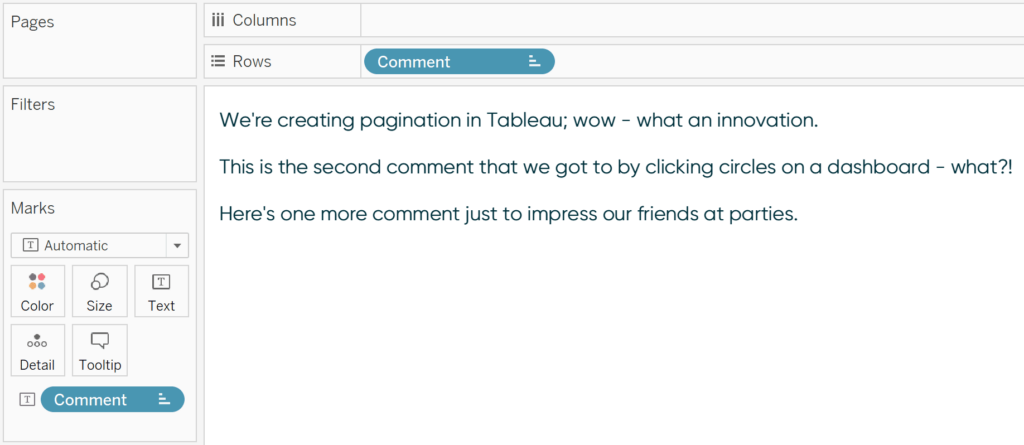
Since we’re only showing one comment (i.e. row) at a time, I can simplify the Pagination calculated field with this formula:
INDEX() = INT([Page Number])
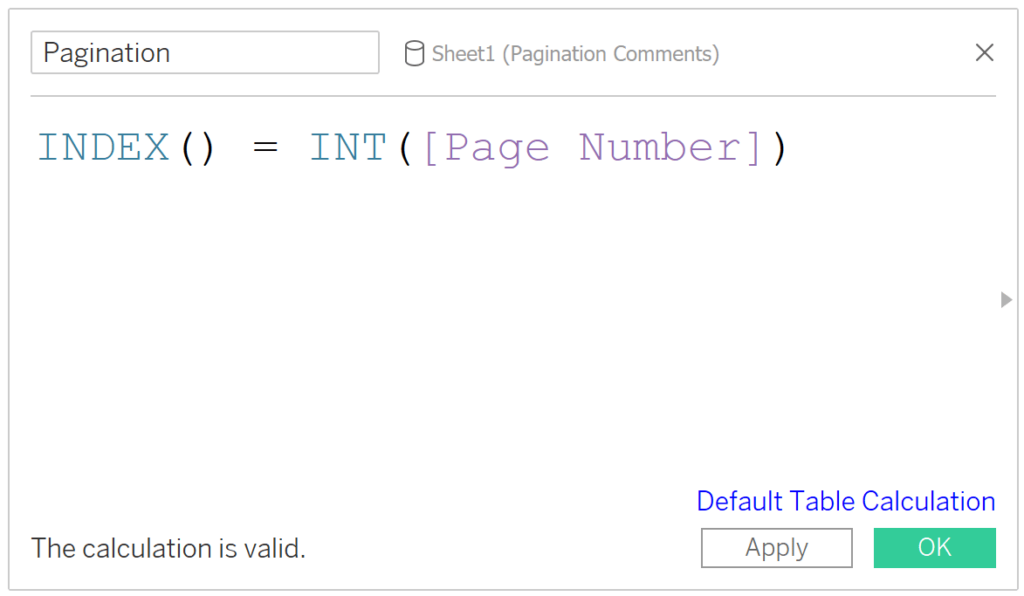
This calculation keeps the row number currently selected in the Page Number parameter. The function INT was added because the Page Number parameter has a data type of String and we need to convert those strings to integers to work along with the INDEX() function.
![]()
Now if I place this calculated field on the Filters Shelf and keep only True values, I will see one comment at a time. I changed the current value of the Page Number parameter back to “1”, so we are left with the first comment on the table.
To finalize this illustration, I’ll replace the table on my dashboard with my table of comments. For a different look on my page selector, I will also change the mark type to Circle, remove the Page Number labels, and filter the selector to the first three pages (since there are only three comments).

The parameter action from the first use case is still intact. If you skipped straight to this use case of using pagination with comments, you would need to ensure a parameter action is in place that overwrites the Page Number parameter to display the correct “page”, or in technical terms, filters to the correct INDEX() value.
Now clicking the second circle flips to the second comment.

And clicking the third circle flips to the third comment.

Imagine these comments being listed below a nice visualization or at the bottom of a dashboard. We’ve just created a streamlined commenting system thanks to pagination in Tableau!
Thanks for reading,
– Ryan


Written By
Ryan Sleeper
Related Content
3 Ways to Implement Dynamic Pagination in Tableau

Pagination is a great tool you can use to improve user experience and minimize the footprint that tables occupy within…
How to Automatically Create Pages in Tableau Visualizations

Pagination is a useful tactic to add additional user experience to a dashboard while keeping them clean and orderly. Sometimes…

Ryan Sleeper
Make filter results more predictable by basing them on row number Do your filters ever return a result you weren’t…