How to Make Your New Favorite Commenting System in Tableau

I’ve shown you in the past how to add custom integrated insights to a Tableau dashboard. This tactic allows you to communicate insights and recommendations directly on dashboards. Two drawbacks to this approach are (1) you have to navigate the user to a different view to enter their commentary and (2) the text is static until the comments are updated manually.
This post shares a new approach to adding custom comments directly to a Tableau dashboard by integrating Google Forms and using layout containers to create a seamless commenting system. On top of that, the comments can be filtered by date and user!
How to integrate Google Forms with a Tableau dashboard to add commentary
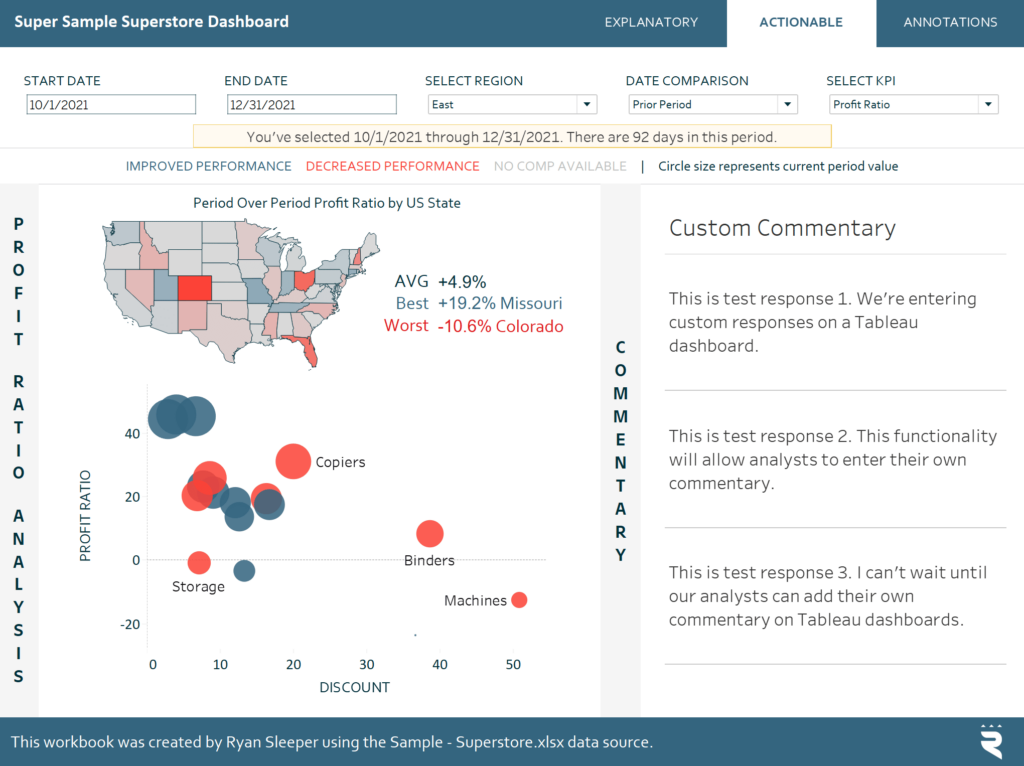
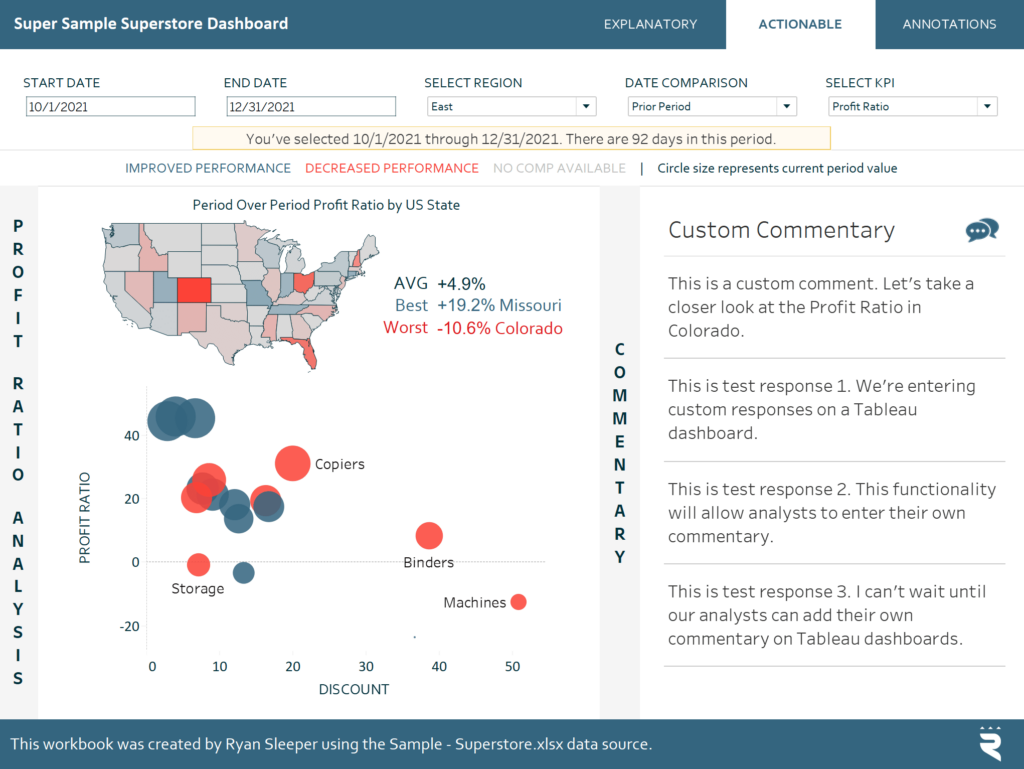
To illustrate how to create flippable comment cards in Tableau, we are going to recreate the right-side of this variation to the Super Sample Superstore dashboard.
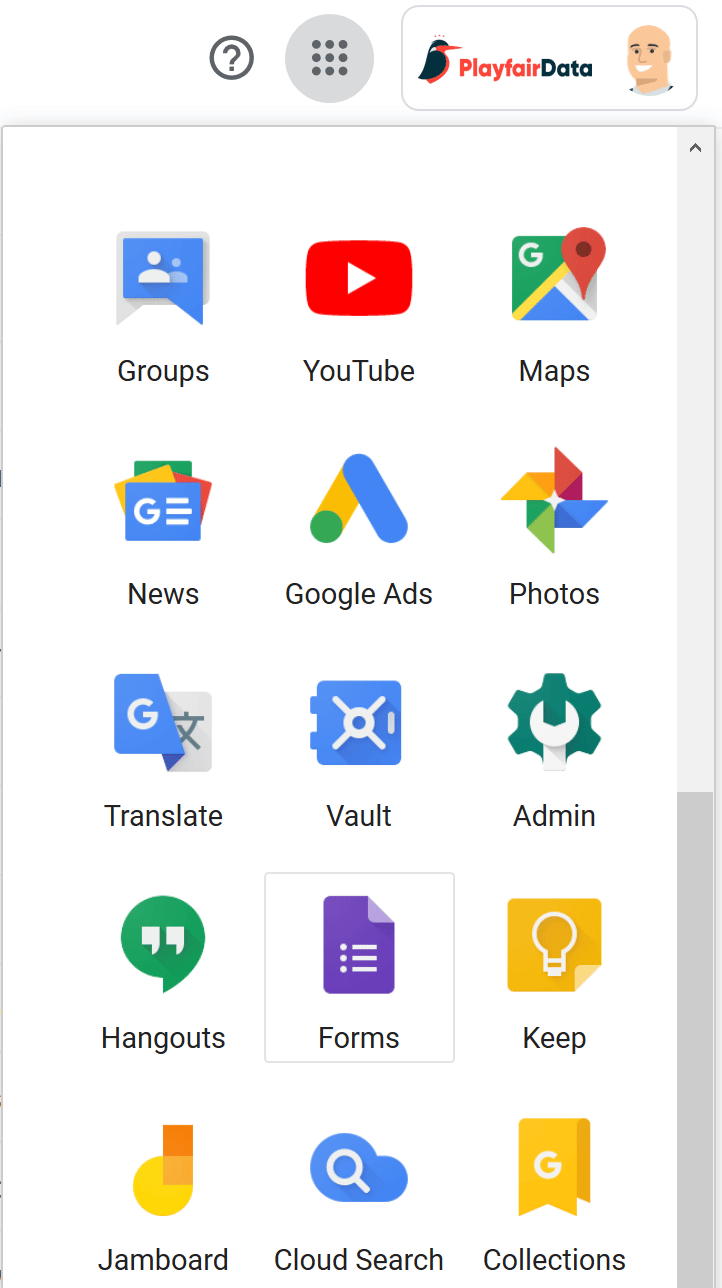
First, set up a Google Form, a free tool that comes with Gmail accounts. You can find / add to your Google Forms by clicking the Google apps menu next to your avatar in the top right corner of your Gmail account and clicking the More button.
Setting up the Google Form
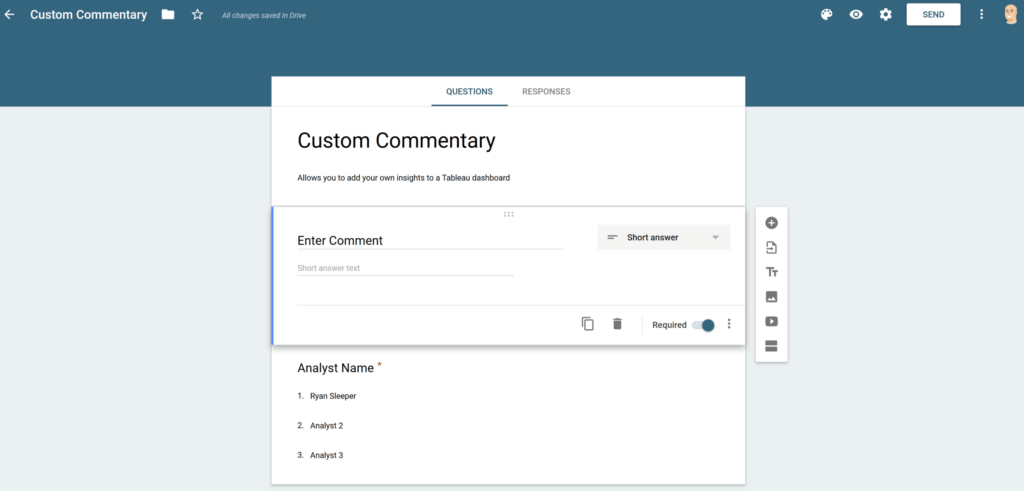
You can add questions to a Google Form by clicking the plus sign in the top-right corner of the form. I recommend adding at least one ‘Short Answer’ question and one ‘Multiple Choice’ question.
![]()
The short answer will eventually be the comment displayed on a dashboard and the multiple-choice question can be used to have the analyst select who entered the comment.
Continue reading with a free account, or login.
Unlock this tutorial and hundreds of other free visual analytics resources from our expert team.
Already have an account? Sign In
By continuing, you agree to our Terms of Use and Privacy Policy.
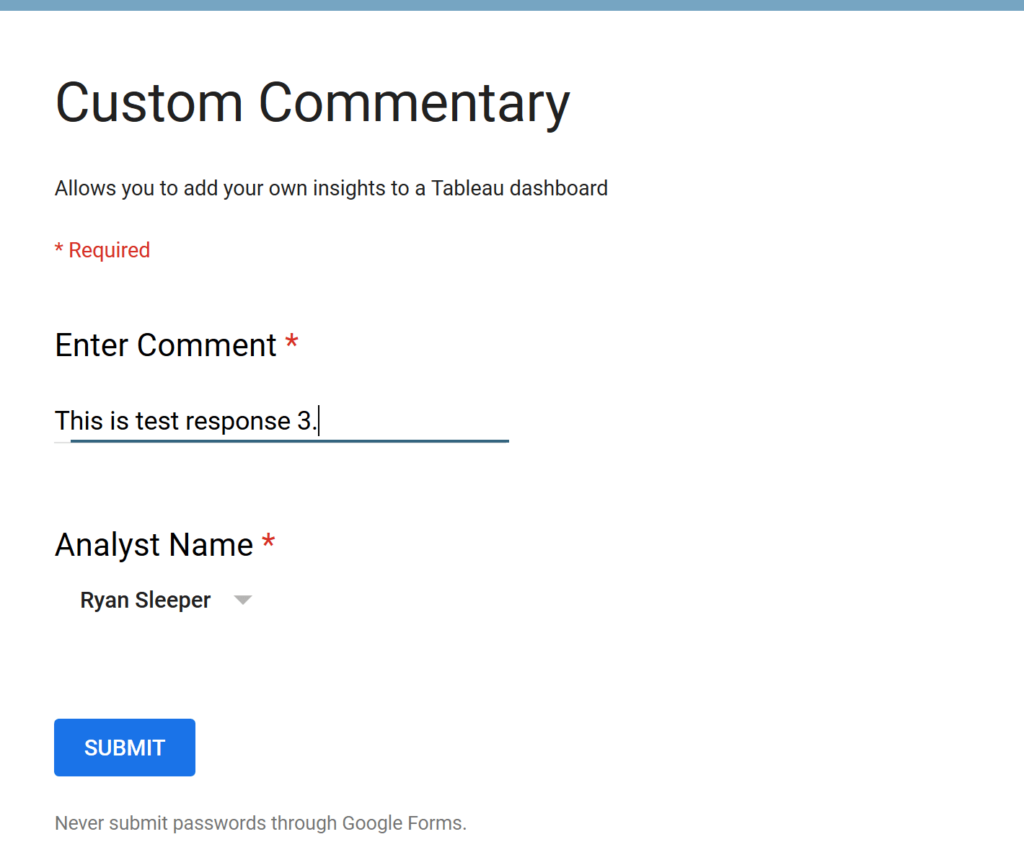
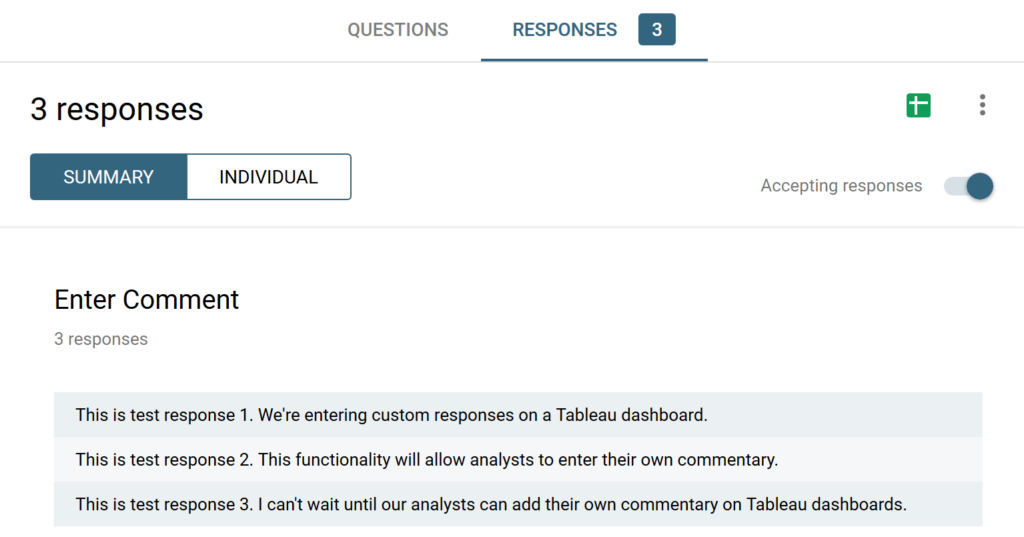
When your form is ready, click the SEND button towards the top-right corner of the browser, navigate to the link tab, copy and paste the share link into a different browser, and enter two or three test responses. These test responses will allow us to lay the foundation of the comment sheet being used on the dashboard. I also recommend you take note of the share URL because you will need it in a future step.
Creating the response data set
Next, navigate back to where you created the Google Form, click the Responses tab, and click the Google Sheets icon in the top-right corner of the form to convert the responses to a data source.
Back in Tableau Desktop, connect to a new data source and connect to the Google Sheet you created in the preceding step. For best results, leave the connection as Live so the latest responses can be brought into the dashboard with a quick refresh.
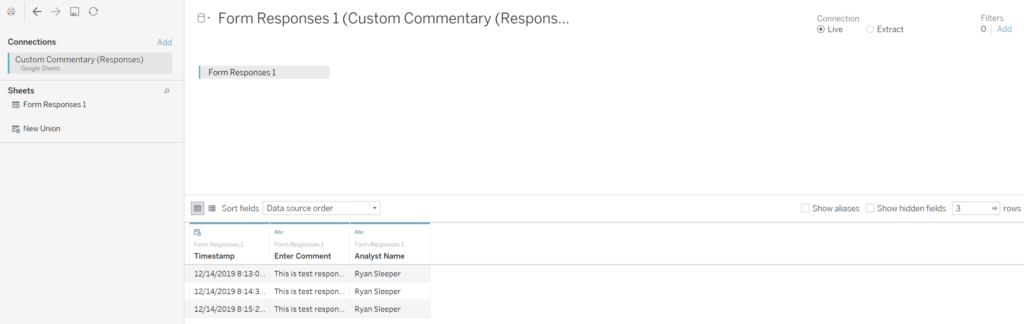
Create a new sheet with a table of responses formatted as you wish.
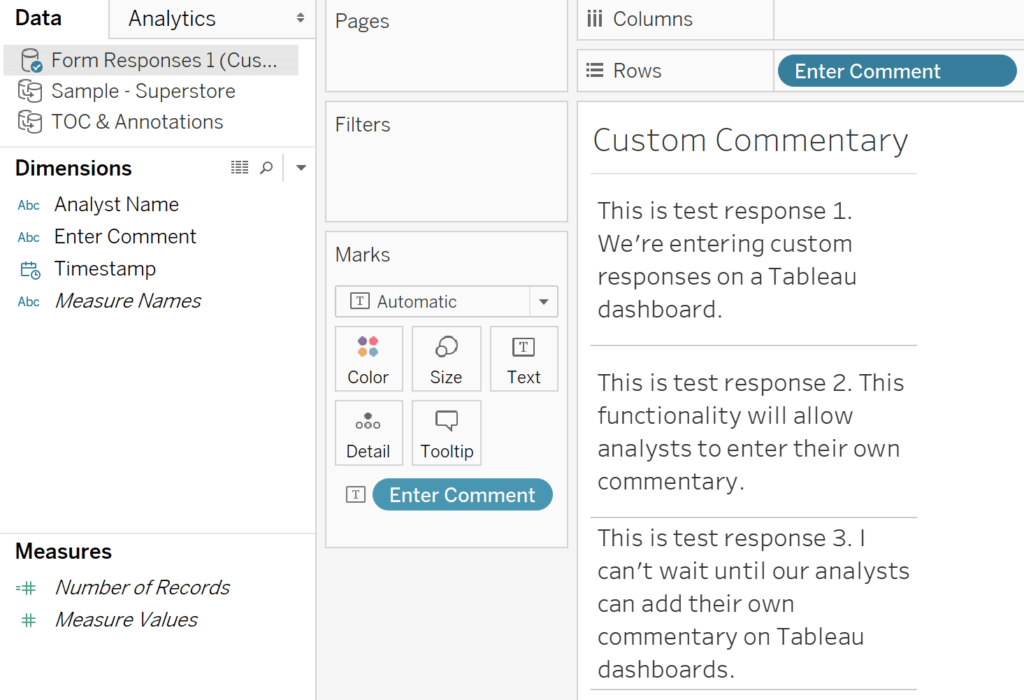
Note that Google Forms automatically creates a dimension called Timestamp that will allow you to filter the comments to relevant timeframes. You can also use an INDEX() filter to keep only the N most recent comments. Once the worksheet containing the comments is ready, place it on your dashboard.
Herein lies the magic.
Custom commentary in Tableau
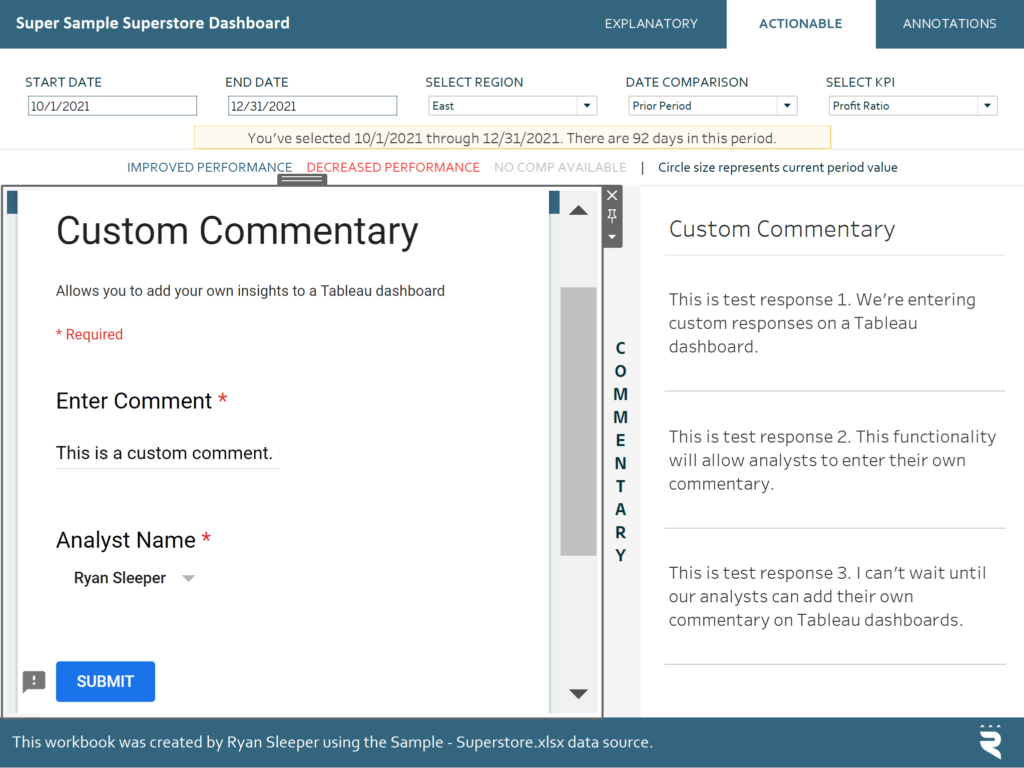
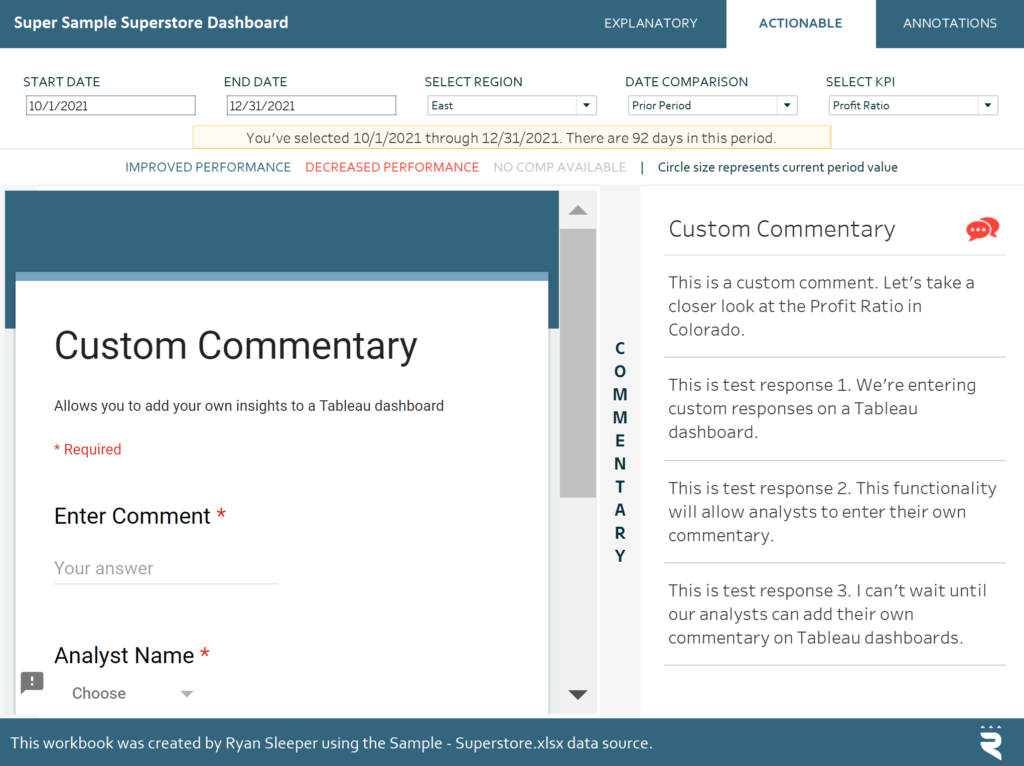
Place either a horizontal or vertical layout container as a floating object on top of the dashboard wherever you want the analyst to enter their insights. Then place a Web Page object inside of the layout container and copy and paste the Google Form share link from above as the URL.
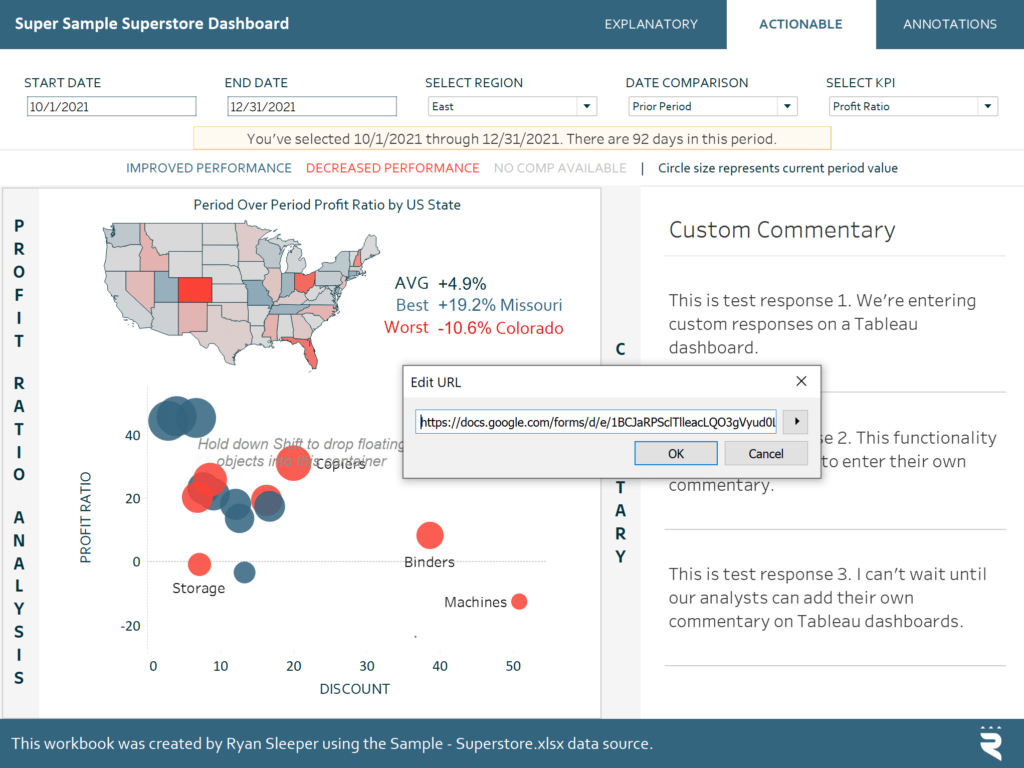
This will iframe the Google Form into a Tableau dashboard where additional comments can be added.
After refreshing the data source by navigating to Data > [the data source] > Refresh, the new comment appears on the dashboard!
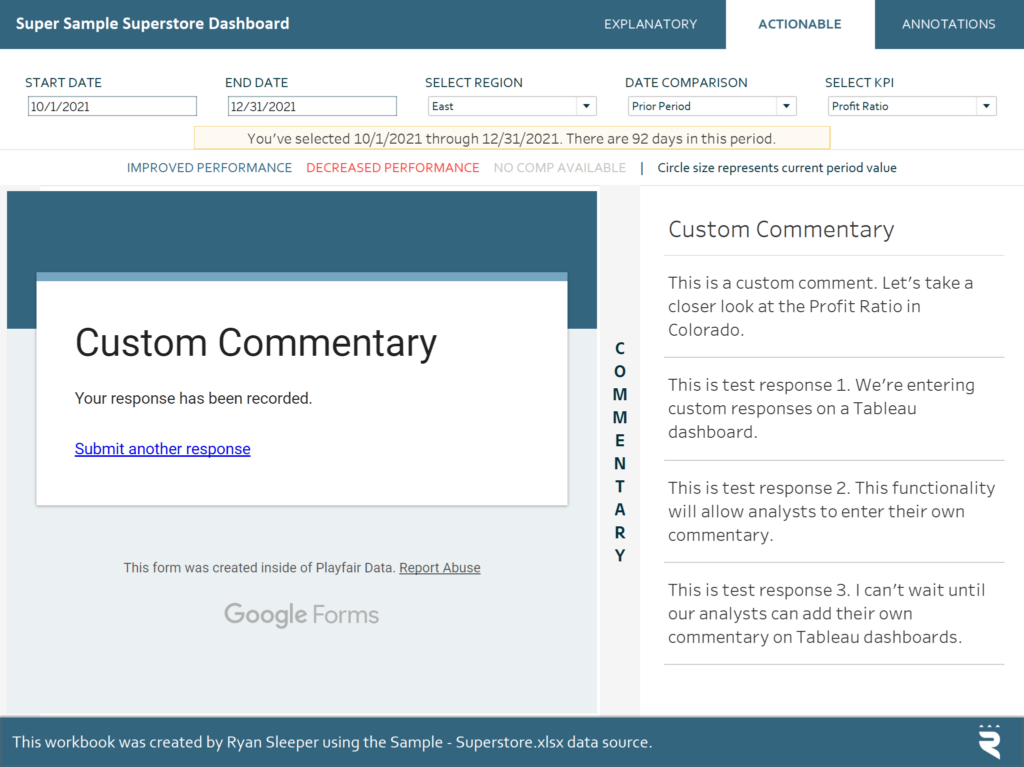
This works even better on Tableau Server or Tableau Online because the user simply has to click the Refresh button in the top of the browser window to get the latest comments to appear.
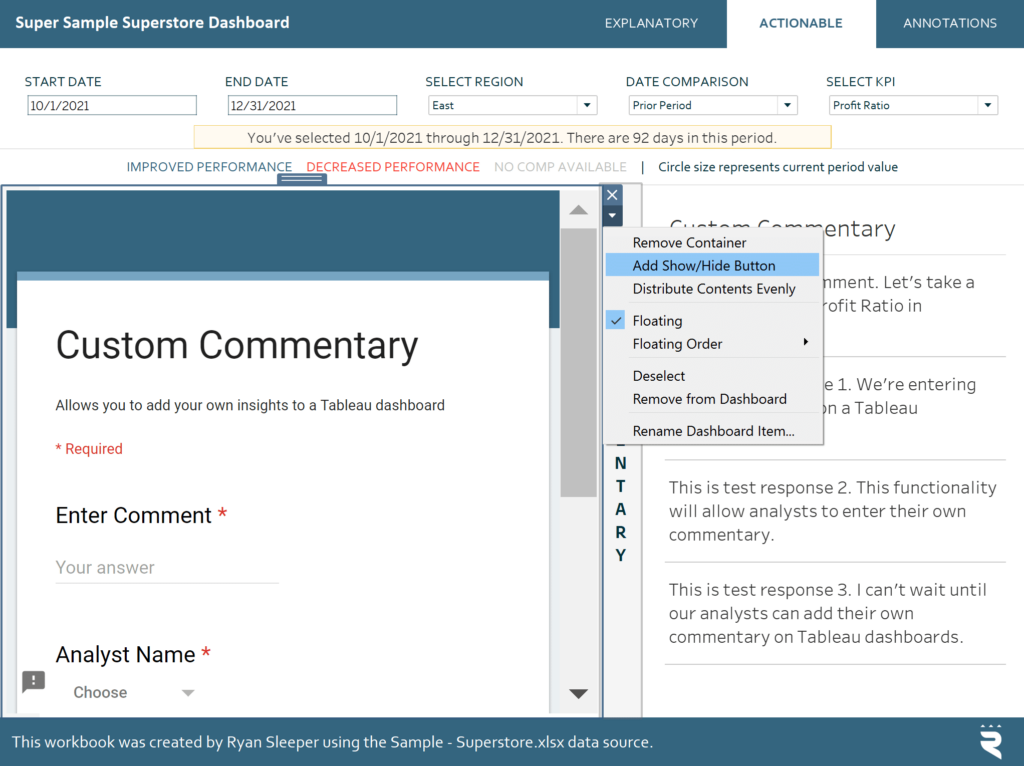
Now that all the pieces are in place and working, I suggest adding a Show / Hide button to the layout container with the Google Form. This will allow you to toggle the custom commentary form on and off so that it does not distract from the view until an analyst is ready to enter a comment.
To add a Show/Hide button to a Tableau layout container, select the layout container, click the down triangle in the top-right corner of the selected container to access its options, and choose “Add Show/Hide Button”.
This button can be mapped to different images depending on whether the container is being shown or hidden and the button can also be moved to wherever you want within a dashboard. Here’s how my view looks after mapping a speech bubble icon to the button and moving it so that it better aligns with the commentary area.
![]()
Note the Show/Hide button is a separate object from the container with the Google Form, so I can keep the form where it was with its larger dimensions but create a better user experience by having the button in line with the Custom Commentary title.
If a user clicks on the speech bubble, the layout container will be shown, and thus, the Google Form where they can add comments will appear. I’ve mapped a red speech bubble for when the layout container is in an open state. The user can close the container and view the underlying visualizations by clicking the Show/Hide button again.
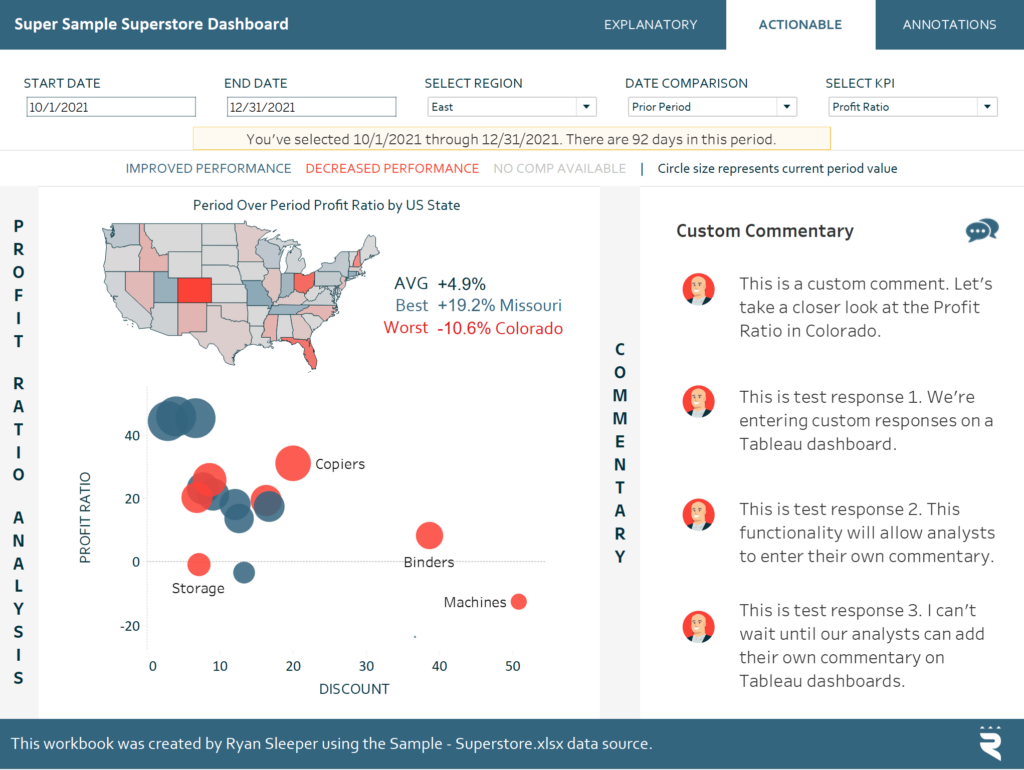
Want to innovate with this even more? Duplicate the sheet containing the comments, change the mark type to Text, remove the Enter Comment dimension from the Text Marks Card, and Add the Analyst Name field to the Shape Marks Card. You can map avatars to different analyst names so they appear alongside their comments.
Here’s how my final view looks after putting my custom avatars in line with their respective comments on the dashboard, formatting, and closing the layout container with the Google Form.
We’ve just created a dynamic commenting system that allows analysts to add their own commentary directly to a Tableau dashboard in real-time! These comments can be filtered by date or analyst to display the most relevant insights and actionable recommendations.
Thanks for reading,
– Ryan

Written By
Ryan Sleeper
Related Content
How to Add Custom Integrated Insights to a Tableau Dashboard
When I discuss data visualization strategy, I often talk in terms of descriptive and prescriptive analytics. Descriptive views are the…
3 Creative Ways to Add Instructions for Your Users in Tableau


When you publish a Tableau dashboard, you want to ensure that every user, regardless of their data literacy, can easily…
How to Make Automatic Insights in Tableau
I’ve illustrated before how to add custom integrated insights to a Tableau dashboard; a feature that does not come out-of-the-box…