3 Ways to Implement Dynamic Pagination in Tableau

Pagination is a great tool you can use to improve user experience and minimize the footprint that tables occupy within Tableau dashboards. By implementing this tactic, it will allow the user to “turn the page” to another set of rows. However, setting it up dynamic pagination can be tricky.
In this post, I will show you how to implement dynamic pagination and three different styles of pagination you can use with this technique. These three different styles will each have their own pros and cons but will give you some great ideas on ways to improve the UX of a dashboard.
Related video: How to Do Pagination in Tableau
How to do dynamic pagination in Tableau
By the end of this tutorial, you will know three different ways to implement dynamic pagination in Tableau. This will allow your users to click between different subsets of your data in a crosstab. We’ve covered how to do this with static pages before, but this technique will also update page numbers as your users filter the data! Meaning that the control sheet used to navigate between “pages” will update with the total number of rows you have in your crosstab.

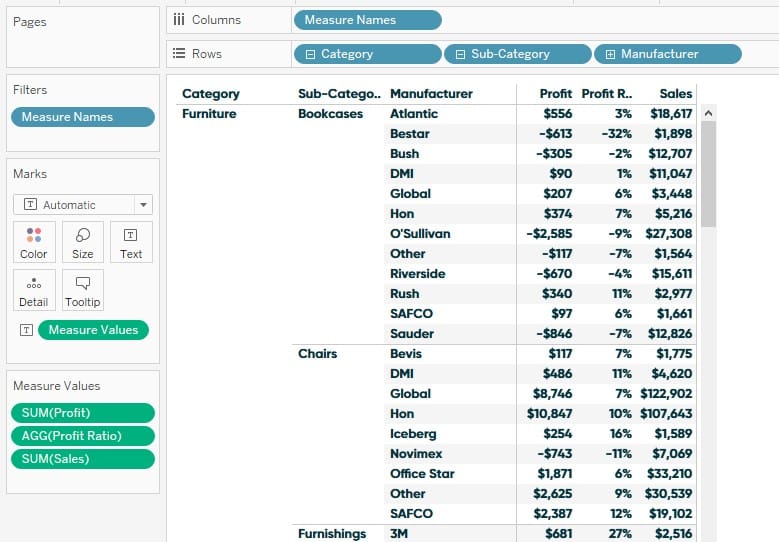
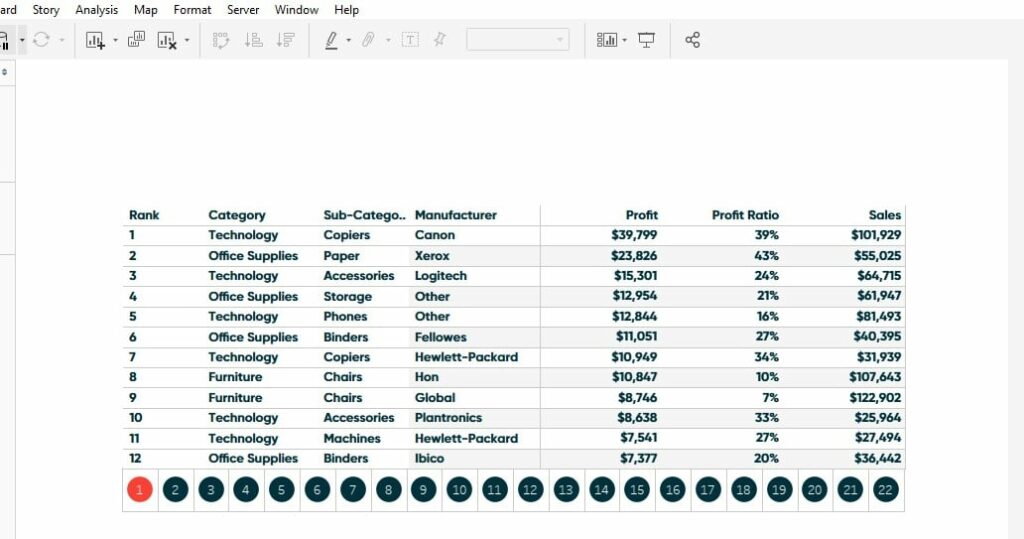
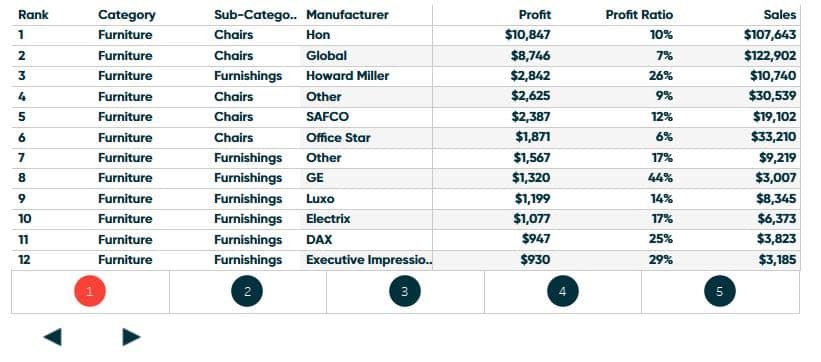
To start, I am going to connect to the Sample – Superstore dataset and make a quick table with Category, Sub-Category, and Manufacturer on the Rows Shelf and the Measure Names of Profit, Profit Ratio, and Sales on the Columns Shelf. If you want to follow along, you should see the following table.
Continue reading with a free account, or login.
Unlock this tutorial and hundreds of other free visual analytics resources from our expert team.
Already have an account? Sign In
By continuing, you agree to our Terms of Use and Privacy Policy.
The next step is to add a RANK function to the view that will sort this table by ranking the dimensions by a specific measure. This can be any measure you choose or multiple measures controlled with a parameter. For this example, I am going to create the ranking using the Profit measure. I will right click in any blank spot in the Data pane, select Create, then Calculated Field, and enter the following:
RANK(SUM([Profit]))
How to Change Sort Order Across Multiple Sheets in Tableau
To add my new calculated field to the view, I will drag it to the Rows Shelf. We will see that because the calculation is a continuous measure, Tableau automatically changed our mark type to Bar.
We want to change it to discrete by right-clicking on the Rank pill and choosing Discrete from the menu. We will see the pill turn blue and Tableau will change our mark type back to Text. Now click and drag the Rank pill to the first position on the Rows Shelf.
![]()
Just to be sure, I typically check to make sure the table calculation is computing correctly by right-clicking on the Rank pill, navigating over Compute Using, and making sure Table (down) is selected.
This should give us the following table.
Now we have to decide how many rows of data we want displayed on each page of our dynamic pagination. This table currently has 265 rows of data. For this example, I am going to show 12 rows at a time which will give us a maximum of 23 pages. It is important to note that you can choose to show any number of rows that you want. You can have 5, 10, 25, and so on; whatever your use case calls for.
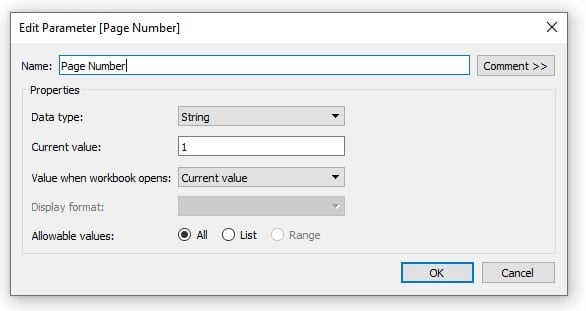
We will need a calculated field to filter the number of rows, but first we need a parameter that will eventually allow the user to choose which page they want to navigate to. To create the parameter, right-click in any blank space in the Data pane, choose Create, then Create Parameter. I will title it Page Number, change the data type to String, then click OK.
To create the filter for this view I am going to create a calculated field by right-clicking any blank space in the Data pane, choosing Create, then Calculated Field, and entering the following formula.
CASE [Page Number]
WHEN ‘1’ THEN [Rank] <= 12
WHEN ‘2’ THEN [Rank] > 12 AND [Rank] <= 24
WHEN ‘3’ THEN [Rank] > 24 AND [Rank] <= 36
WHEN ‘4’ THEN [Rank] > 36 AND [Rank] <= 48
WHEN ‘5’ THEN [Rank] > 48 AND [Rank] <= 60
WHEN ‘6’ THEN [Rank] > 60 AND [Rank] <= 72
WHEN ‘7’ THEN [Rank] > 72 AND [Rank] <= 84
WHEN ‘8’ THEN [Rank] > 84 AND [Rank] <= 96
WHEN ‘9’ THEN [Rank] > 96 AND [Rank] <= 108
WHEN ’10’ THEN [Rank] > 108 AND [Rank] <= 120
WHEN ’11’ THEN [Rank] > 120 AND [Rank] <= 132
WHEN ’12’ THEN [Rank] > 132 AND [Rank] <= 144
WHEN ’13’ THEN [Rank] > 144 AND [Rank] <= 156
WHEN ’14’ THEN [Rank] > 156 AND [Rank] <= 168
WHEN ’15’ THEN [Rank] > 168 AND [Rank] <= 180
WHEN ’16’ THEN [Rank] > 180 AND [Rank] <= 192
WHEN ’17’ THEN [Rank] > 192 AND [Rank] <= 204
WHEN ’18’ THEN [Rank] > 204 AND [Rank] <= 216
WHEN ’19’ THEN [Rank] > 216 AND [Rank] <= 228
WHEN ’20’ THEN [Rank] > 228 AND [Rank] <= 240
WHEN ’21’ THEN [Rank] > 240 AND [Rank] <= 252
WHEN ’22’ THEN [Rank] > 252 AND [Rank] <= 264
WHEN ’23’ THEN [Rank] > 264
END
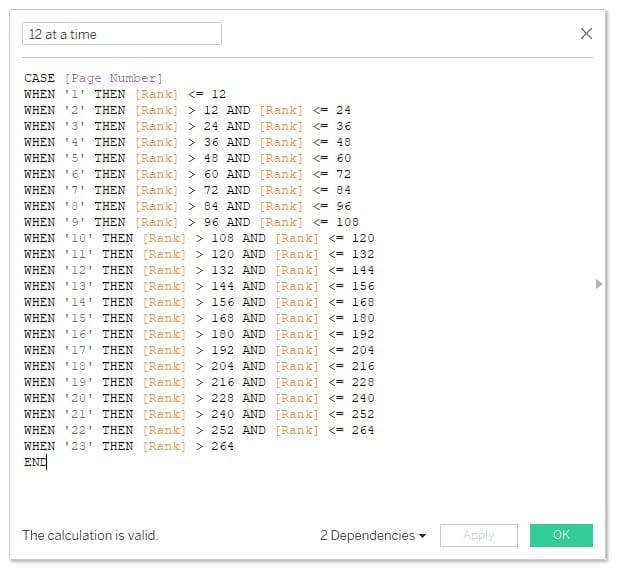
This calculated field is actually displaying specific rows based on our Rank function and will show them when we have a certain page number selected from our Page Number parameter.
This may seem like overkill, but I chose 12 rows per page so you can clearly see the dynamic pagination piece of this technique in play later on. Again, feel free to use the structure of this calculation to meet your own needs.
Okay, I will now take our new filter and drag it to the Filters Shelf, select True, then OK.
Now that we have set up our data table, we are ready to begin setting up the three different dynamic control sheets for pagination!
Creating buttons for dynamic pagination in Tableau
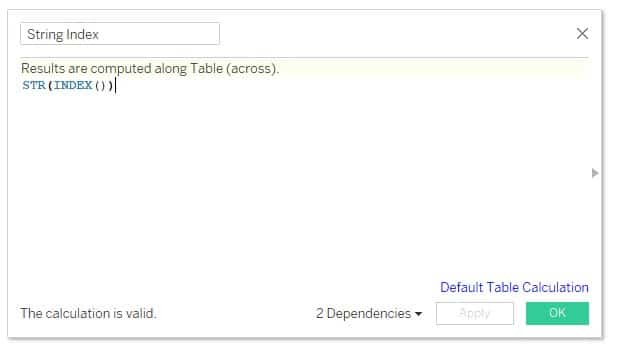
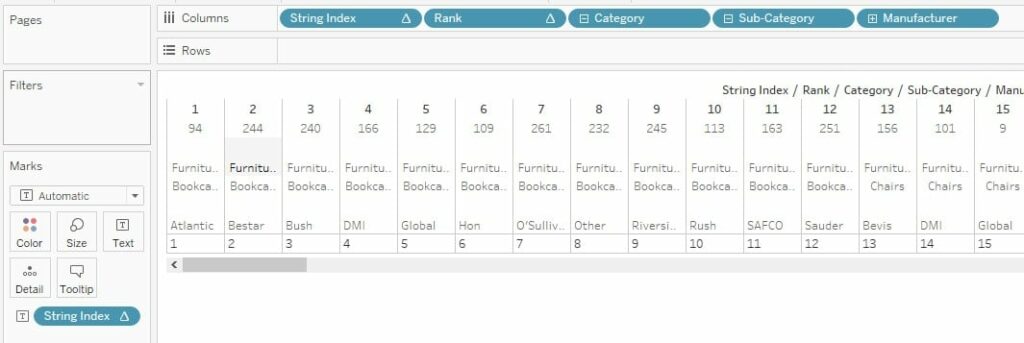
The first technique is to set up a control sheet that displays a button for each page. To begin I will start a new sheet and add Rank, Category, Sub-Category, and Manufacturer to the Columns Shelf. Then I will create a new calculated field by right-clicking any blank space in the Data pane, choosing Create, then Calculated Field, and entering the following.
STR(INDEX())
Now I will drag the newly-created String Index calculated field to the Text Marks Card and to the first position on the Columns Shelf. That should leave us with the following table.
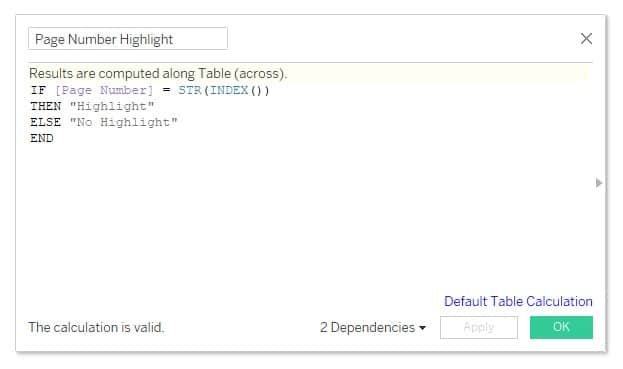
Next, I will Create another calculated field, title it Page Number Highlight and enter the following calculation.
IF [Page Number] = STR(INDEX())
THEN “Highlight”
ELSE “No Highlight”
END
I am going to change the Mark Type to Circle and add Page Number Highlight to the Color Marks Card. This will ultimately highlight the selected page the user is on.
Then, I will create the last calculated field needed for this which I will title Dynamic Pagination and add the following calculation.
INDEX() <= IF ROUND(WINDOW_MAX([Rank])/12,0) = 0 THEN 1
ELSE ROUND(WINDOW_MAX([Rank])/12,0)
END
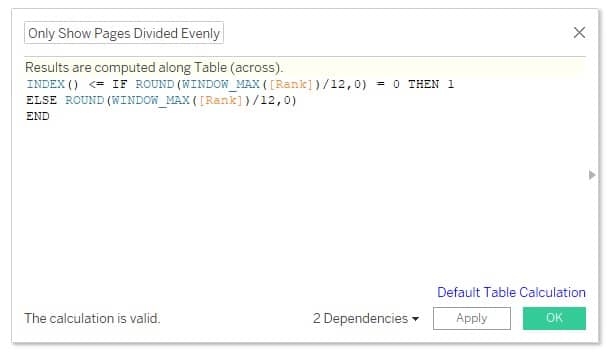
This is the key calculation that makes dynamic pagination possible. You will see later once we start filtering our data table that this calculation will update the number of pages displayed based on the selection.
It is important to note again that I used 12 rows per page, but you can use a different number as well. If you choose to use more or fewer than 12 rows then you will need to update this calculation by changing the number 12 to whatever number you are using.
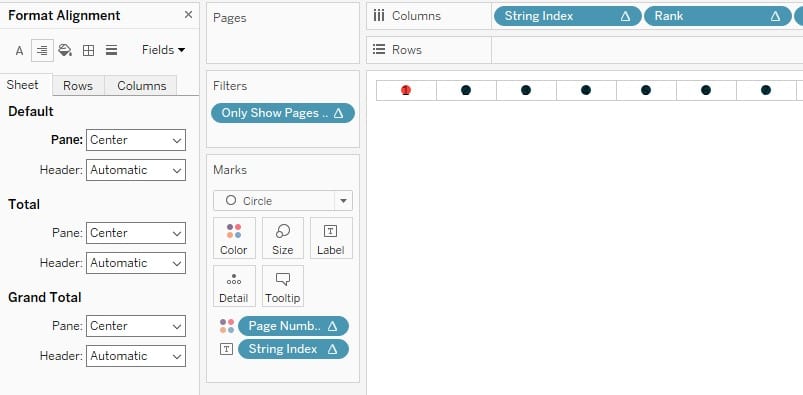
Now I will add this to the Filters Shelf, select True, then OK. To clean up the view, I am going to right-click on all the headers and deselect Show Header. I will also format the pane alignment to Center by right-clicking on the String Index pill on the Marks Shelf, clicking the Format Alignment tab, then selecting Center for Pane in the Default section.
That should leave us with the following view.
To set up the dynamic pagination as a dashboard action, I will create a new dashboard and add my data table and this newly-created control sheet to it.
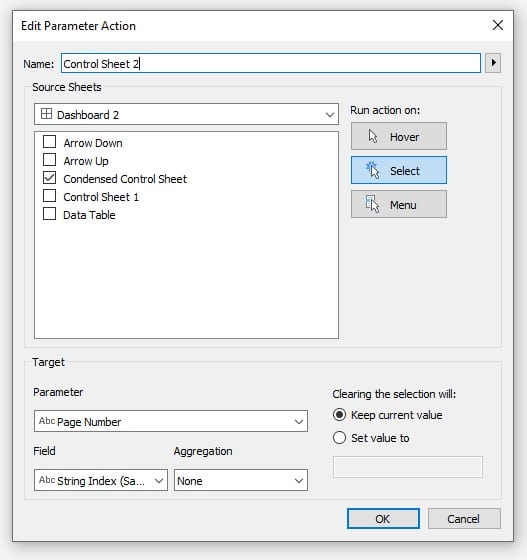
Then I will click Dashboard in the top menu, select Actions, Add Action, and Change Parameter. This will open the Add Parameter Action dialog. Here I will deselect the Data Table sheet in the Source Sheets section, change the target parameter to Page Number, and change the Field to String Index. This will leave me with the following selections.
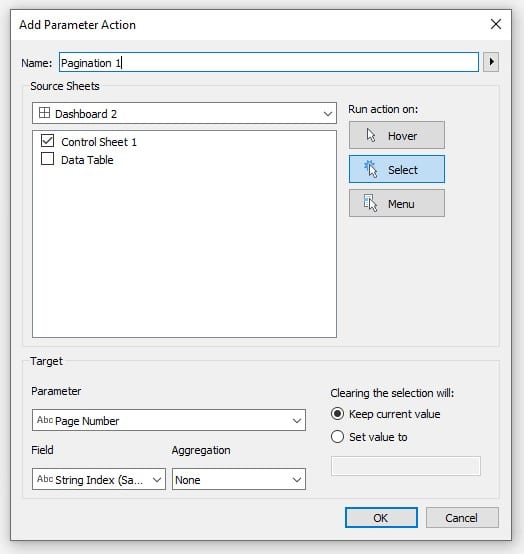
I’ll click OK on that and then OK again to close the dashboard action menu. With that setup, we can use the pagination control sheet to navigate to different pages of data by clicking on the circle buttons.
Creating arrow-shaped toggles for dynamic pagination
The next style I am going to show you how to set up is using a shape and parameter action to go forward a page or back a page. First, I will need to create two calculated fields, which I will title Page Down and Page Up.
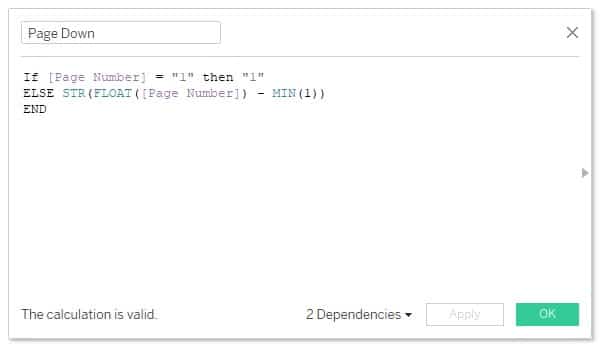
Page Down
If [Page Number] = “1” then “1”
ELSE STR(FLOAT([Page Number]) – MIN(1))
END
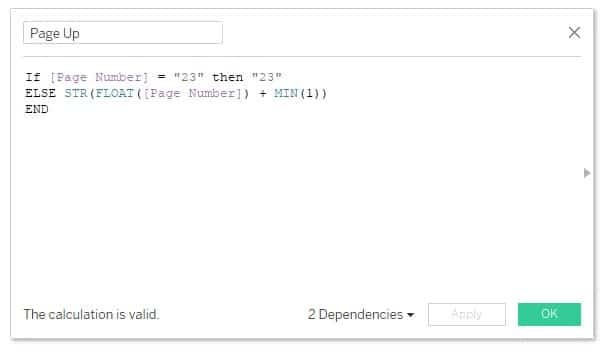
Page Up
If [Page Number] = “23” then “23”
ELSE STR(FLOAT([Page Number]) + MIN(1))
END
Now I will create a new sheet, add Page Down to the Details Marks card, and change the mark type to Shape. To edit the shape used for the dynamic pagination selector, I will click on the Shape Marks card and choose the default arrow pointing to the left.
To create the page up sheet, I will right-click on the sheet I just created and select duplicate. Then, I will drag Page Up to the Detail Marks card and remove Page Down. I will also edit the shape to the default arrow pointing to the right.
I will add both of these new sheets to the dashboard. Each of these sheets will require their own parameter action to make them work. I will start with the Page Down action by left-clicking Dashboard in the top menu, choosing Actions, Add Action, then Change Parameter.
In the dialog that appears, I will select my Arrow Down sheet as the source sheet, change the target parameter to Page Number, and change the target field to Page Down.
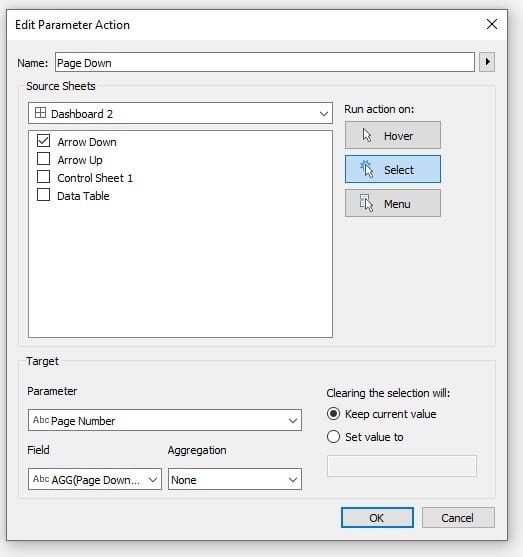
I will then repeat this step for the Page Up action.
Once the parameter actions are set up you will be able to click on the arrows, and it will navigate to the next 12 rows of data in your data table.
The cool thing about using shapes is you can use any shape you want by saving images to your Tableau Repository.
How to Make a Tableau Toggle With More Than Two Choices
Creating a condensed menu of page numbers for pagination
The final way I will show you how to implement dynamic pagination is using a condensed page number menu. This will allow your user to click a menu and select a page number they would like to navigate to. To accomplish this I am going to duplicate the first control sheet we setup. Now I will swap the fields that are on the Rows Shelf with the fields that are on the Columns Shelf by clicking the Swap option in the top tool ribbon that looks like this.
Now I will create a new calculated field by duplicating the Dynamic Pagination measure we created. I will delete the first part of this calculation and retitle it Dynamic Pagination Max Page; the formula is:
IF ROUND(WINDOW_MAX([Rank])/12,0) = 0
THEN 1
ELSE ROUND(WINDOW_MAX([Rank])/12,0)
END
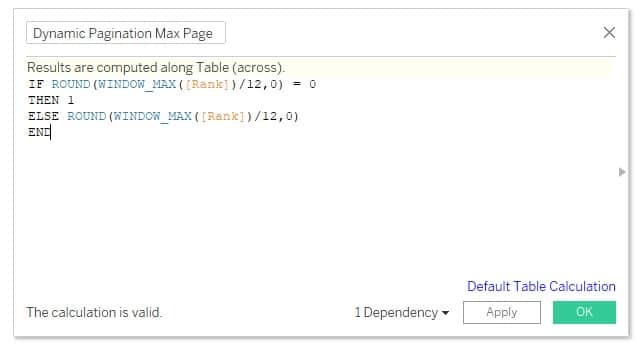
Notice the only change I made was to remove “INDEX() <=” from the calculation. This will change it from a Boolean result to a Number (Decimal) data type.
After that, I am going to drag that new field to the Text Marks Card. From here I will click on the Label Marks Card and then click the ellipsis next to “Text:”. This will open the Label Editor, where I will move the Dynamic Pagination Max Page to the right of the String Index and add the word “Of” in between the two fields. You will be left with the following.
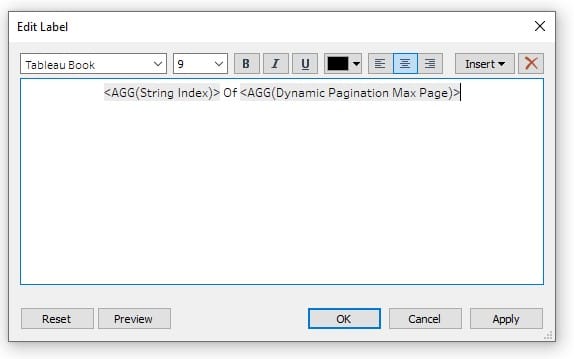
I will click OK on the editor then change the Mark Type to Text.
To make this a condensed version of the page numbers I am going first add a Horizontal Container object to my dashboard. Then I will put the condensed control sheet inside that container. If you double-click the bar at the top of the sheet you will see the container turn blue. Once you have the container selected, click the arrow to the right and select Add Show/Hide Button from the menu. I am going to take that button and put it in-between my arrows.
![]()
Once you have it laid out appropriately, click Dashboard in the top navigation, then actions, Add Action, and Change Parameter. I will title this Control Sheet 2, change the target parameter to Page Number, and the target field to String Index.
I will click OK then OK again.
Now I have a menu that shows a list of the page numbers that the user can open or close and thumb through pages.
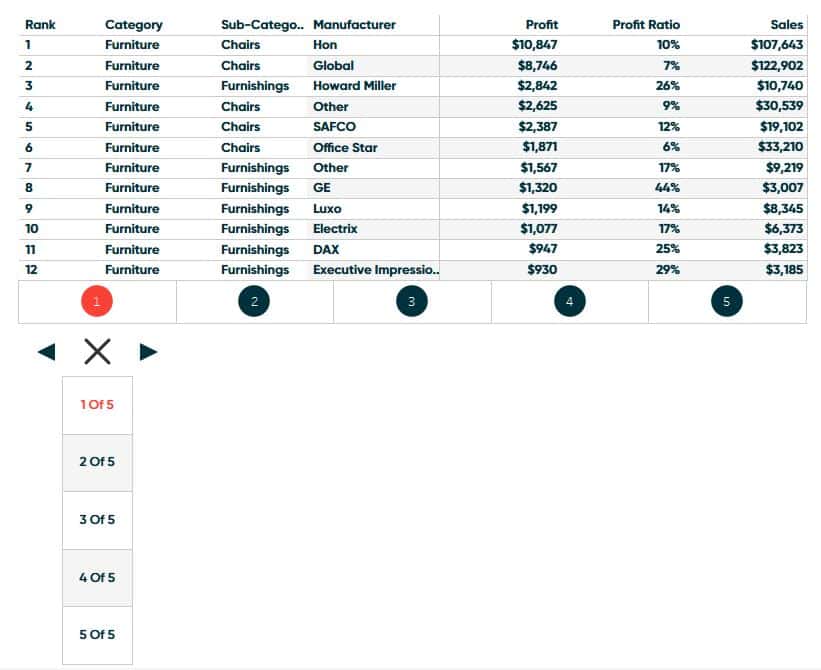
The last thing I want to showcase is the dynamic aspect of this tactic. To do so, I am going to go back to my data table, add Category to the Filters Shelf, then select Furniture from the list. Now I will click OK, right-click on the Category pill in the menu, select Apply to Worksheets, then choose All Using This Data Source. If we navigate back to the dashboard, we will see that all of our control sheets have updated to only having 5 pages of data rather than 22. The page numbers will continue to update as the user continues to filter the data!
As you know there are almost infinite ways to format these techniques. You can use shapes, colors, size or any number of pre-attentive attributes to make this tactic have a better user experience. I am going to clean up my dashboard and call this good.
Until Next Time,
Ethan Lang
Director, Analytics Engineering
[email protected]


Written By
Ethan Lang

Graphic Design
Jason Penrod
Director, Information Design
Related Content
How to Automatically Create Pages in Tableau Visualizations

Pagination is a useful tactic to add additional user experience to a dashboard while keeping them clean and orderly. Sometimes…
How to Completely Customize Multi-Select Filters in Tableau

Filters play a crucial role in allowing users the flexibility to manipulate dashboards to their liking. Multi-select filters can be…

Ryan Sleeper
Multiple Options for Navigating Users Between Dashboards and Webpages How to (1) use the Button or Navigation dashboard object introduced…