How to Compare the Last Two Partial Weeks, Months, Quarters, or Years in Tableau
This post shows you how to automatically isolate the last two partial date ranges so you can compare an equal number of days period over period. Last week I showed you how to compare the last two complete date periods in Tableau, but sometimes you want the comparison to be even more current. For example, you may want to compare this partial month to last month even if the month is not yet complete instead of comparing the last full month to the full month from two months ago in Tableau.
The benefit to this is timelier analysis, but you can often end up with an ‘apples to oranges’ comparison. For example, if it’s Wednesday this week and you try to create a week over week analysis, you can end up comparing the 3 days from this week to all 7 days from last week. The tricky part to creating a true partial period over period analysis is you need to calculate the number of days in the current range and then cap the last full date range at that same number.
This post shares the formulas needed to automatically create a partial period over period analysis so that both periods – whether you’re using weeks, months, quarters, or years – contain an equal number of days.
How to Compare the Last Two Partial Date Parts in Tableau
Introduction + notes
The core of this technique is the same as when comparing the last two complete date parts in that we need to create a calculated field that classifies dates as “current” or “prior”. Partial periods are more nuanced, however, because they can contain any number of days from 1 to 364. You could be comparing anything from Monday this week to Monday last week or January 1st through December 30th this year to January 1st through December 30th last year.
![]()
Continue reading with a free account, or login.
Unlock this tutorial and hundreds of other free visual analytics resources from our expert team.
Already have an account? Sign In
By continuing, you agree to our Terms of Use and Privacy Policy.
To account for these differences, we must compute the number of days in the current partial date range so we can ensure the current and comparison ranges contain the same number of days. So, in addition to our Partial Current / Partial Prior field, we need two additional calculated fields: a level of detail calculation to automatically compute the latest date in the dataset and a DATEDIFF calculation to determine the number of days in the current partial range.
A few notes that will be helpful in case you want to follow along with the Sample – Superstore dataset:
- As of this writing, the Order Date field in the Sample – Superstore dataset only goes through 12/30/2018. I added 365 days to this field so the dates were moved up to 2019; the field Order Date is actually the calculated field [Order Date] + 365.
- To create the illustration that we’re working with current and to exclude sample dates that go into the future, I added a data source filter to only bring in dates through Wednesday, March 13th, 2019.
- By default, weeks start on Sunday in Tableau, but I usually think of weeks as starting on Monday. I have adjusted my weeks to start on Monday by clicking Data in the top navigation, hovering over the name of the data source, and changing the “Date Properties…”.
For this example, let’s say it’s Thursday, March 14th, and our company updates our data once per day overnight, meaning that our dataset is current through Wednesday, March 13th. We would like to create a report that automatically compares the number of days that have passed in the current week (Monday, Tuesday, and Wednesday) to the same three days last week.
The date calculations
The first calculated field needed is a simple level of detail calculation to automatically isolate the highest date in the data. The formula is:
{MAX([Order Date])}
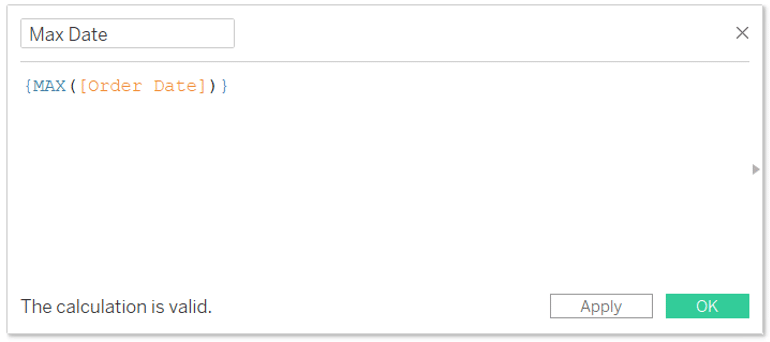
Note this calculation includes a FIXED level of detail expression, but because FIXED is the default expression and we are not specifying a dimension to change the level of detail, we do not need to type “FIXED:” at the beginning of the syntax.
The next calculation computes the difference between this calculated field, or the latest date in the dataset, and the beginning of the current partial date range.
DATEDIFF(‘day’,DATETRUNC(‘week’,[Max Date]),[Max Date])
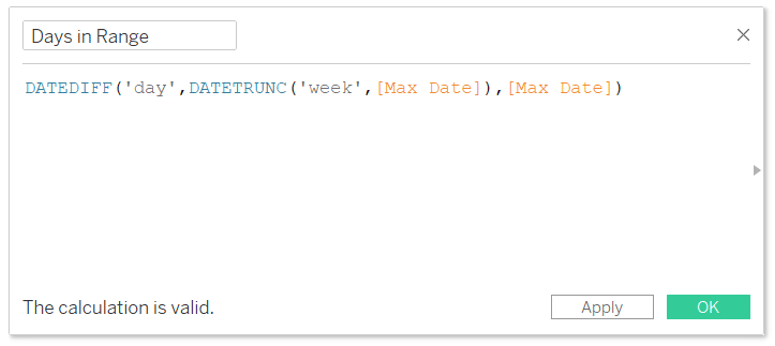
The first date part of ‘day’ ensures the difference between the max date and the start of the range is always computed in days, and should not be changed. The second date part – ‘week’ in this case – can be changed to month, quarter, or year depending on what partial ranges you’re hoping to compare (i.e. partial week over partial week, partial month over partial month, etc.).
Computing the date segmentation
Now we are ready to create the foundational Partial Current / Partial Prior calculated field that drives all the date range classifications. As with the Full Current / Full Prior calculation shared in the last post, this calculation can be written with CASE / WHEN or IF / THEN logic. While last week I primarily used CASE / WHEN logic because it was more concise in that scenario, this time IF / THEN contains the exact same number of characters. I also think it’s easier to understand what’s happening with IF / THEN logic, so let’s use that; the formula is:
IF [Order Date] <= [Max Date]
AND [Order Date] >= DATETRUNC(‘week’, [Max Date]) THEN “Partial Current”
ELSEIF [Order Date] >= DATEADD(‘week’, -1, DATETRUNC(‘week’, [Max Date]))
AND [Order Date] <= DATEADD(‘week’, -1, DATETRUNC(‘week’, [Max Date])) + [Days in Range] THEN “Partial Prior”
END
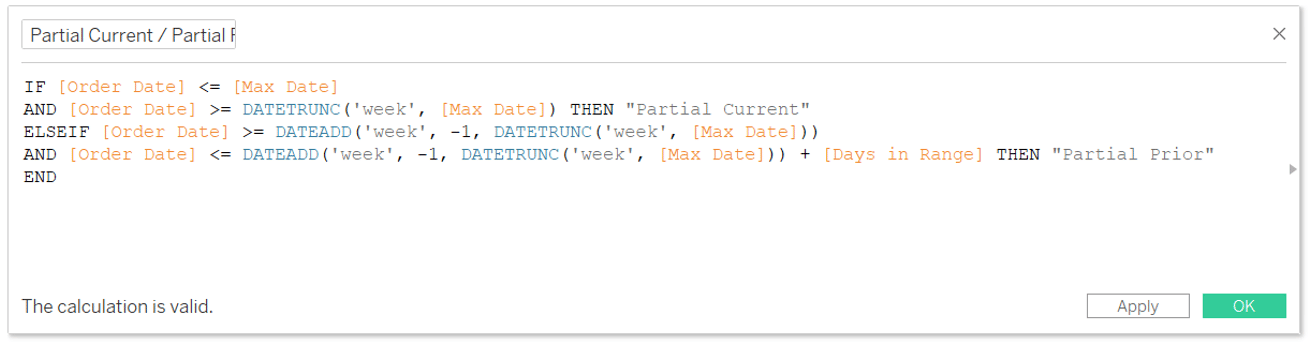
This one might look a little bit intimidating, but there are still just two outcomes:
- If the date is less than or equals the latest date in the dataset and the date is greater than or equal to the start of the current partial period, it’s classified as “Partial Current”.
- If the date is greater than or equal to the start of current partial period minus one date part (so the start of the last partial period) and less than or equal to the start of the last partial period plus the number of days in the current partial period, it’s classified as “Partial Prior”. It’s the last part of this calculation, “+ [Days in Range]” that caps the prior comparison at the same number of days as the current comparison. Even though there were seven full days last week, we only want to compare the first three in this case.
![]()
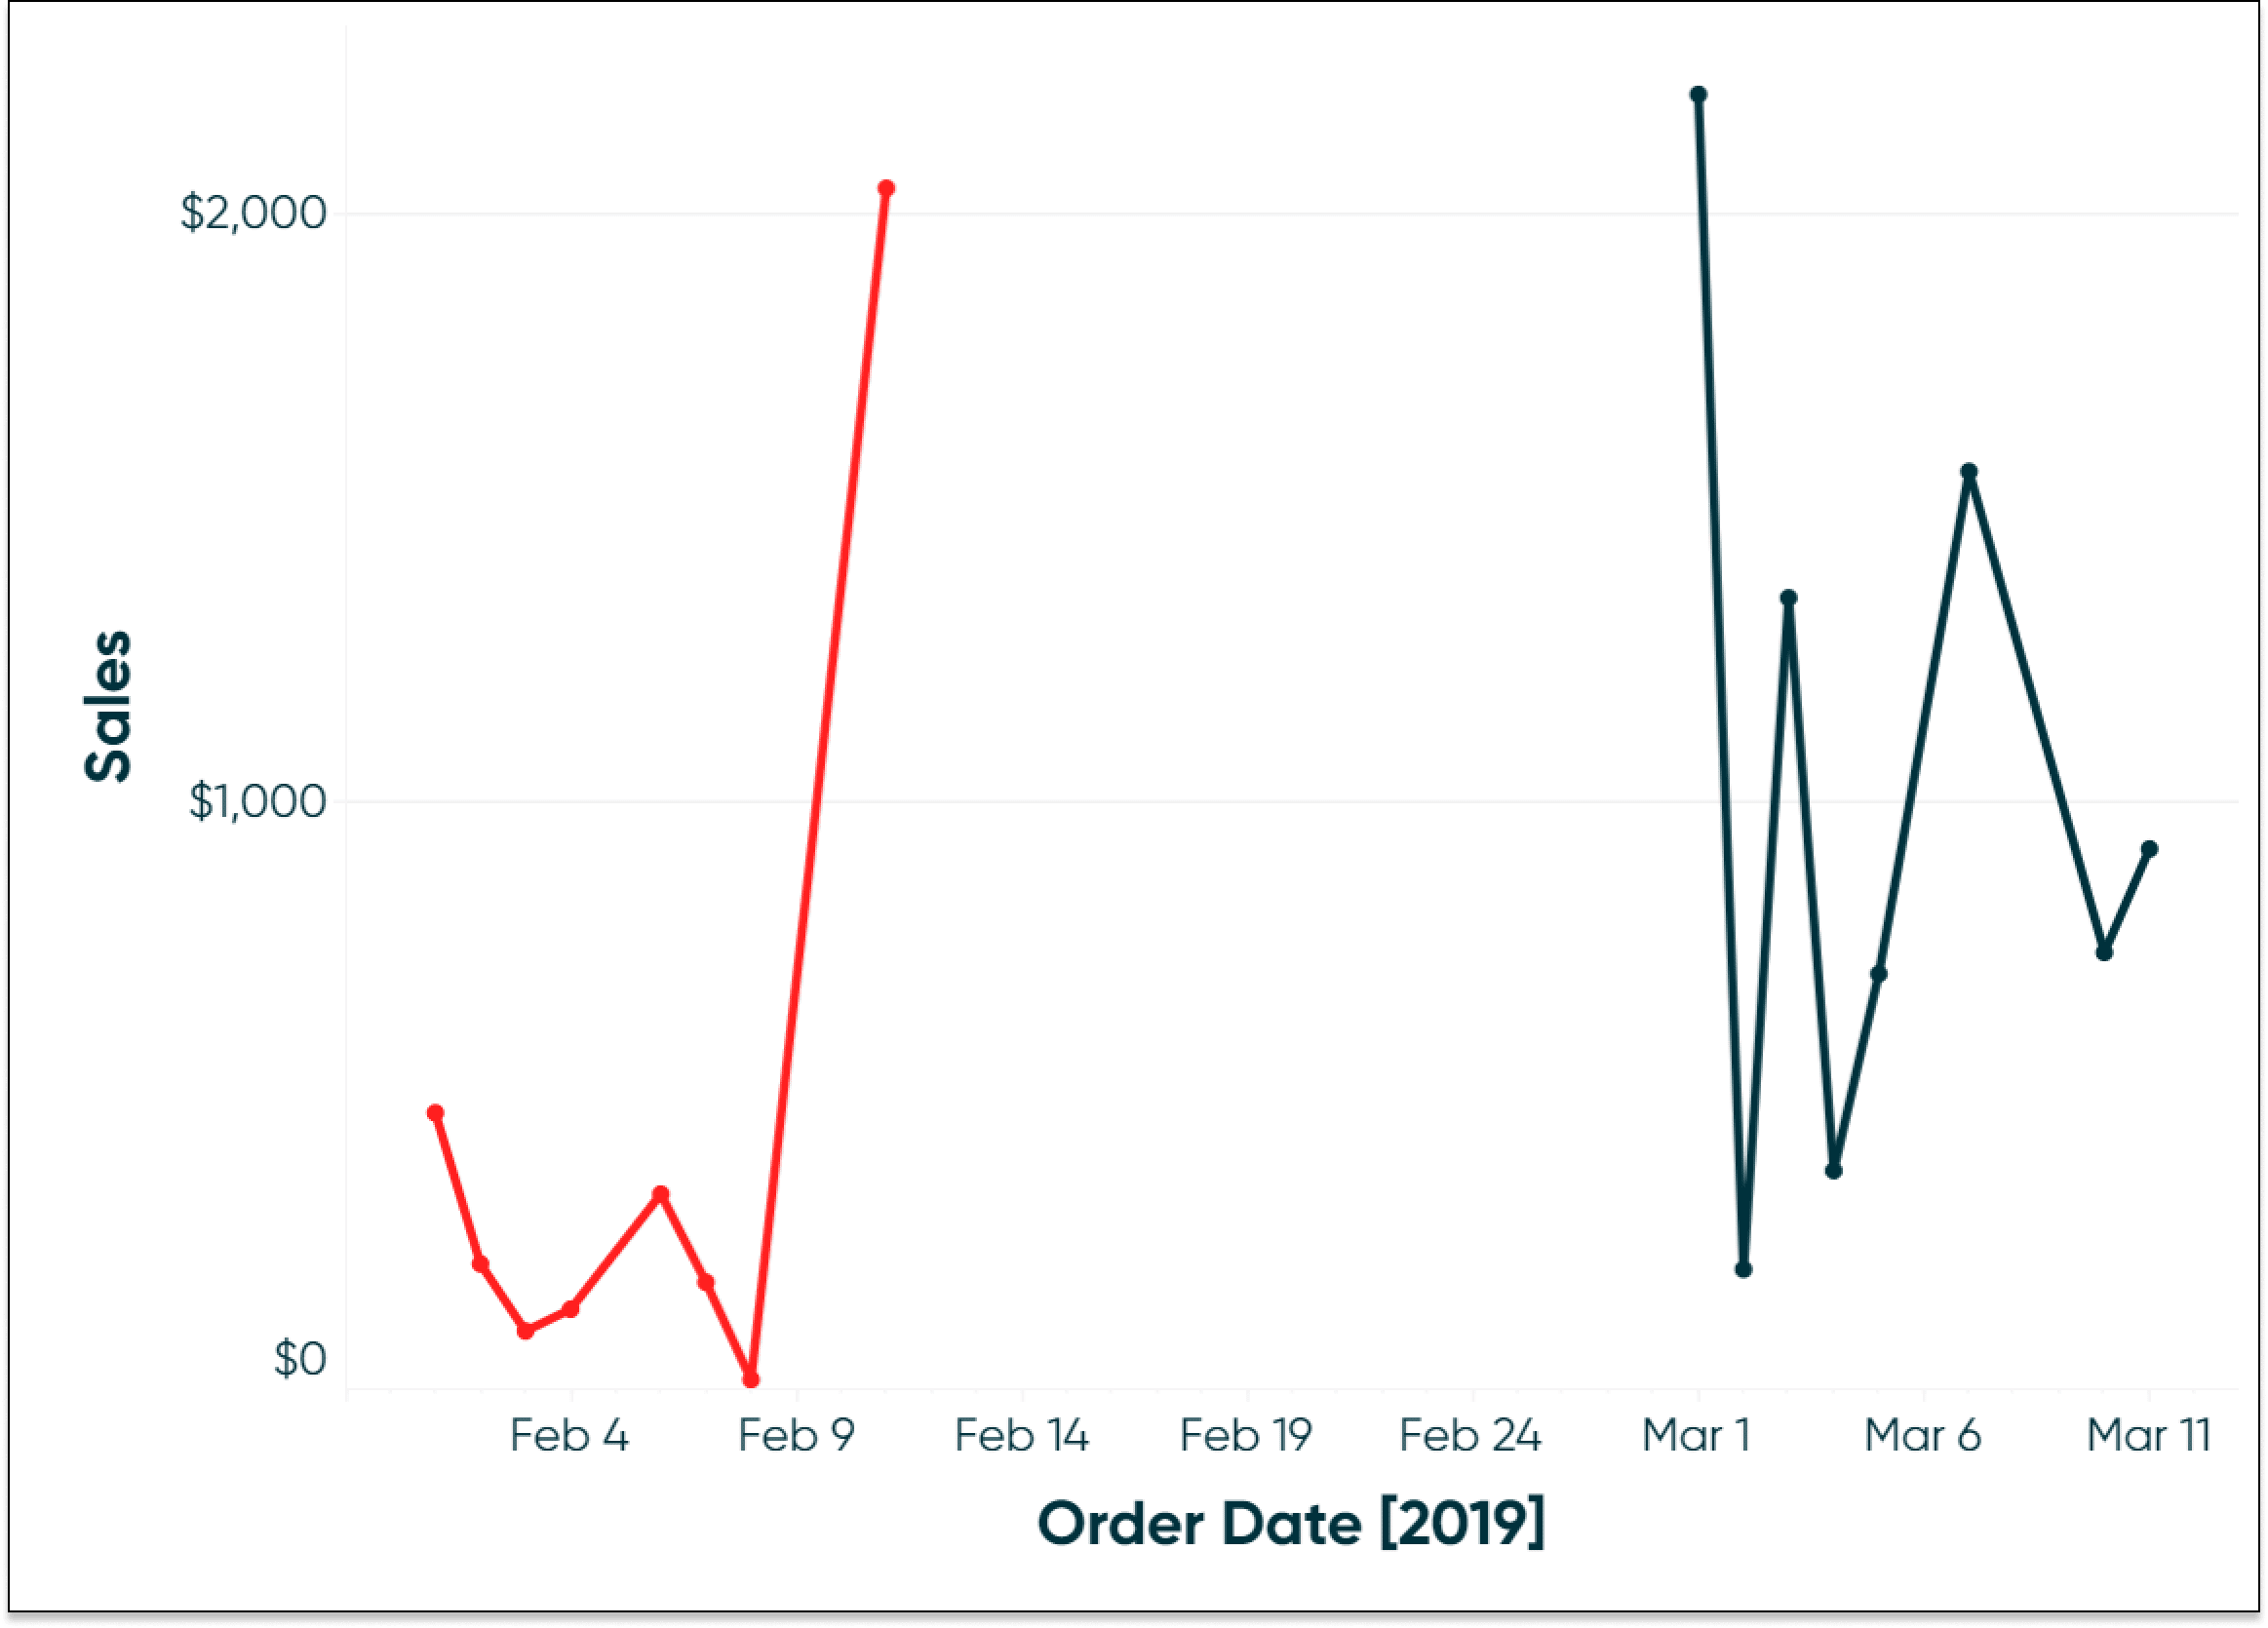
To illustrate comparing a partial current week to a partial period with the same number of days from the previous week, here’s a line graph showing Sales by Order Date in the Sample – Superstore dataset. I’ve also filtered the view to only include dates that have been classified as either “Partial Current” or “Partial Prior” and placed the Partial Current / Partial Prior calculated dimension on the Color Marks Card.
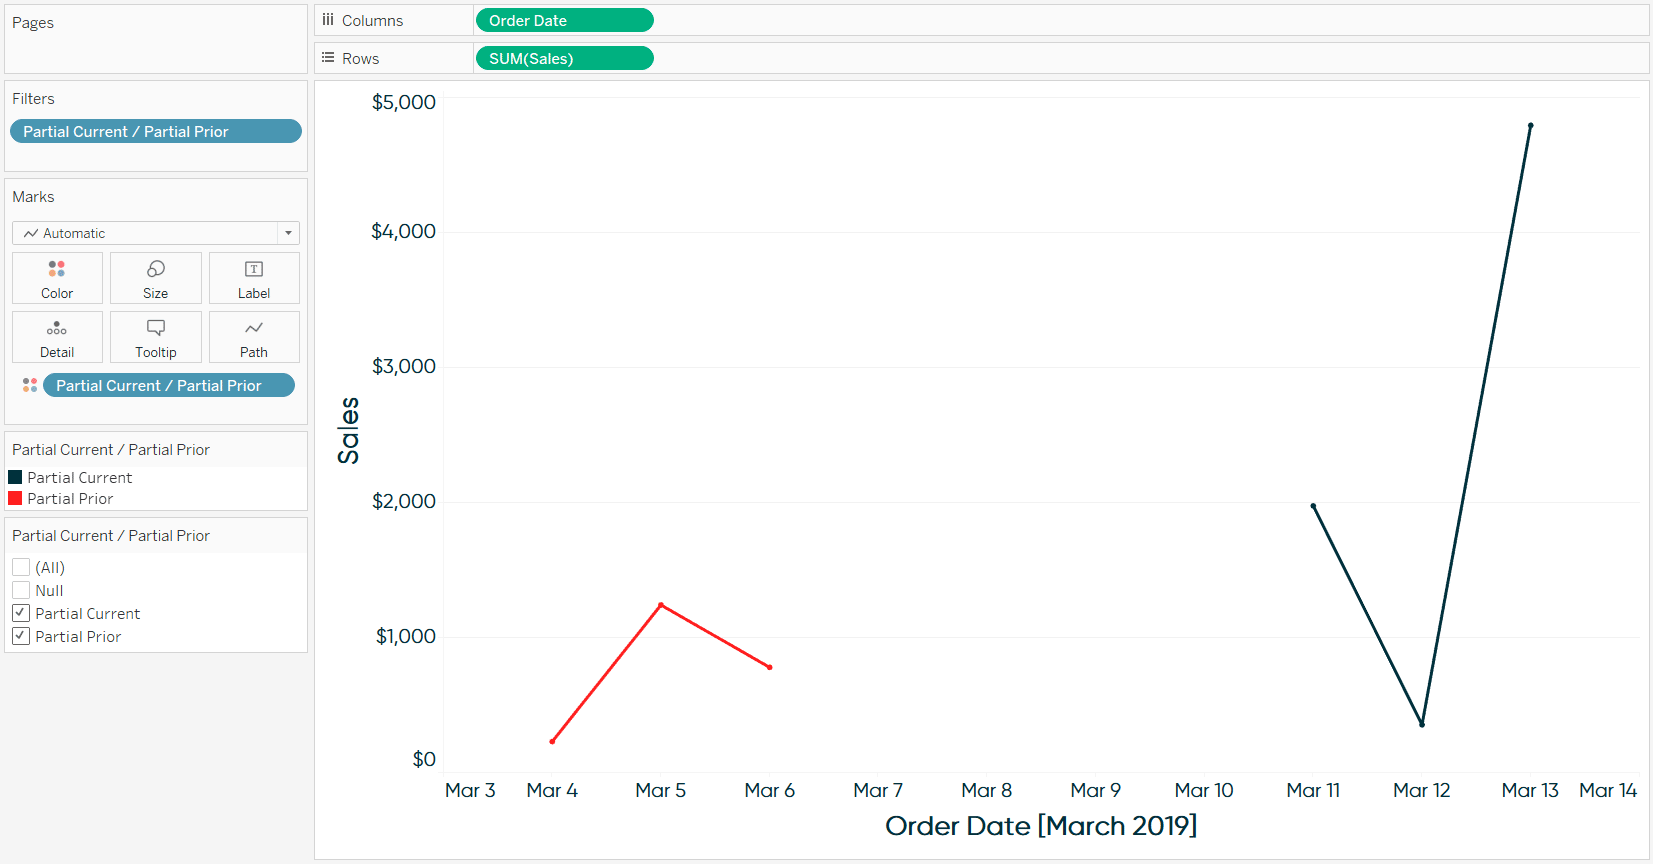
We are left with Monday, 3/11, through Wednesday, 3/13 (the latest date in the data), as our current partial range and Monday, 3/4, through Wednesday, 3/6 as our prior partial range. We just created a partial date range comparison containing an equal number of days that will automatically update as our data refreshes!
Using various partial date parts
To update these formulas to work with months, quarters, or years, simply update (or parameterize) all of the date parts in the Partial Current / Partial Prior calculated field and the second date part in the Days in Range calculated field (but leave ‘days’ as is). Here’s another example after updating the calculations to compare partial month over partial month.
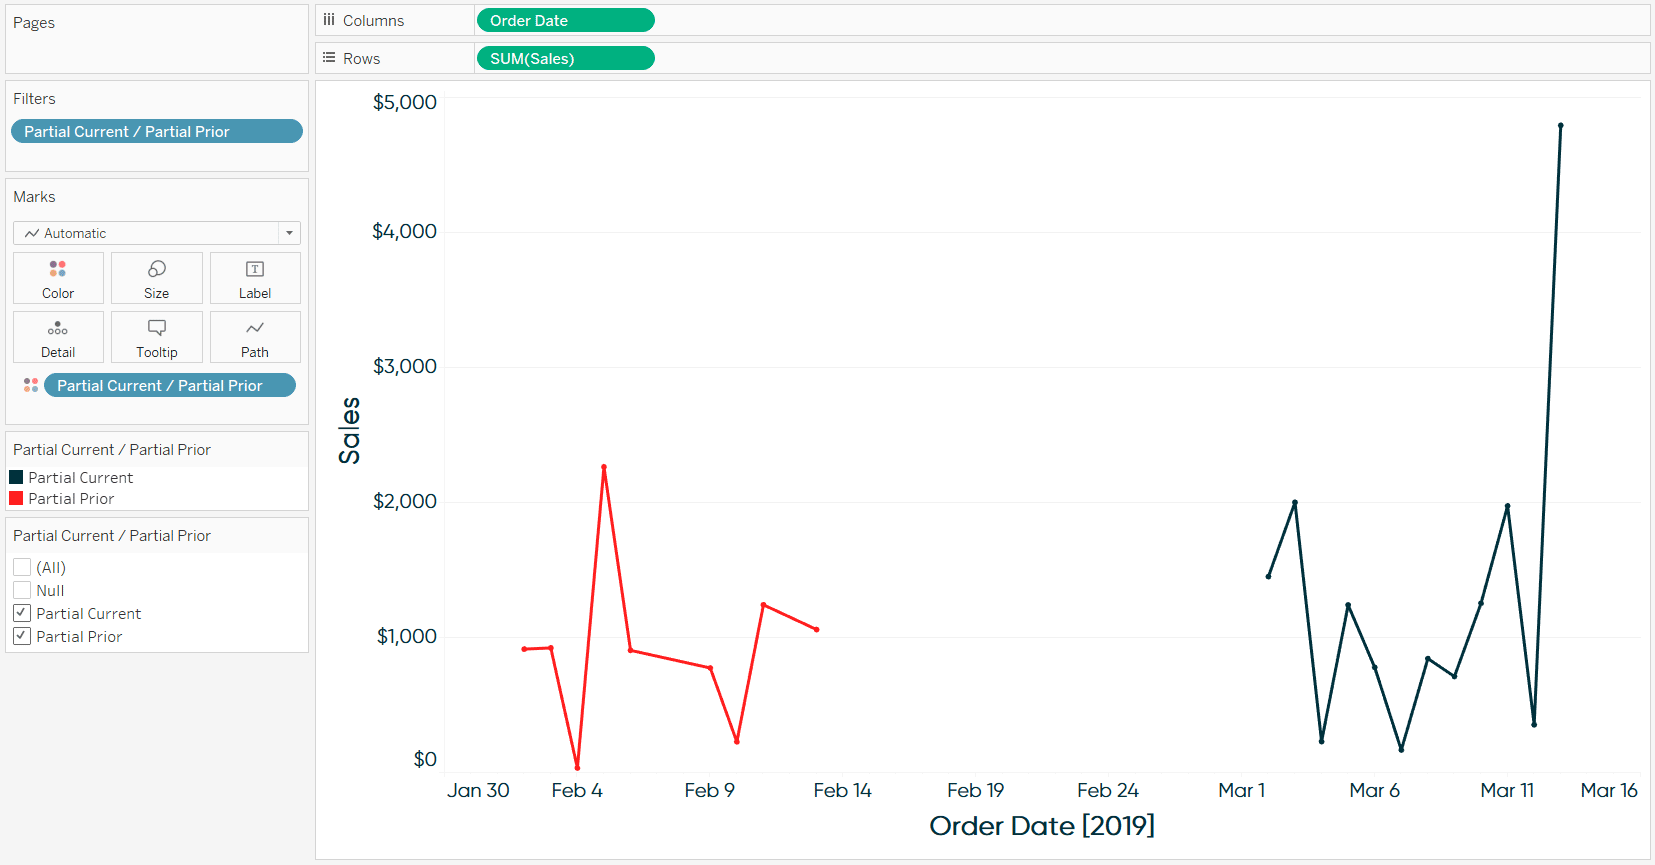
After changing the date part to ‘month’, the March range spans from March 1st through March 13th, and even though the entire month of February has passed in this example, the comparison month is capped 13 days into the month to create an equal number of days. There are some missing dates in the Sample – Superstore dataset, but both ranges span from the beginning of their respective month to the 13th of the month.
From here you can: (1) isolate partial current and partial prior measures to create percent change comparisons, (2) normalize the partial prior dates so they line up with the partial current dates on a line graph, and/or (3) parameterize the date part selection to quickly pivot through different date comparisons. These tactics work the same way as when you’re comparing complete date ranges, so I encourage you to learn how to do to do these at the bottom of my last post, How to Compare the Last Two Full Days, Weeks, or Months in Tableau.
Thanks for reading,
– Ryan


Written By
Ryan Sleeper
Related Content
How to Automatically Compare Date Periods in Tableau

In this post you will learn how to parameterize the ‘date part’ in calculated fields and dynamically compare date periods…

Ryan Sleeper
Comparing Dates with Tableau’s DATETRUNC, DATEADD, and LOD Functions Get more from dates in Tableau by learning how to: (1)…
How to do Dynamic Date Selections in Tableau

In a lot of business cases, you are doing analysis based on common units of time such as: weeks, months,…