How to Create a Dynamic Spider Web Background for Radar Charts

Radar charts can be a good option to make comparisons with your data, but one of the problems with this chart type is that it can be difficult to read. One solution to improving the readability of this chart is to add a simple ‘spider web’ background to give the radar chart context through direct labeling and scale from the lines in the Tableau spider web. But a still background image has limitations because what if you don’t have the same number of comparisons and you want your view to be dynamic?
I recently had this exact use case where I needed to create a radar chart with a background that would change in tandem with the radar based on the selected dimension. I eventually found Ken Flerlage’s blog, Creating Radar/Spider Charts in Tableau, where he invents exactly what I needed, a dynamic spider web background! As the number of radar chart points change based on the selected dimension, the points on your spider web background also changes. I appreciate this method so much that I wanted to bring more visibility to this chart type by sharing a step-by-step tutorial of how to build a dynamic background for any radar chart.
Setting up the joined data source
To create the dynamic background, we will need to join our data with an additional data source which will define the lines and quadrants of the dynamic background. The ‘Line’ field specifies how many lines the web will have. For this use case I only used 5, but you can change that to how ever many lines you want in the web. The second field, ‘Quadrants’, specifies where Tableau should plot the polygon points. To follow along, download the radar / spider web template data source.
![]()
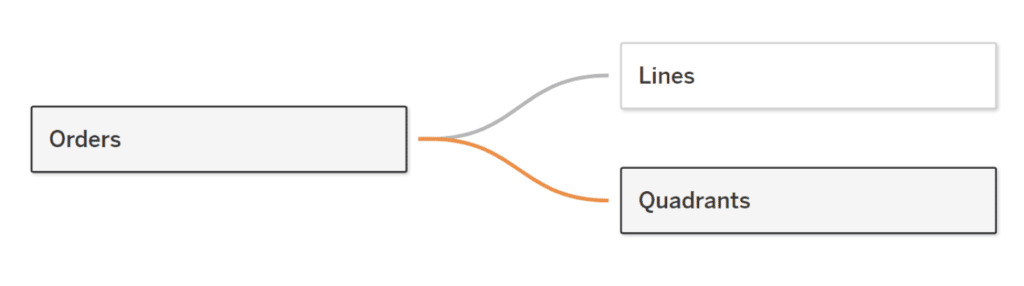
For this tutorial, let’s pretend we want to look at Sub-Category sales by City, but some cities only have sales in certain Sub-Categories, thus the need for the dynamic radar chart and background. The first step to creating the dynamic background will be to create a relationship between the Sample Superstore data set and the Radar Template data set. First open the Sample Superstore data set and drag the Orders table to the Canvas (the area that says “Drag Tables Here”). Then open the ‘Radar Template’ data set as a new data source and drag the ‘Line’ table and ‘Quadrants’ table into the Canvas to create relationships with the Orders field of the Sample Superstore data set.
Continue reading with a free account, or login.
Unlock this tutorial and hundreds of other free visual analytics resources from our expert team.
Already have an account? Sign In
By continuing, you agree to our Terms of Use and Privacy Policy.
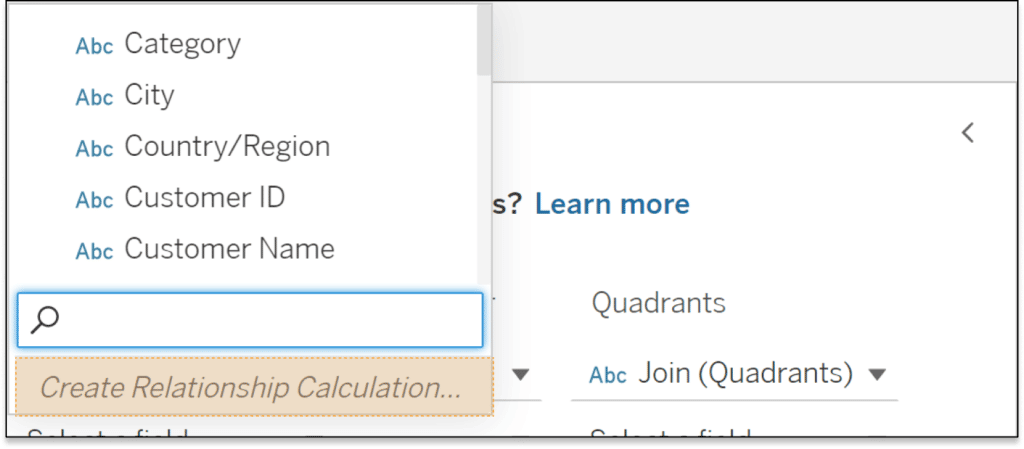
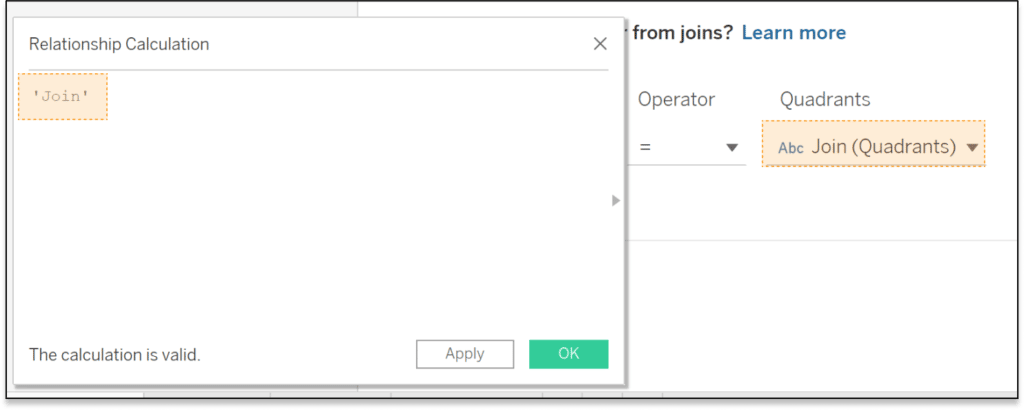
Create the relationship on ‘Join’ by selecting ‘Create Relationship Calculation’ under Orders and typing ‘Join’ in the calculated field. Then under Quadrants, select Join.
Repeat the process for the ‘Lines’ table.
Create the spider web background calculations
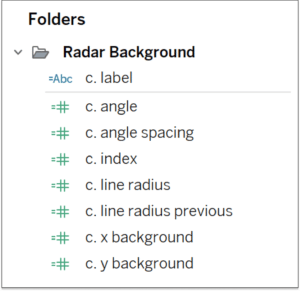
Open up the first sheet in your workbook, and let’s get started creating the radar background by creating the necessary calculated fields.
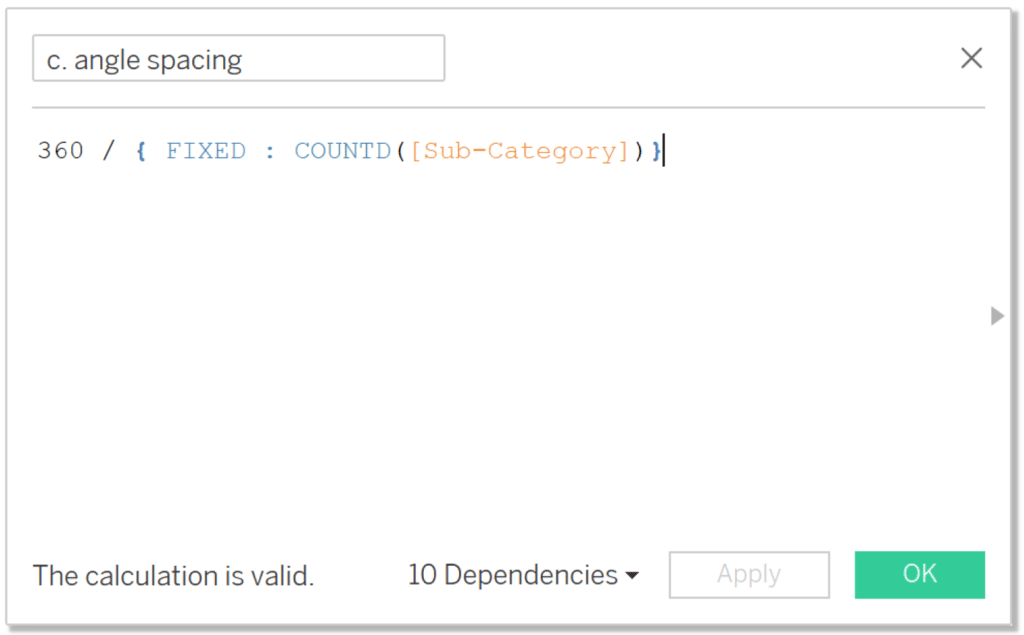
The first calculation you will create is called ‘c. angle spacing’ which will create the spacing between the Sub-Categories on the radar background by taking 360 degrees divided by the number of sub-categories in the view.
Logic: 360 / {FIXED: COUNTD(Sub-Category)}
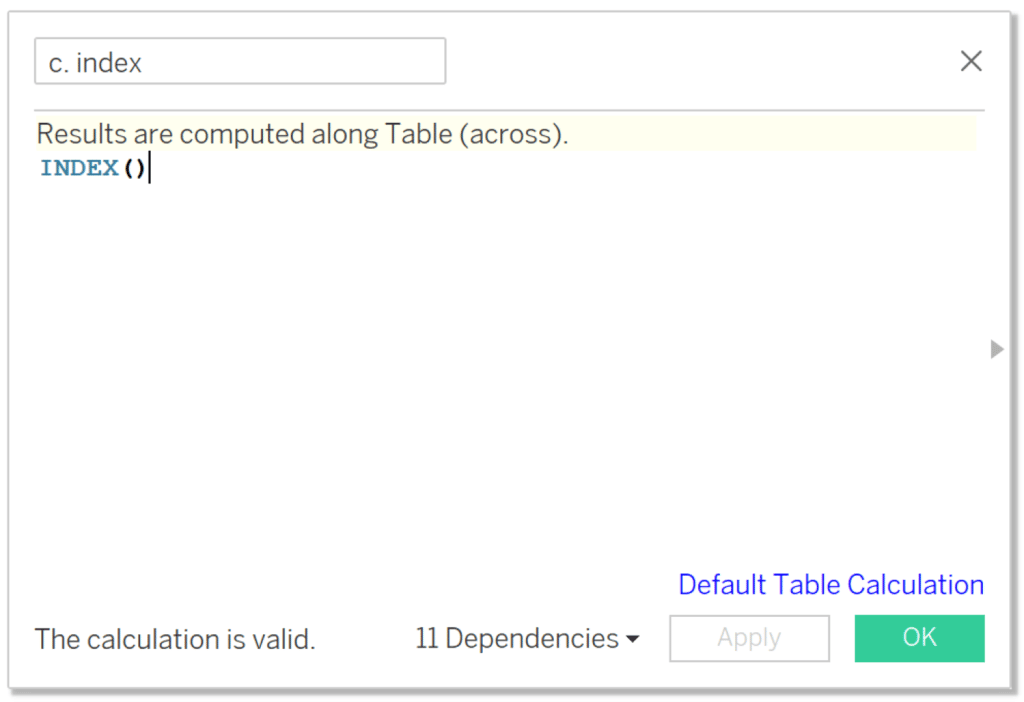
Next, create a calculated field called ‘c. index’, which gives us a numeric identifier for each dimension we’re showing.
Logic: INDEX ()
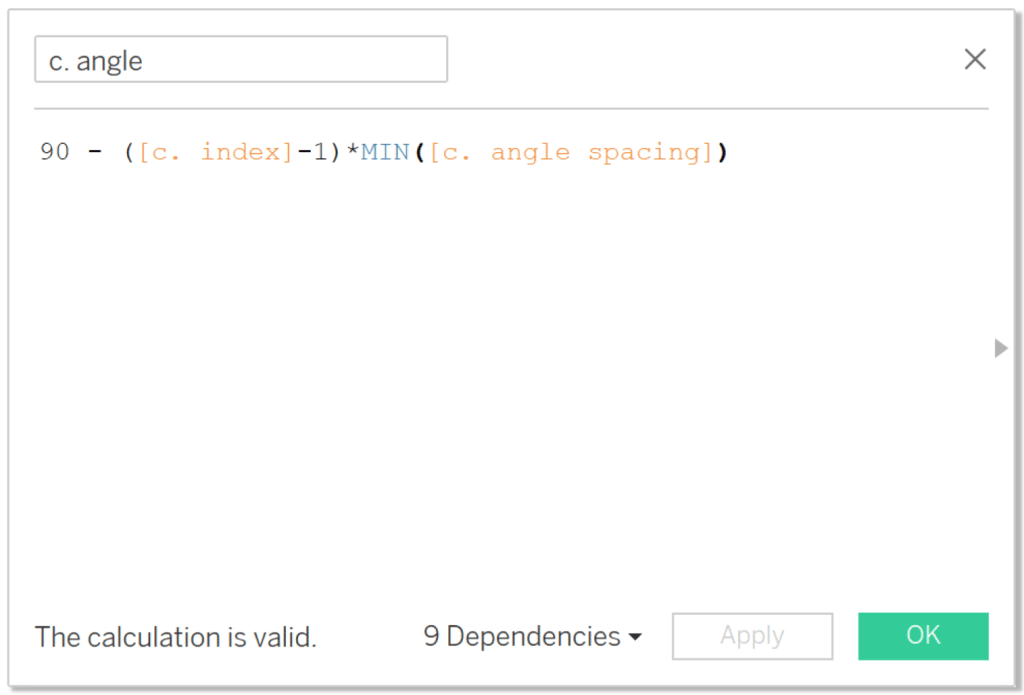
Create a calculated field called ‘c. angle’, which calculates the angle on which we’ll plot each point, starting at 90 degrees and moving clockwise.
Logic: 90 – ([c. index]-1)*MIN([c. angle spacing])
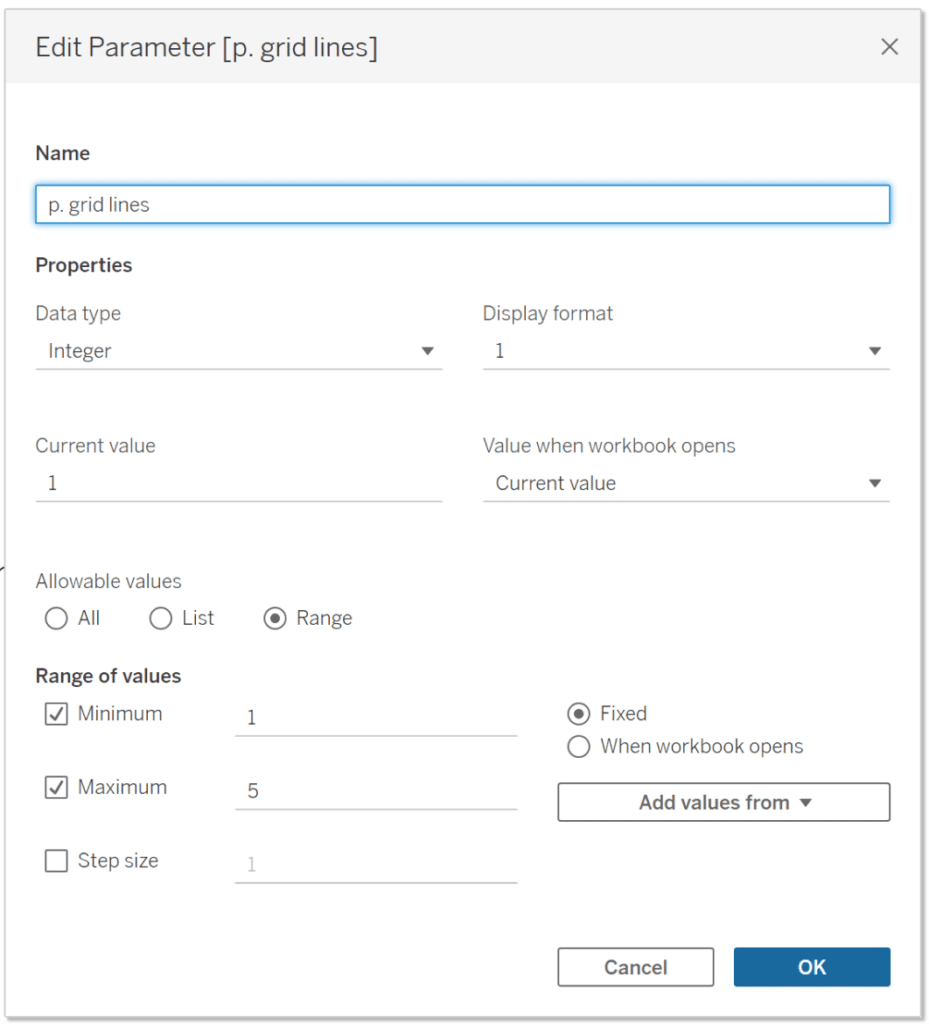
Create a parameter called ‘p. grid lines‘, which will allow us to calculate the radius of each line. The Data type is Integer, select Range for the Allowable values, set the Range of Values to however many lines you have specified in the data set as this is what will determine how many lines are drawn in the web. For this example, I specified 5 lines so I’ll set the Minimum to 1 and the Maximum to 5.
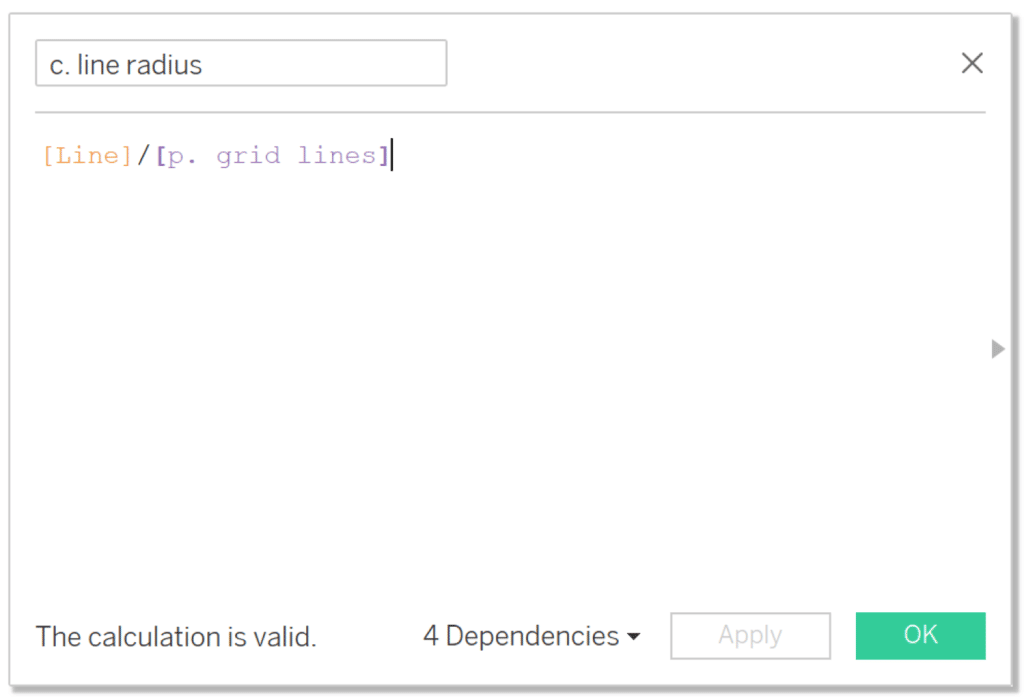
Then create a calculated field called ‘c. line radius’.
Logic: [Line] / [p. grid line]
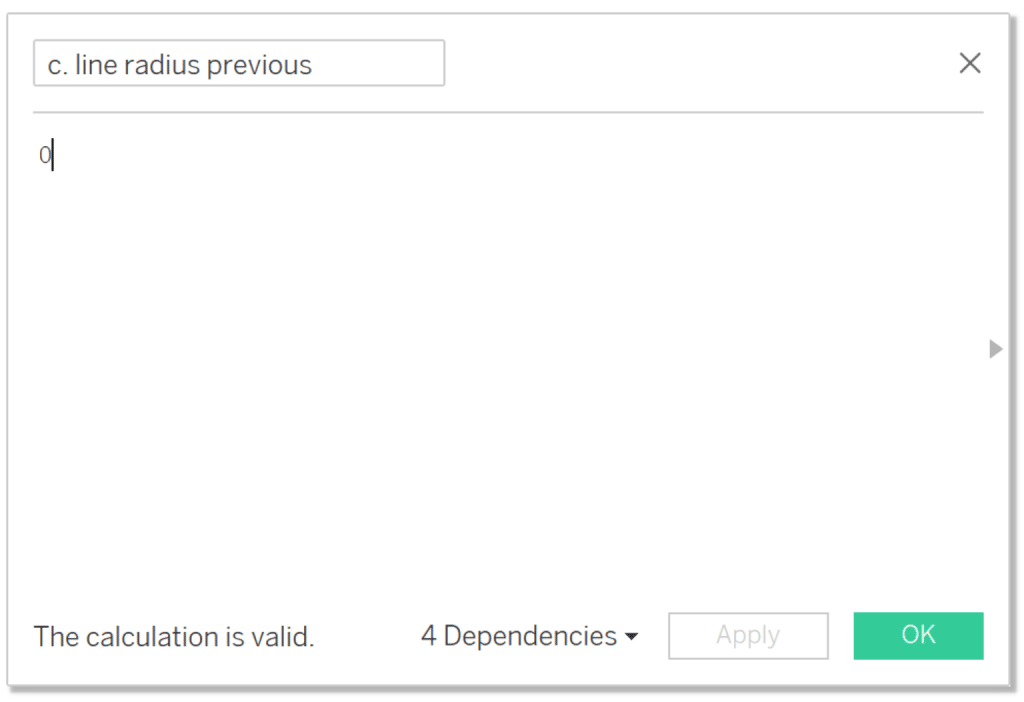
Now create a calculation called ‘c. line radius previous’ which looks back at the radius of the previous grid line and will have a value of 0.
Logic: 0
Lastly, we’ll create our x & y coordinates.
Name your x coordinate calculation ‘c. x background’. This will give us the x coordinate of each point on our background and draw separate polygons.
Logic:
CASE ATTR([Point])
WHEN “Polygon Center Right” THEN [c. line radius previous]*(RADIANS([c. angle]))
WHEN “Polygon Center Left” THEN [c. line radius previous]*(RADIANS([c. angle]+ATTR([c. angle spacing])))
WHEN “Polygon Top Right” THEN MIN([c. line radius])*COS(RADIANS([c. angle]))
WHEN “Polygon Top Left” THEN MIN([c. line radius])*COS(RADIANS([c. angle]+ATTR([c. angle spacing])))
END

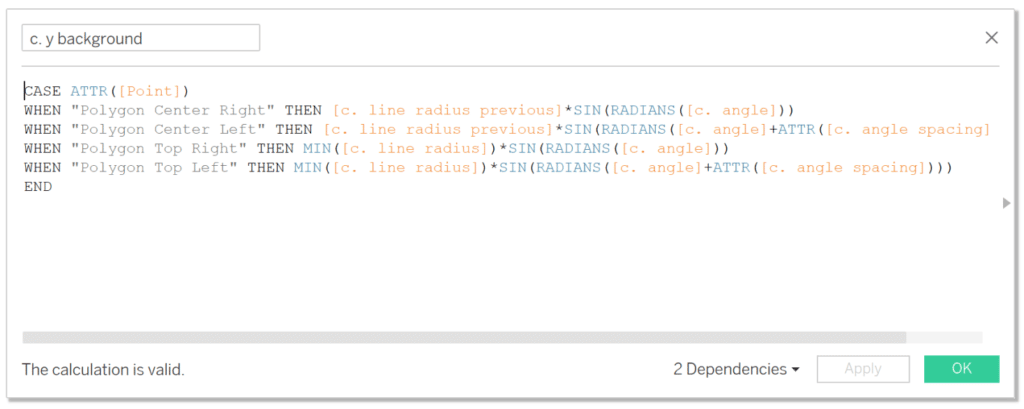
Then create your y coordinate, named ‘c. y background’.
Logic:
CASE ATTR([Point])
WHEN “Polygon Center Right” THEN [Line Radius Previous]*SIN(RADIANS([Angle]))
WHEN “Polygon Center Left” THEN [Line Radius Previous]*SIN(RADIANS([Angle]+ATTR([Angle Spacing])))
WHEN “Polygon Top Right” THEN MIN([Line Radius])*SIN(RADIANS([Angle]))
WHEN “Polygon Top Left” THEN MIN([Line Radius])*SIN(RADIANS([Angle]+ATTR([Angle Spacing])))
END
Assemble the spider web chart in Tableau
Now that all of our calculated fields are ready, let’s start assembling the view.
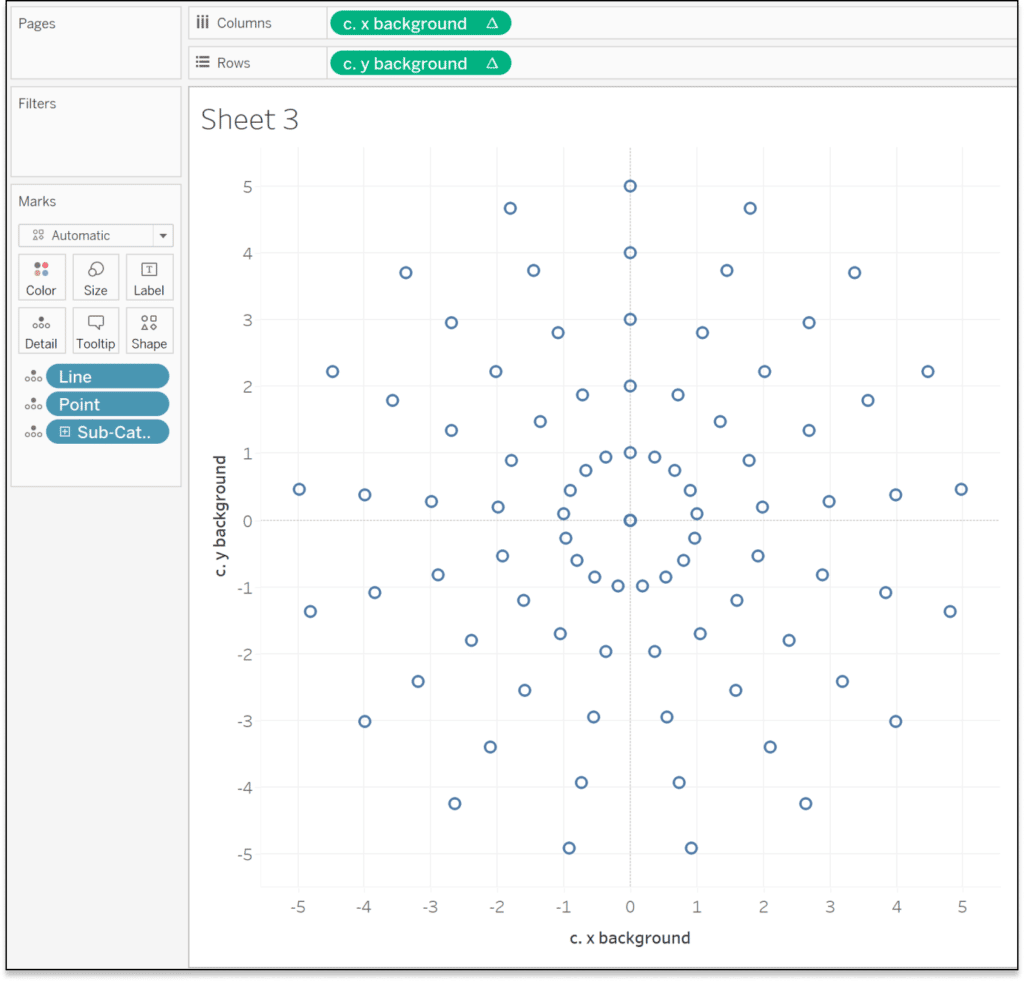
Place Point, Sub-Category, and Line onto the Detail property of the Marks card. Then place c. x background on the Rows shelf and c. y background on the Columns shelf. Right-click on c. x background, select Compute Using, and choose Sub-Category. Repeat for c. y background.
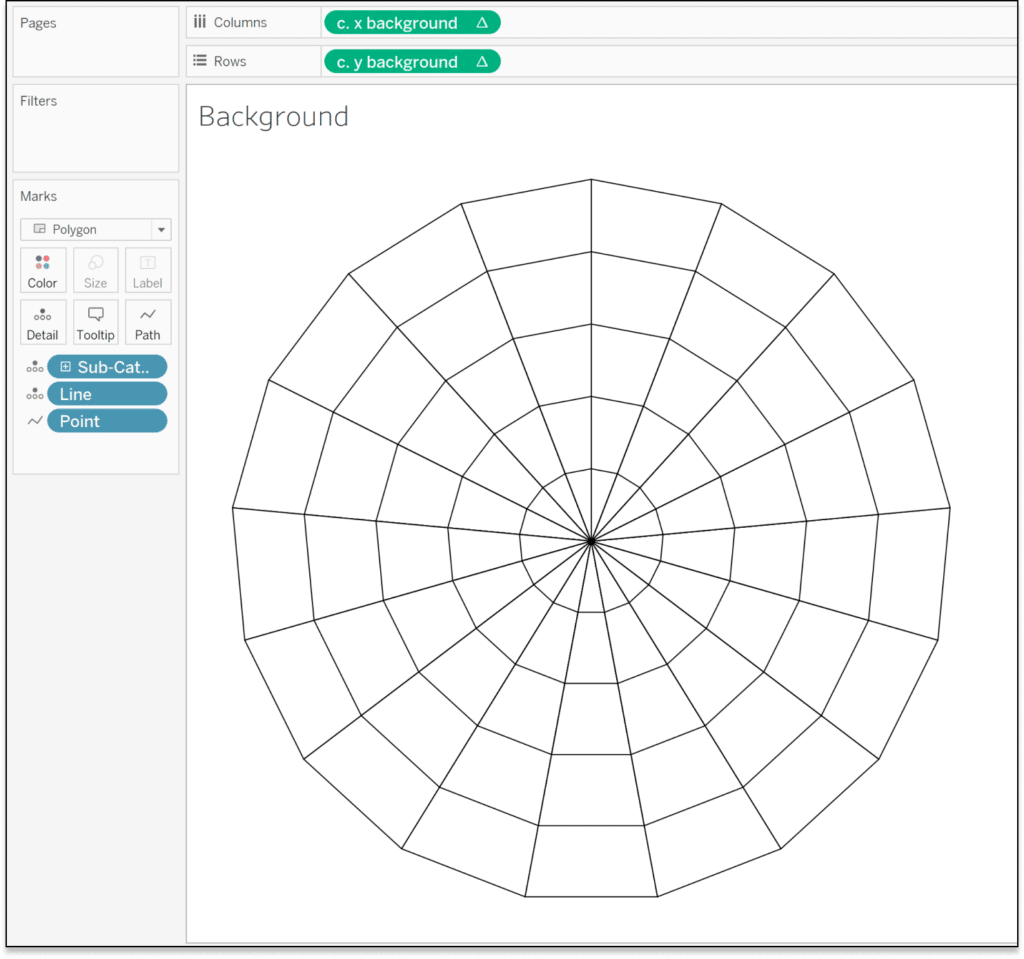
Change the Mark type from Automatic to Polygon, move Point from the Detail property to the Path property of the Marks card, and change the Color to white and add a black border. Lastly, format your view to remove the grid lines and axis.
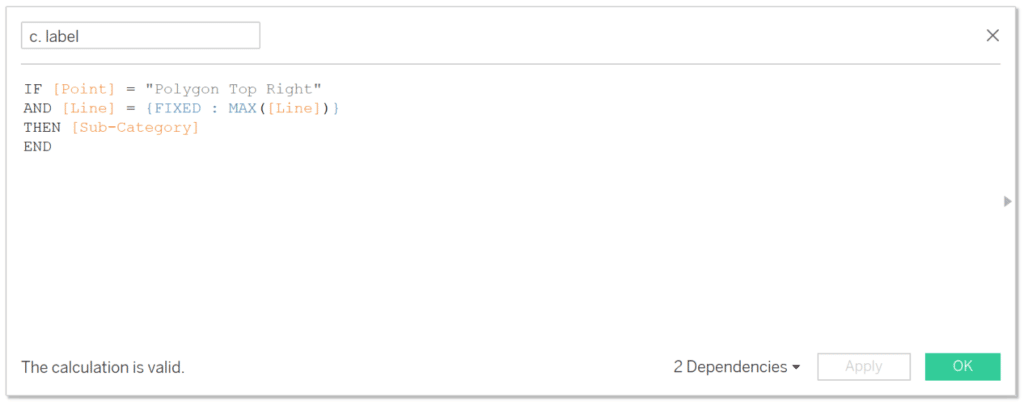
Now let’s add labels to each point so we know what our plotted points are. We need to create a calculation called ‘c. label’ which will only show the relevant label name per point.
Logic:
IF [Point] = “Polygon Top Right”
AND [Line] = {FIXED : MAX([Line])}
THEN [Sub-Category]
END
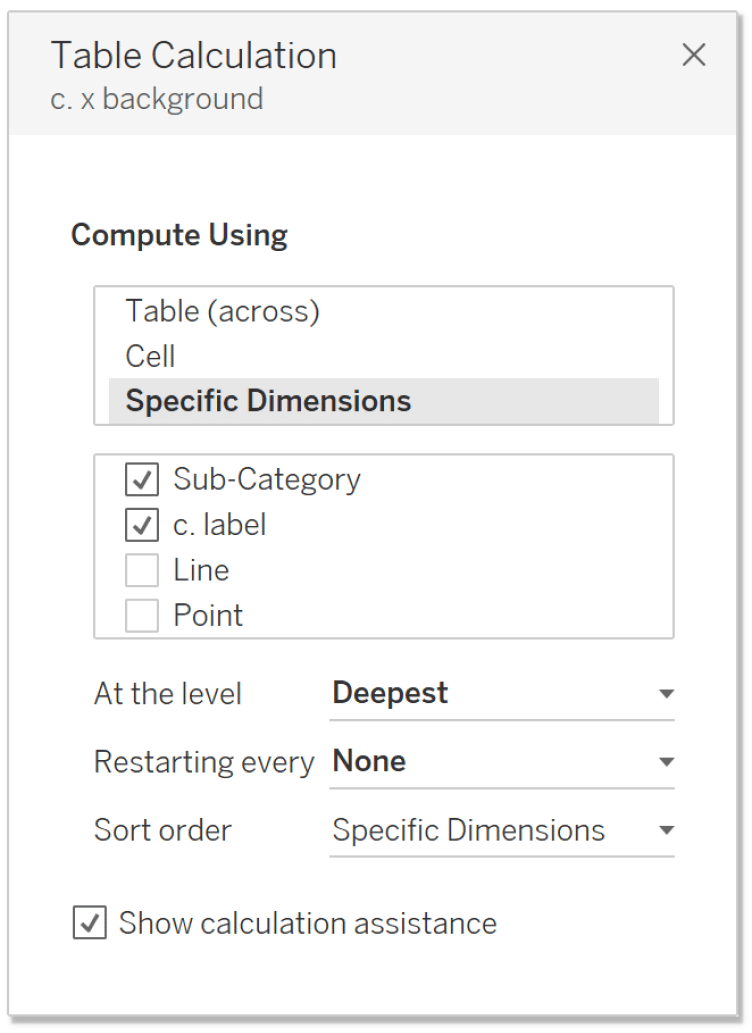
Now let’s adjust the view to show these dynamic labels. First duplicate the ‘c. x background’ on the Rows shelf by holding down the Ctrl button then clicking and dragging the ‘c. x background’. Right-click the duplicated measure and select Dual Axis. Navigate to the Marks card and select ‘c. x background (2)’ and change the Mark type from Polygon to Circle. Move the Size slider all the way to the left so you cannot see the circles. Place c. label onto the Label property of the Marks card. Lastly, right-click on the duplicated c. x background on the Rows shelf and select Edit Table Calculation. Select Specific Dimensions and checkmark Sub-Category and ‘c. label’, as seen below.
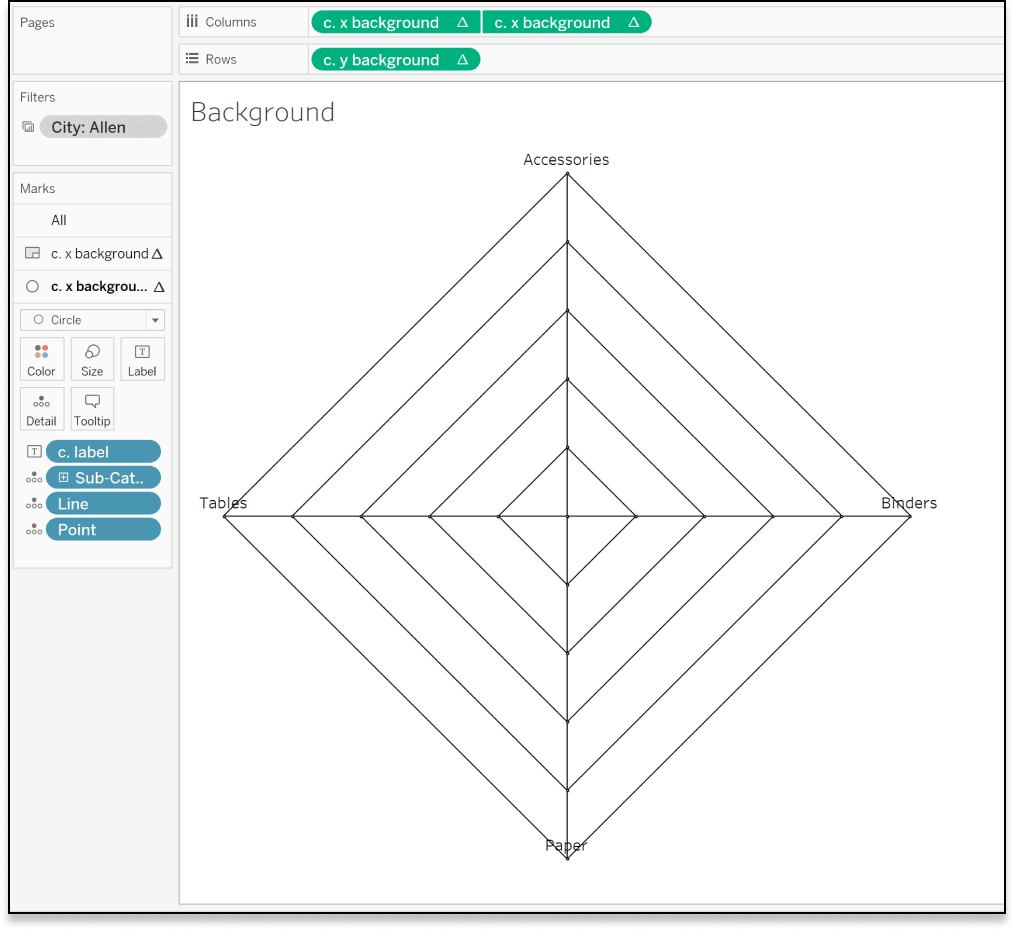
Because we only want the relevant sub-categories for the selected city, we will then add City to the Filters shelf. Lastly, right-click City and select Add to Context.
![]()
We now have the dynamic spider web background, the next step is to create the radar chart. If you don’t know how to create a radar chart, then you can follow Felicia Styer’s blog post, How to Create Radar Charts in Tableau.
Once the radar chart has been built, you will want to assemble your dashboard. First, drag the radar background sheet to the view and make it floating. Navigate to the Layout pane and change the Position of both X and Y to 8. Then adjust the size to 984 x 784 (although these settings can change based on your use case).
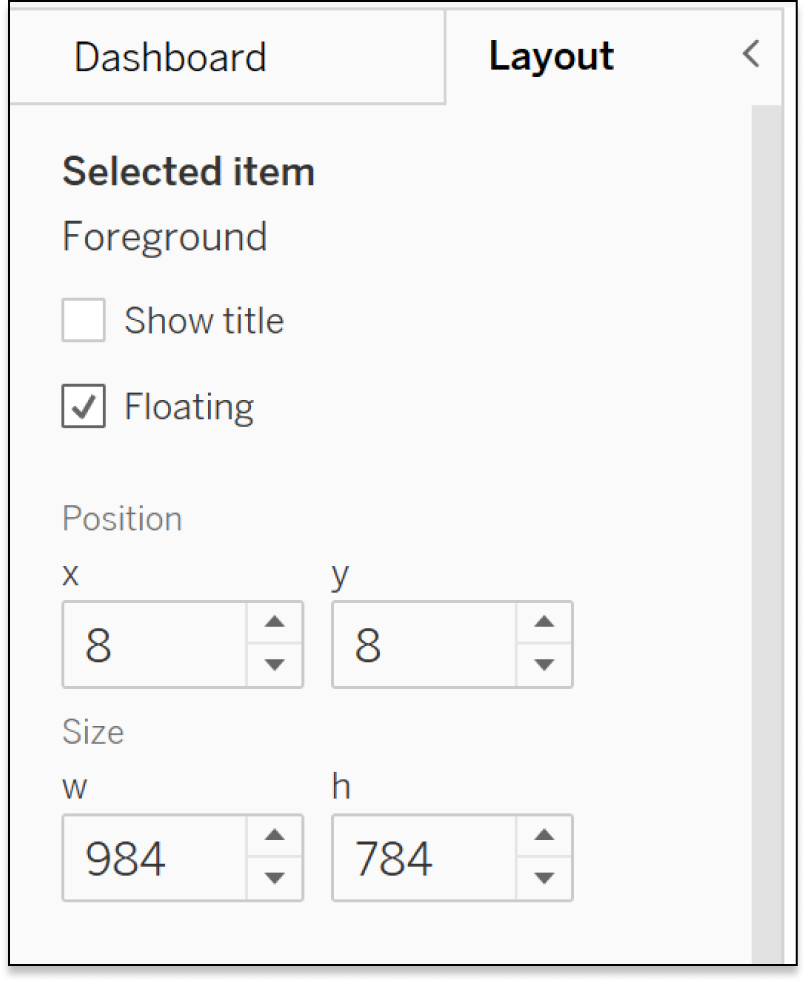
Lastly drag your Radar Chart to the dashboard and adjust the settings in the Layout pane to be identical to the Radar Background so the two sheets align perfectly.
And that’s it! You now have a dynamic radar chart and background image to provide a better user experience for your end user. I hope you found this tutorial and chart type as useful as I have. As always, feel free to reach out to me if you have any thoughts, questions, or suggestions for this blog or any future content.
Thanks,
Dan
[email protected]

Written By
Dan Bunker

Peer Review
Alyssa Huff
Assoc. Director, Information Design
Related Content
How to Make a Radar Chart in Tableau

Radar charts are great for catching attention! However, keep in mind that they are difficult to interpret. So combining a…
The Ultimate Guide to Getting High Resolutions In and Out of Tableau

What makes dashboards attractive, engaging, and thought-provoking? While data can craft a compelling narrative, the human eye is naturally drawn…
The Beginner’s Guide to Tableau Table Calculations
Tableau table calculations, while very powerful, can be both tricky and confusing to work with. There are some great benefits…