The Ultimate Guide to Getting High Resolutions In and Out of Tableau


What makes dashboards attractive, engaging, and thought-provoking? While data can craft a compelling narrative, the human eye is naturally drawn to visually appealing things. Poorly designed dashboards fail to convey useful information and make the data less comprehensible. Much like telling a good joke, the delivery is as important as the content. So, when designing dashboards, we can take several steps during the image creation process to ensure that our products are designed efficiently and distributed at the highest resolution possible in Tableau.
Images can act as a powerful ally when analyzing data. We use images for various reasons:
-
- To define on-brand-themed dashboards.
- To elevate the UI/UX as visual cues.
- To incite an action as hyperlinks or marks to filter/drill into the data or onto other sections of the report.
With Tableau, we can use custom images to uniquely tailor our products and add another layer to the design. This entry dives into the different ways that Tableau supports image integration and what to consider for ensuring high-quality image resolution in your dashboards.
Considerations for optimizing image resolution in your dashboards (outside Tableau)
Plan for static designs with background images
There are many ways to use custom images in Tableau – such as shapes on a worksheet, web objects, image objects, tooltips, etc. Most of these can cause load performance and/or image resolution problems. Planning the design to be as static as possible with background images reduces the number of custom elements on the view and, in turn, rids of rendering complications.
Background images are displayed beneath the data and can add context or reference points to your information and visualizations on the view. A background image can act as your data’s skeleton, providing the structure and card layout needed to elevate your dashboard’s fidelity.
We consider “dynamic images” as the images that will change based on an interaction and display a shift in state. Toggles that change between ON/OFF states or images that live within a chart are considered dynamic.
We consider “static images” as anything that will remain unchanged throughout the dashboard across time despite user interactivity. For example, card/container layouts and text (headliners or body) can be easily incorporated into the background image to reduce an unnecessary count of shapes on the worksheet. Additionally, you can also relocate navigational controls and CTA buttons to the background and use invisible shapes instead (keep reading to learn more!).
Allocating your dashboard elements to these two groups – static or dynamic – helps in planning and considering design and engineering needs early on. The more that you can design your dashboard around static elements, the more efficient it will become with fewer images on your worksheet to update, maintain, and render.
3 Ways to Optimize Tableau Workbook File Size
Continue reading with a free account, or login.
Unlock this tutorial and hundreds of other free visual analytics resources from our expert team.
Already have an account? Sign In
By continuing, you agree to our Terms of Use and Privacy Policy.
Choosing the right image file type to export
Choosing the right image format can reduce unnecessary file sizing without sacrificing the image quality. Different file types offer different advantages when using custom images, where JPG, PNG, and SVG can affect your dashboard performance.
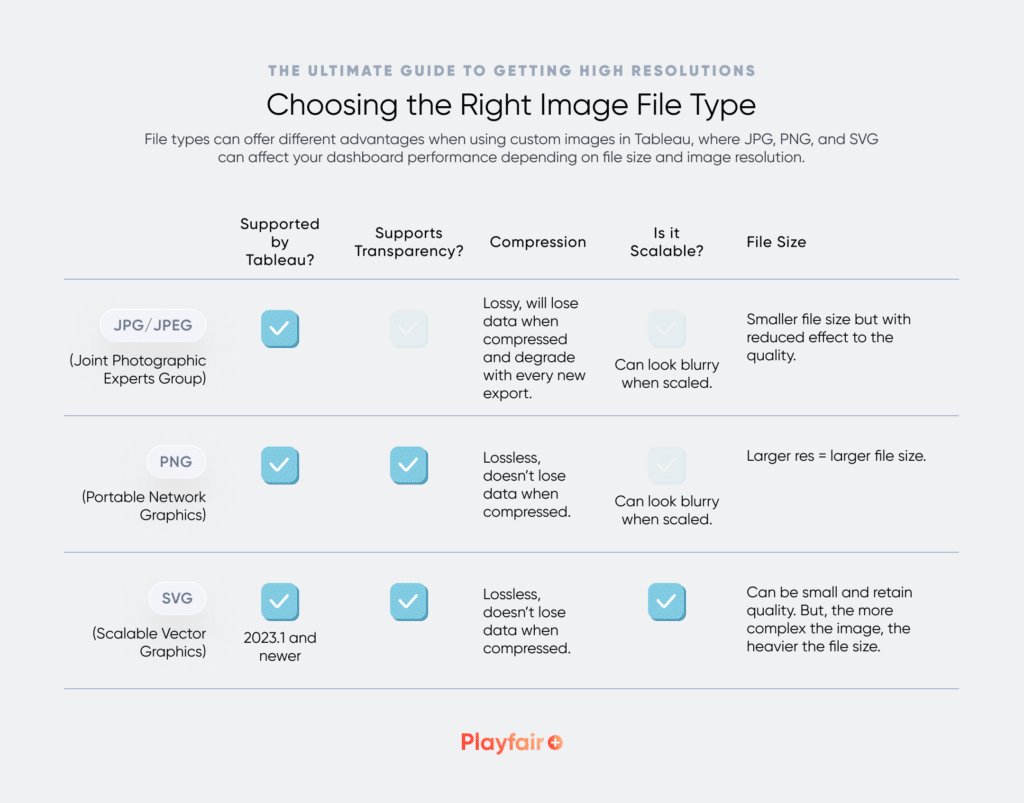
If you or your users don’t have Tableau 2023.1 or newer versions, they may have trouble viewing and using SVG image files since only PNG, JPEG/ JPG image files are supported. In that case, upgrade to a newer version or employ a supported file type for the version of Tableau in use.
- It is worth noting that, while SVG presents a great advantage in regards to image resolution, it can still come in second after PNGs in regards to file size. More complex images can be heavier as SVGs than in PNG format. That is because the file size will depend on the number of paths (anchor points) in the vector shape that, when increased, the mathematical information to store them will also increase, hence making it heavier. Depending on the use case, PNGs can sometimes carry information better when using complex custom images.
Regardless of the chosen image file type, it is good practice to test your custom images on Tableau Public, Tableau Cloud, and Tableau Server to ensure they are rendering correctly across different platforms.
Consider the pixel density of your custom images
Pixel density is the number of pixels per linear physical unit or PPI. The higher the pixel density per inch, the sharper the custom image.
Nowadays, high-resolution screens have a higher pixel density, meaning that there are more pixels in the same amount of physical space. For this reason, we need to consider the scale factor whenever designing our custom images.
A standard-resolution image has a scale factor of 1, known as a @1x image. High-resolution images have a scale factor of 2 or 3 and are referred to as @2x and @3x images. To illustrate, an icon that is 16px x 16px will remain the same at a @1x image, but doubles in pixels when rescaled to @2x to be 24px x 24px, hence also increasing the file size.
When storing your custom images, and before uploading them to Tableau, you must document the scale factor by appending “@1x,” “@2x,” or “@3x” to its filename. For example, [email protected].
Since it is hard to predict the resolution display of our audience, we recommend using a scale factor of @2x and @3x, so that, regardless of the device used to access the dashboard, the images are crisp.
Note that this scale factor distinction is not required for SVG file types as they are vector-based, not pixel-dependent.
3 Ways to Wow Stakeholders with Figma
Tableau tips for optimizing image resolution
Check your work through your audience’s eyes
It is important to always check the workbook’s appearance after publishing because your workbook will render slightly differently in Tableau Desktop and Tableau Cloud. In the past, we’ve had to modify special characters, fonts, images, and line formatting settings that looked great in Tableau Desktop, and appeared fuzzy online. To avoid a cycle of editing, publishing, and rechecking, use Web Edit to set final position and size settings.
Appearance can also vary between monitors, depending on resolution and scale settings. We recommend viewing the dashboard on multiple screens and devices before sending work into production.
Unexpected hacks for interactive elements
Invisible buttons and marks let us split controls into two objects – an invisible interactive element, and a separate visible control layered beneath it. With this method, any static controls can be added to the background image, and then the interactive objects are layered over that section of the background. If you’d like to see an example of an invisible button in action, check out the Atlas Preview on Playfair Data’s Tableau Public page.
Sometimes layering floating sheets, text boxes, or image objects can give the illusion of a dynamic image. Parameters in text boxes could make an indicator change from ‘Off’ to ‘On’, or ‘<’ to ‘>’ without updating any images. Dynamic Zone Visibility can cover images with their alternate states after an interaction. This allows us to create dynamic buttons with multiple states with only static image objects.
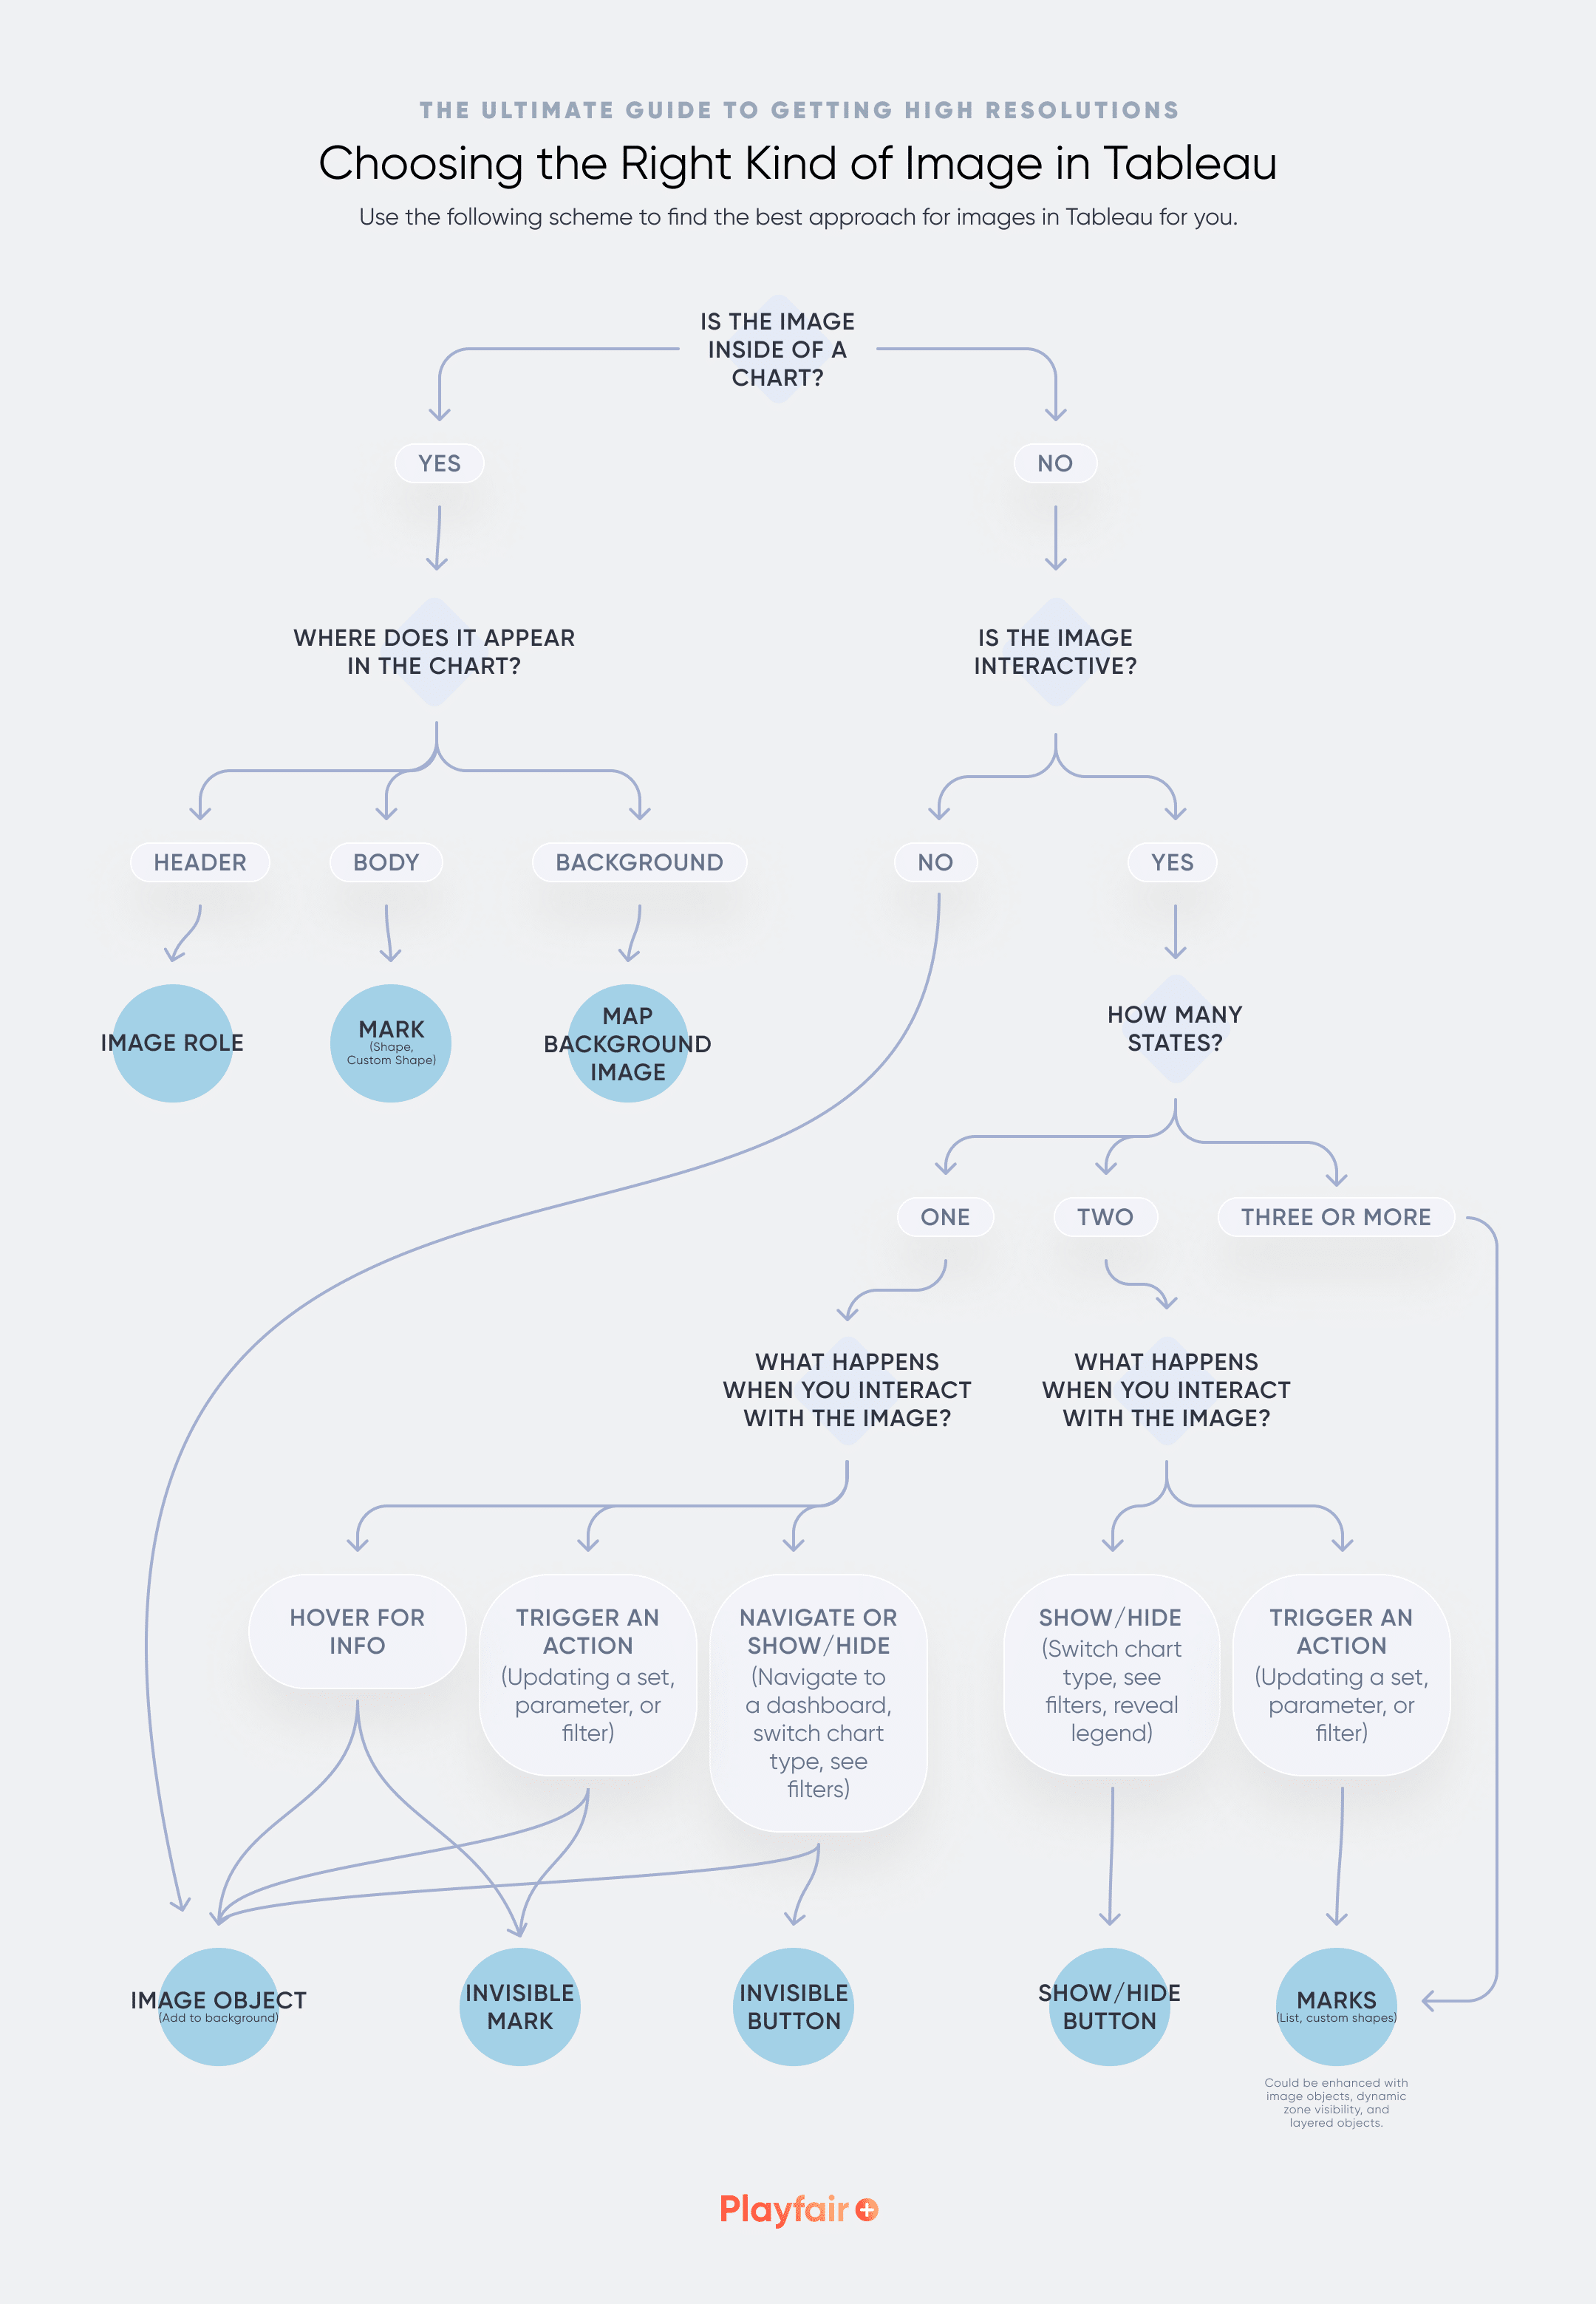
Choosing the right kind of image
There are five ways to add images to Tableau. Each has different size and fit controls, and different roles in a dashboard. Understanding their strengths and limitations is key.
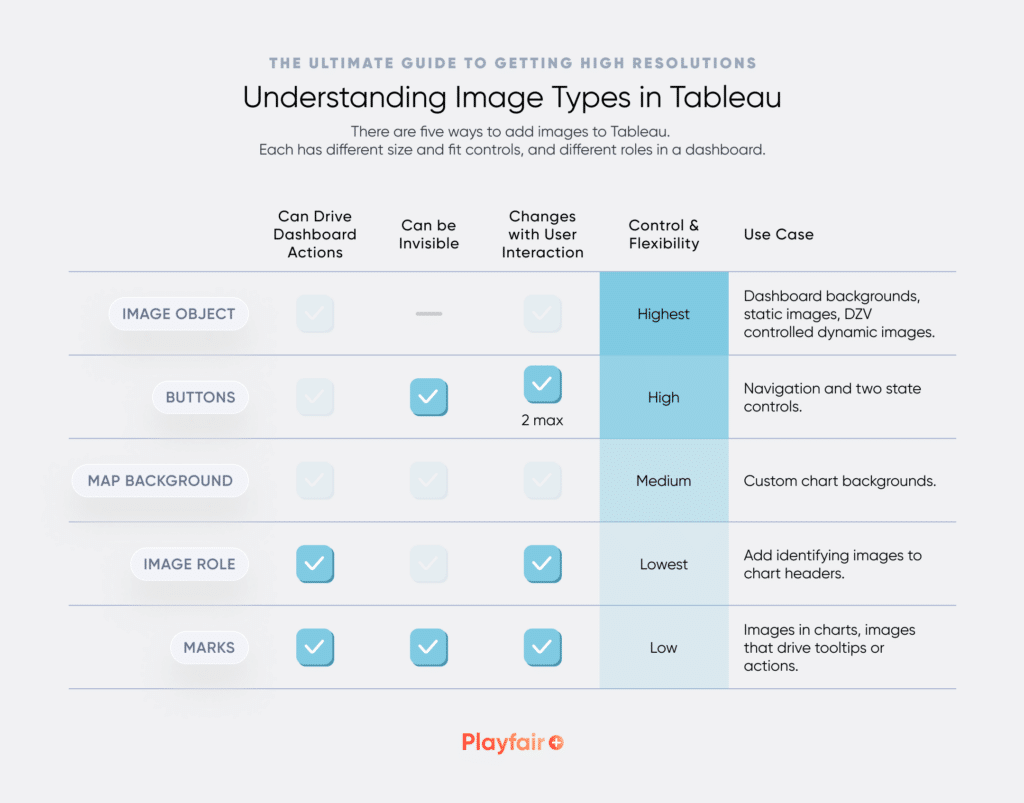
Image Objects offer the most control over fit and size, resulting in the best resolution. However, they are not dynamic and cannot trigger actions. Custom shapes have the most interactivity, but often appear blurry. Image Role and Map Background Images are both specialized, and used as needed.
Technical details
- Image Objects have the most detailed size and fit controls, resulting in better resolution. Try to use these whenever possible. We’ve found that png images with 2x pixel density or svg images generally work best.
When image objects are added to a dashboard, the Edit Image Object menu automatically appears. Check both Fit Image and Center Image to avoid white space in the object.
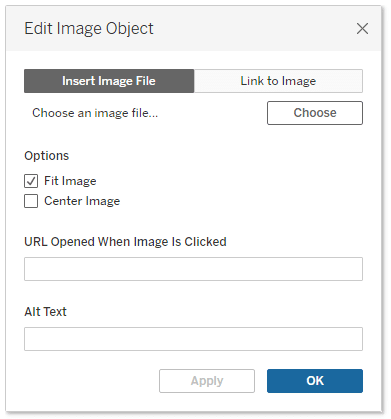
Once added, go to the Layout menu and adjust the image size and padding. These Layout settings are just as important as the settings in the Edit Image Object menu. Make sure the final image size matches the original image size, or at least has the same ratio.
We like to use a background image on our dashboards. Add this object to the view first, then float the other containers and objects over the background image. Make sure to remove padding from the container holding the background image as well. Move static images like buttons and info icons to the background image to ensure consistency in image resolution.
- Navigation and Show Hide Buttons share similar controls. The only difference is Show Hide buttons include settings for both the Item Shown and Item Hidden states.
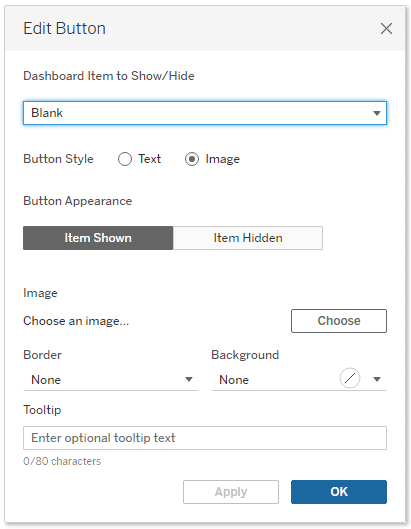
Image buttons are automatically set to fill and center. Images keep the same aspect ratio, and fill the space until bounded by the top or bottom of the object. The unbounded edges will have white space. These images generally look sharp, but if you notice fuzziness, go to the Layout menu and adjust the object size to the nearest multiple of the original dimensions.
To create an invisible button, use the text button type, remove the border and background, and add an invisible character to the button text. I like to use U+2800, which you can copy here: >⠀<.
The Definitive Guide to Buttons in Tableau
- Custom Shapes are marks, so they’re ideal for icons that drive tooltips and actions or appear within a chart. They can be used for custom buttons like toggles or radio buttons. We’ve seen the best results using png files instead of jpg. Custom shapes do not support svg file types. Pixel density can affect the image resolution, but image dimensions have a bigger impact on resolution. If images look fuzzy, try adjusting the worksheet size to get the image closer to its original size. This adjustment is imprecise, and can require several rounds of tweaks. When possible, use other methods to display images.
Custom shapes for buttons often appear tiny when added to a worksheet. The best way to work with them depends on the sheet setup. If you don’t have an axis, simply set the worksheet fit to Entire View, and leave the Size slider at it’s default position. Then you can resize the worksheet on your dashboard as needed and the shape will resize appropriately. With axes, you often need to max out the size slider to get the buttons up to the appropriate size.
How to Make Indicators with Custom Shape Palettes in Tableau
To create an invisible mark, use a Shape Mark type and set the shape to Open Circle or Open Square. Add at least one measure to the Details property, and make sure all fields in the view are aggregated. Max out the size slider, and set the fit to Entire View. When you add it to the dashboard, make sure the worksheet shading is changed to None to remove the default background color.
- Image Role displays web images in chart headers through urls in the dataset. This is a pretty specialized use case, commonly used for flags, avatars, or other identifying images. Size and fit controls are pretty limited. The images keep their original aspect ratio and stretch until bounded by the header height or width, leaving white space on the unbounded sides. Because of this, the image sizes can vary if row counts vary, or original image ratios are inconsistent. To keep images aligned, try narrowing the image column (or shortening the row). I’ve noticed the best results when the images are closer to their original size. When possible, using an svg image type instead of png or jpg has been shown to improve resolution.
3 Innovative Ways to Use Image Role in Tableau
- Map Background Image adds custom chart backgrounds to charts. These stay aligned to the charts as the sheet is moved or resized on the dashboard. This is great for custom charts like gauge or radar charts.
The image options for background images are pretty detailed. First you choose the image file, and set the axis controls. On the second tab of the menu, make sure Lock Aspect Ratio is checked to avoid image distortion.
How to Map a Custom Background Image in Tableau
Conclusion
Custom images allow creators to customize and drive more data insights. Image resolution will define the user experience of your dashboards, where high-quality designs support usability and engagement, and poorly implemented ones only add to our users’ pain points. Beautiful data visualization interfaces are both easy to use and easy on the eyes!
Thanks for reading,
Rafael & Felicia

Written By
Rafael Simancas

Written By
Felicia Styer

Peer Review
Jason Penrod
Director, Information Design

Peer Review
Dan Bunker
Manager, Decision Engineering
Related Content
3 Innovative Ways to Use Image Role in Tableau
In version 2022.4, Tableau Desktop introduced us to a brand new feature: Image Role. This UX-enhancing tool allows users to…
3 Innovative Ways to Use Figma in Your Visual Analytics Projects
What does design software have to do with visual analytics software like Tableau? At Playfair Data, we approach our visual…

Ryan Sleeper
Make engaging explanatory dashboard elements with any images Learn how to create custom shape palettes in Tableau and how to…