How to Implement Column-Level Security in Tableau

In the first part of this two-part series, I introduced How to Implement Row-Level Security in Tableau. This method is a scalable way to limit which rows a user has access to, and we demonstrated this by segmenting our orders to different sales teams. However, what if I didn’t mind the users seeing all the orders or rows but I wanted to restrict some users from seeing Profit, which is a column in the data set? There are several ways we can account for this. In this tutorial, I will show you three ways to implement column-level security. Each method has its pros and cons, which I will discuss at the end of each section. It is important to understand what the pros and cons are because they can affect the performance of the report, the maintenance of the report, or even the workload of the Developers and/or Data Engineers.
Using a calculated field for column-level security in Tableau
The most straightforward approach I have implemented is to use a simple calculated field to determine access to the measure in question. To begin, I have connected to another blog of mine that I think will demonstrate this technique well. Here is a screenshot of the dashboard:
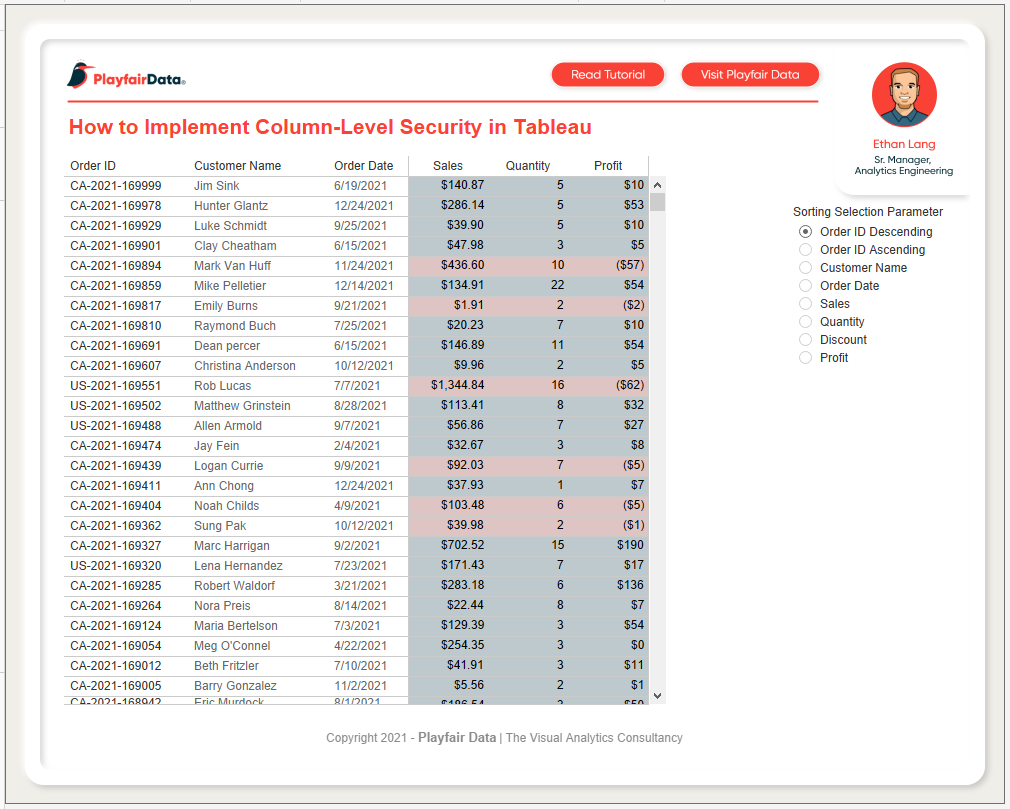
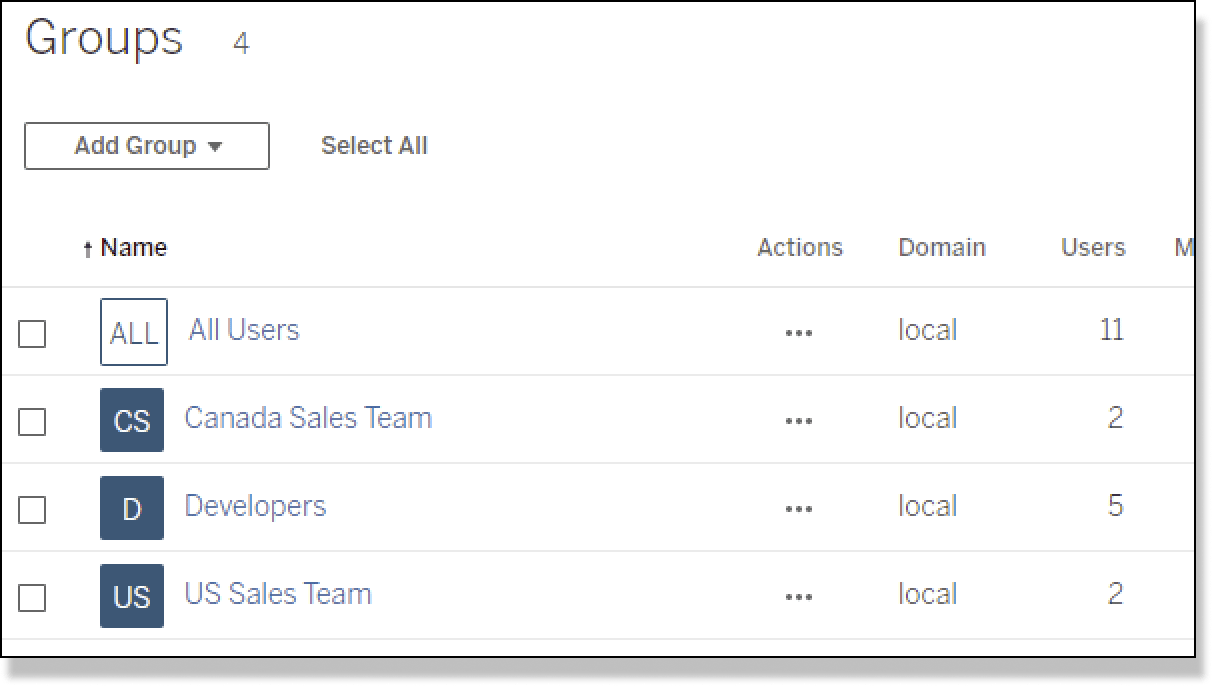
For our scenario, let’s say we wanted to limit our Sales teams in the field from seeing Profit, but we wanted to give Developers and HQ users access to Profit. As an admin, I have already created some groups for these users in my Tableau Online or Tableau Server portal.
In Tableau Desktop, we can now create a new calculated field for profit where we are checking which user group the user is in.
![]()
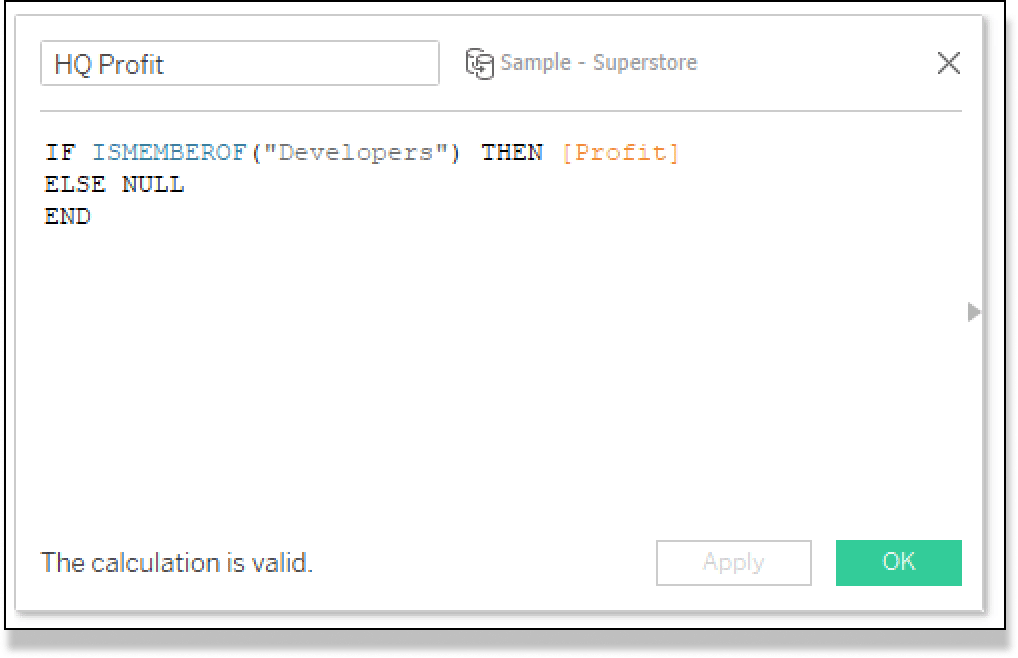
To do this, I am going to create a new calculated field and name it HQ Profit, then enter the following calculation:
IF ISMEMBEROF(“Developers”) THEN [Profit]
ELSE NULL
END
Continue reading with a free account, or login.
Unlock this tutorial and hundreds of other free visual analytics resources from our expert team.
Already have an account? Sign In
By continuing, you agree to our Terms of Use and Privacy Policy.
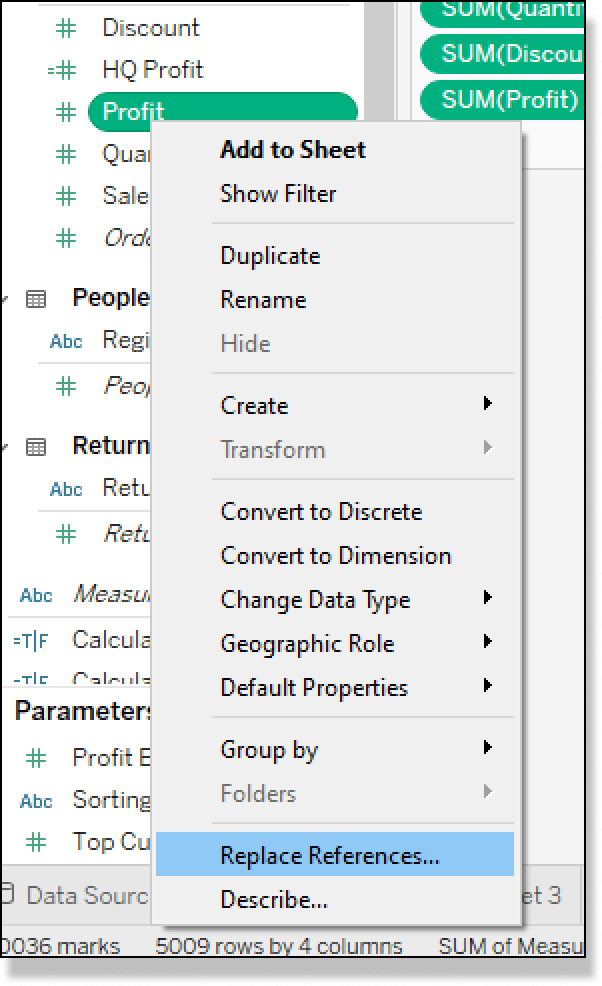
Now I will exchange my current Profit field with this new HQ Profit field. The fastest and most effective way to do this is to Replace References for the original Profit measure. To do this, right-click on Profit in the Data pane and select Replace References from the menu.
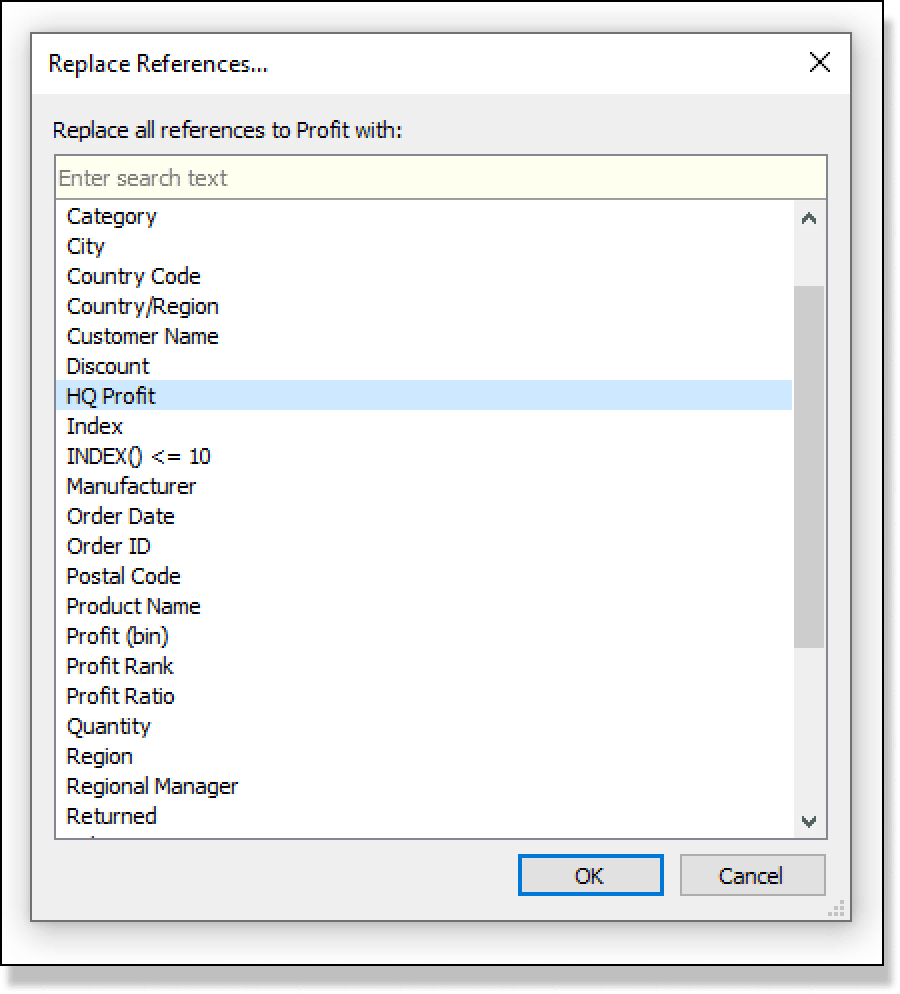
Once that selection is made, you will see a new dialog box appear. From the list of measures in that list, select the new HQ Profit calculated field, then click OK.
This will replace the original profit value with the new HQ Profit, not only on any sheet but also if that Profit field is being used in other calculated fields.
Let’s test it out now that our new field is in place across the workbook. From the dashboard, I will select Ariana Cukier, who is assigned to our Canada Sales Team group. This means that Profit should now go NULL for her.
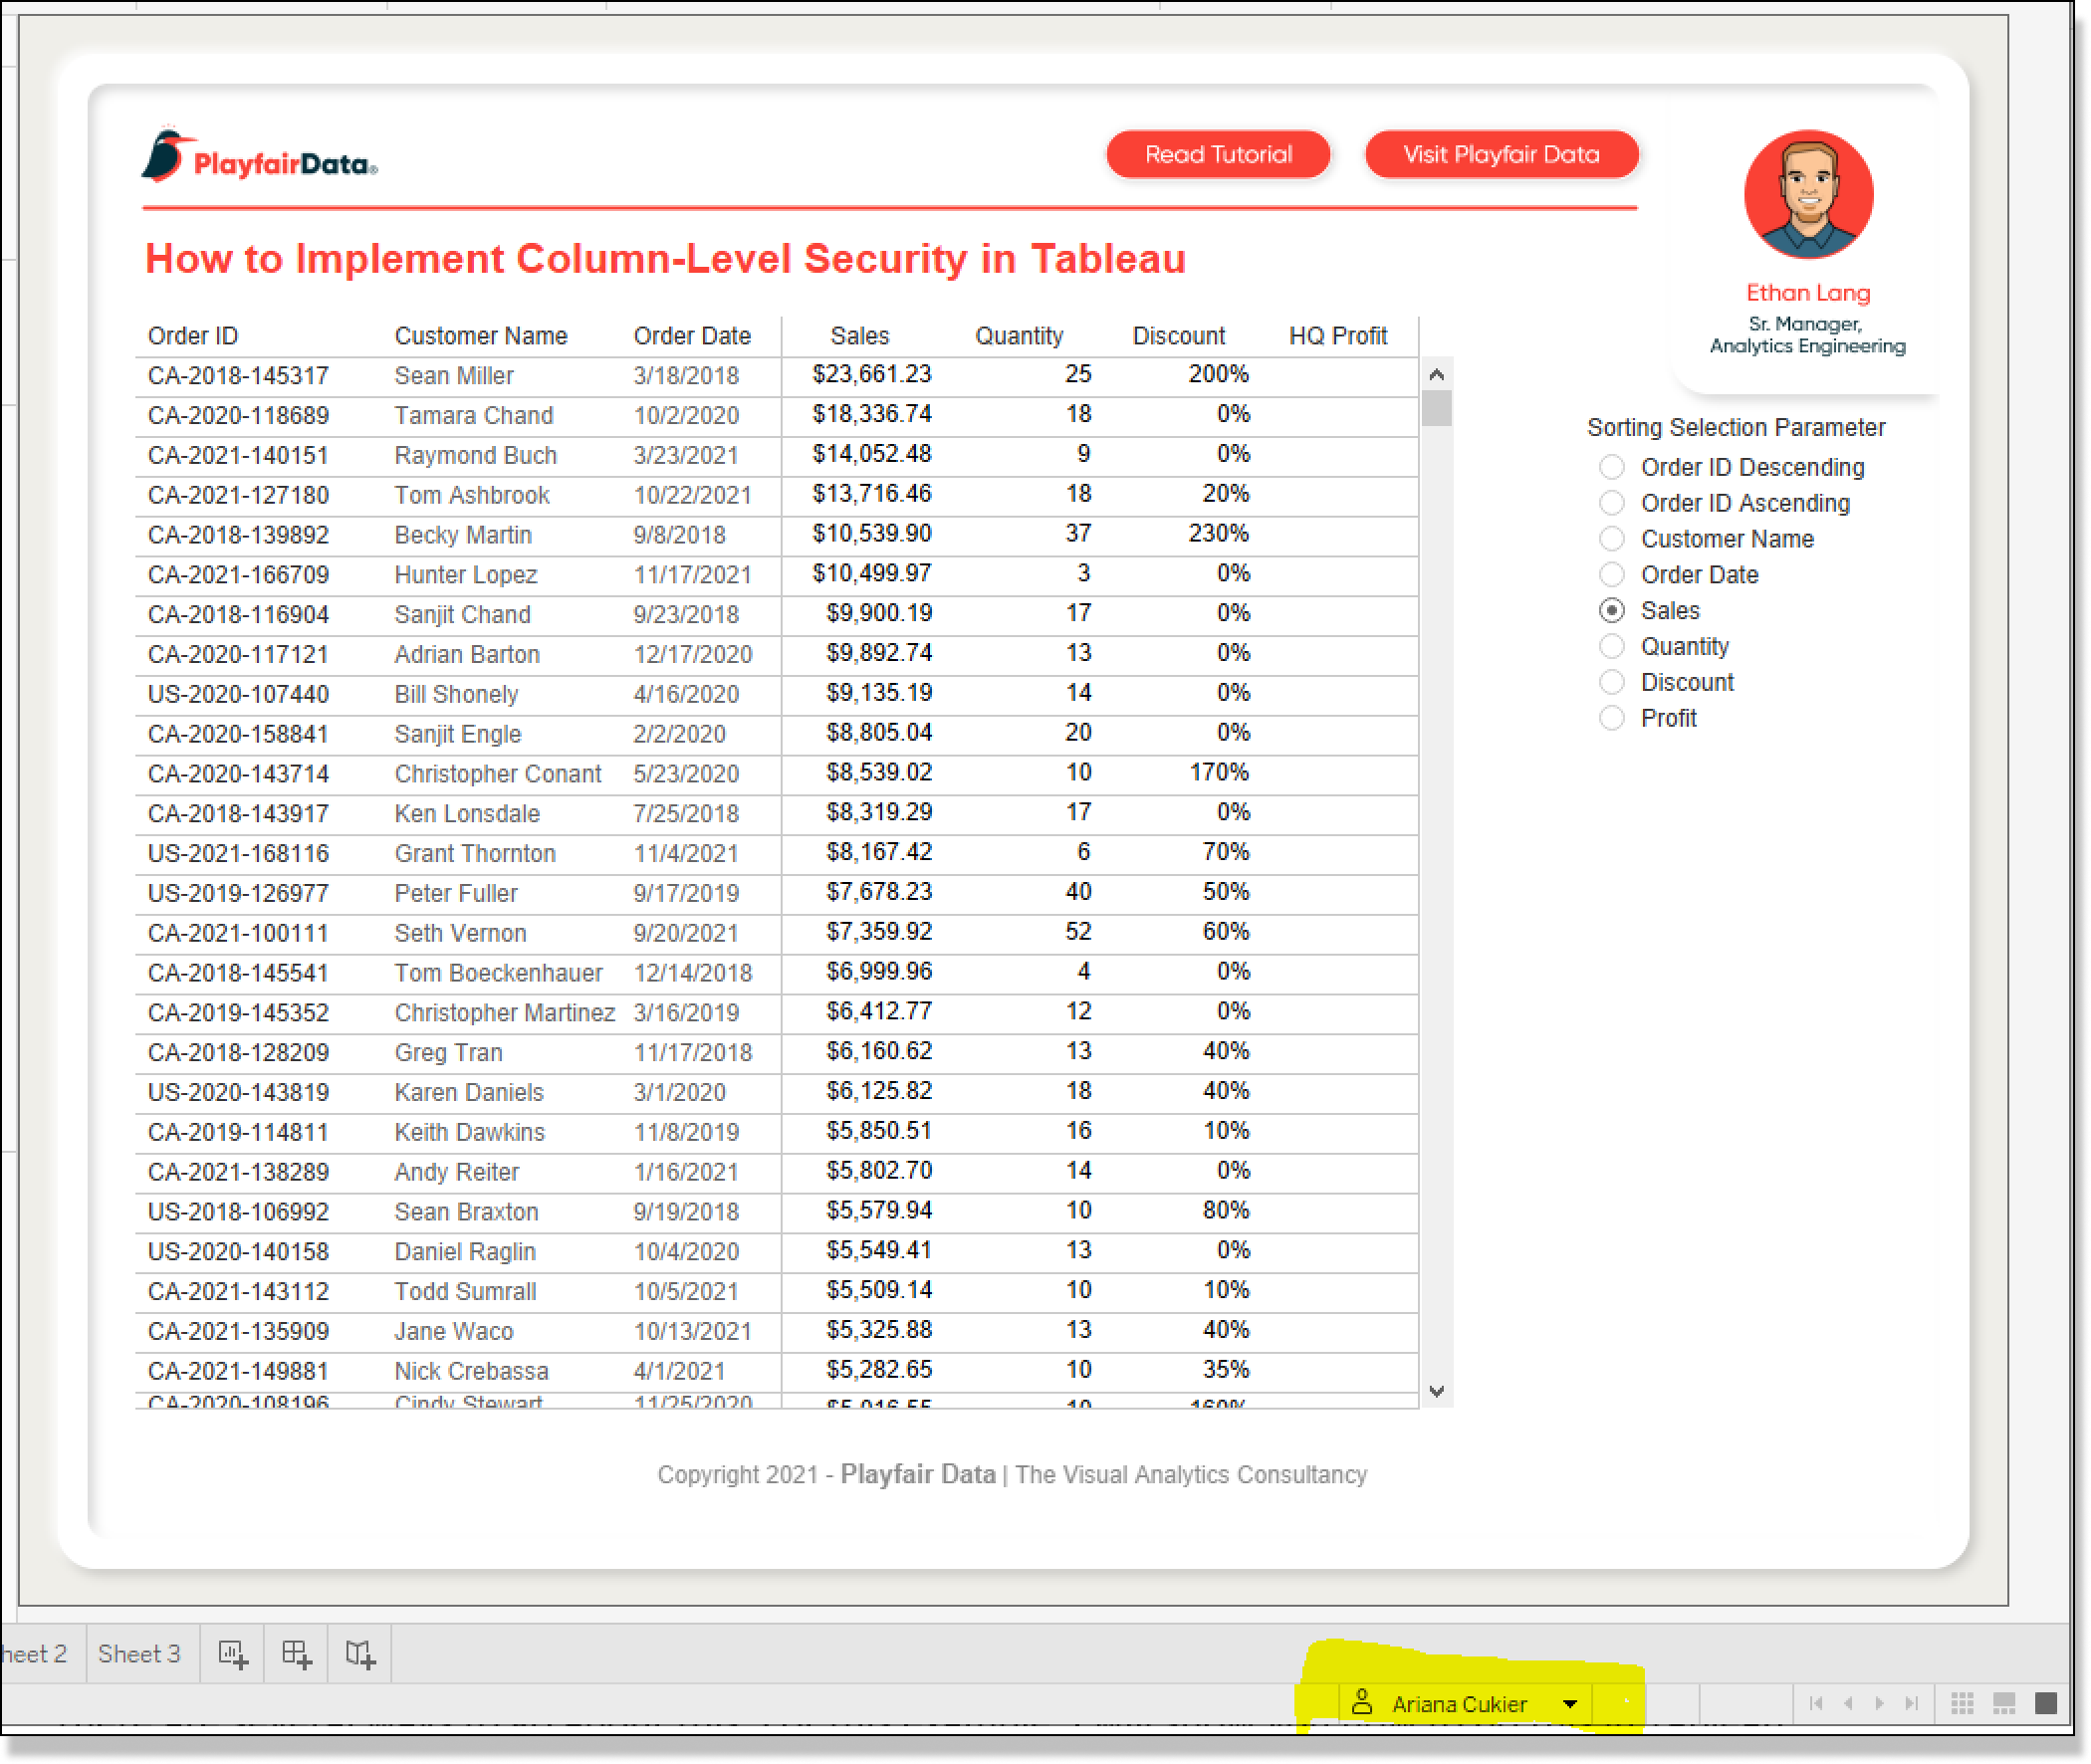
Looks like that is exactly what we are looking for. Before publishing this to Tableau Online or Tableau Server, you will need to hide the old profit value. This will secure it in the server environment so the user cannot see it in the raw data anymore.
Here are a few pros and cons of this technique.
Pros:
Extremely easy to implement – Using only a single calculated field, you can implement security in your workbook
Cons:
Not scalable – If you are working with multiple fields, workbooks, and groups, this tactic can be a little unwieldy and not easily scalable.
HQ Profit measure is still in the view – Because we are just making this value NULL, the measure name is still listed in our views. From a security point of view, it’s not critical, however, we may not want our users to know that we are limiting what they can see.
Pivoting your dataset in Tableau and implementing a user filter
The next method is to pivot your data and implement row-level security on a new dimension member. There are several ways to go about this. For this example, I will show you how to do this in Tableau Desktop from the Data Source tab. Just know that you could do this pivot in Excel, Alteryx, Tableau Prep, SQL, Python, etc.; or whatever you are most comfortable with.
After making a connection to data in Tableau Desktop, you can preview the data from the Data Source tab in the bottom left of the Authoring Interface.
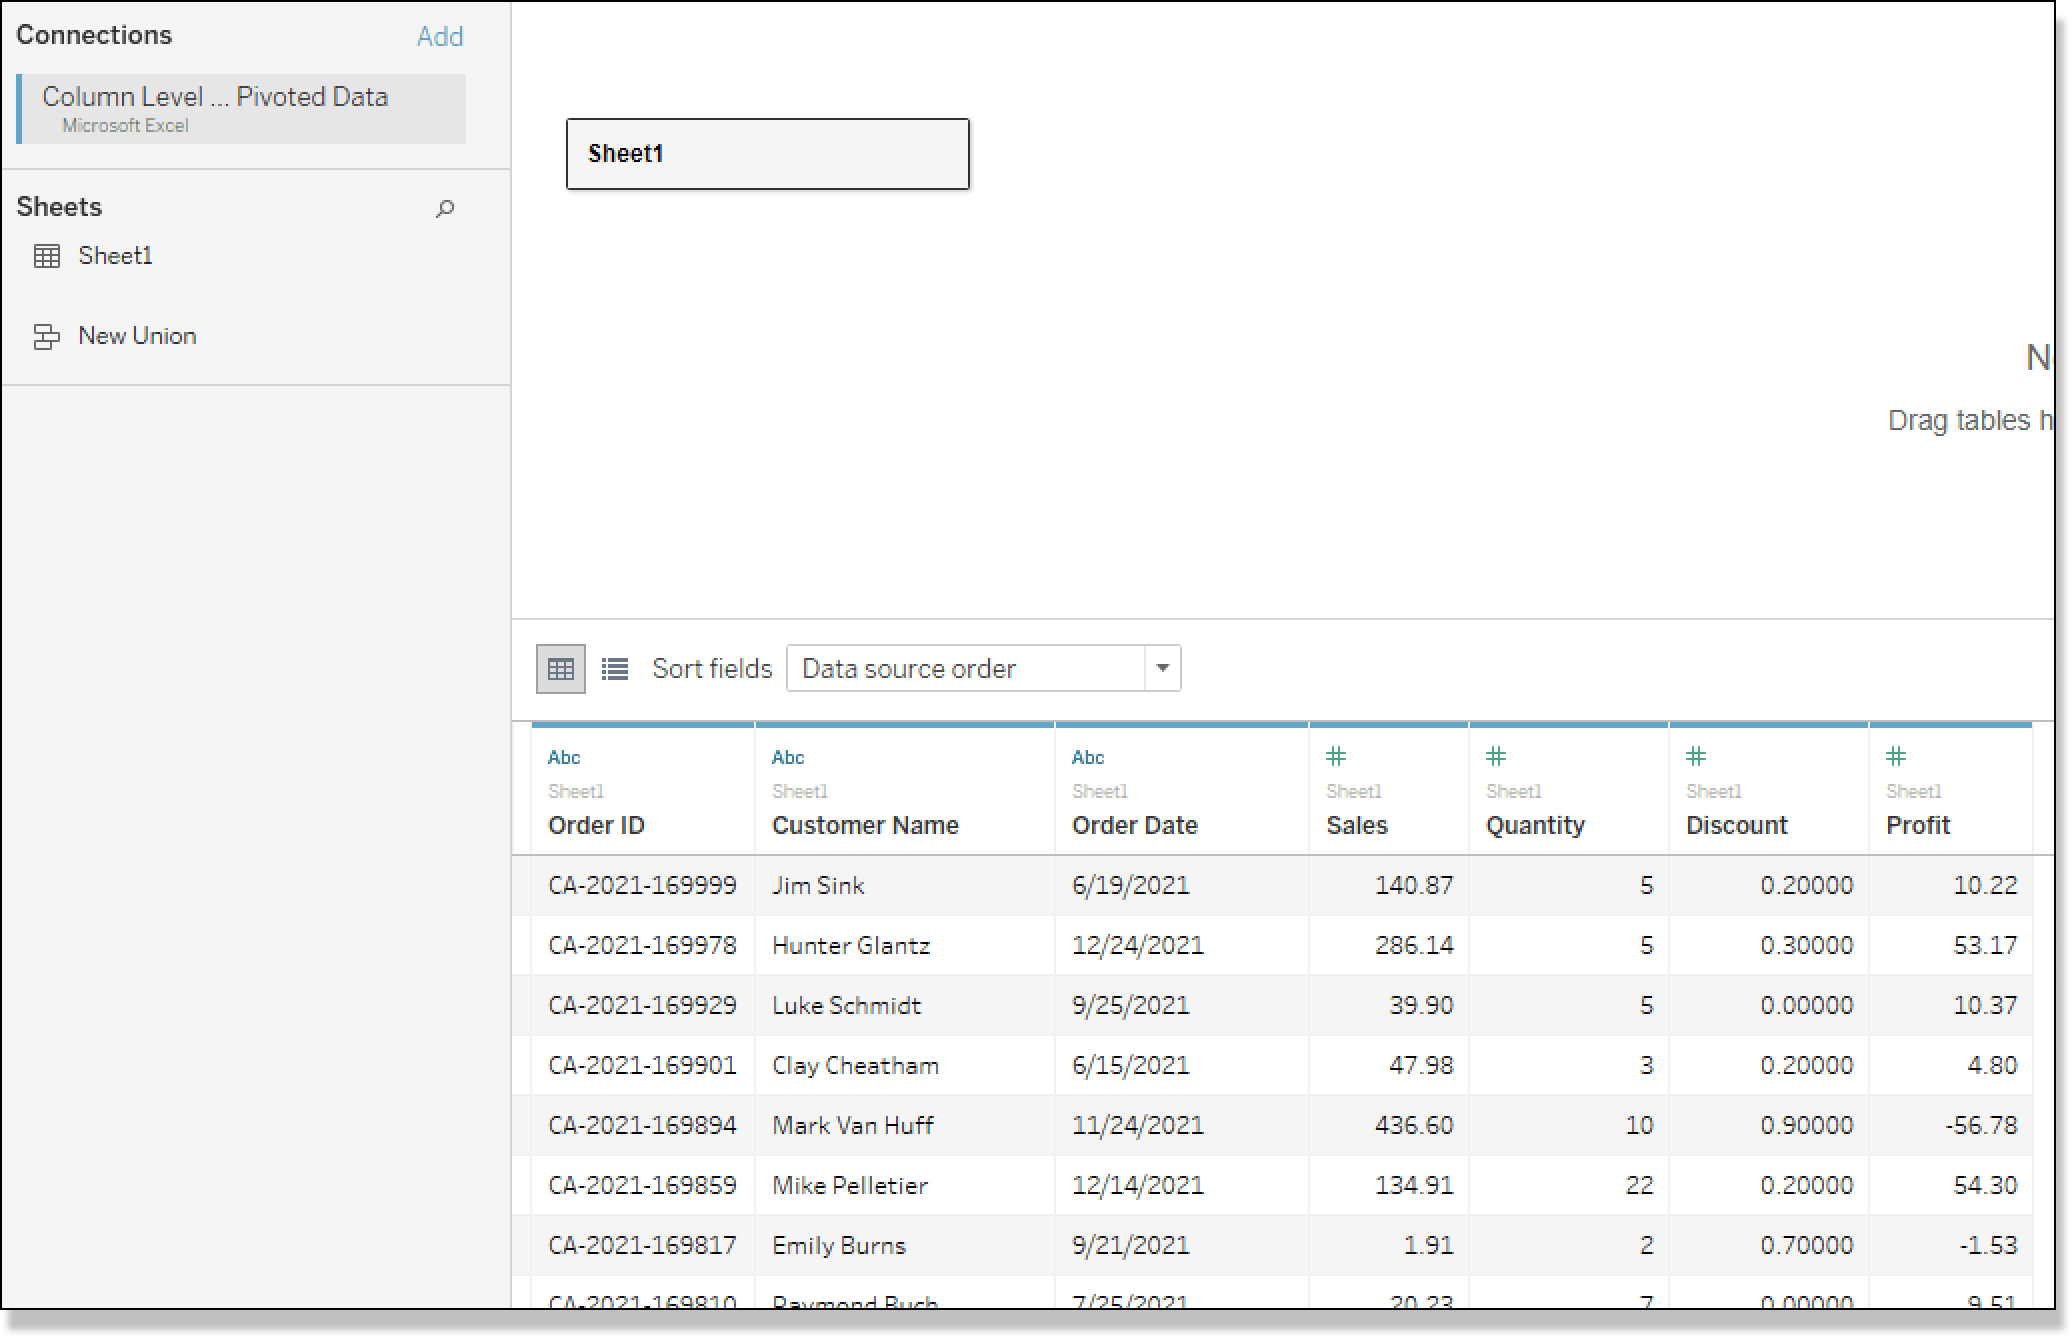
From this screen, I am going to hold CTRL on my keyboard and select Sales, Quantity, Discount, and Profit by left clicking on their column headers. The columns will highlight as I select them and with all four selected, I am going to hover over any of them, click the arrow that appears to the right of the column, and select Pivot.
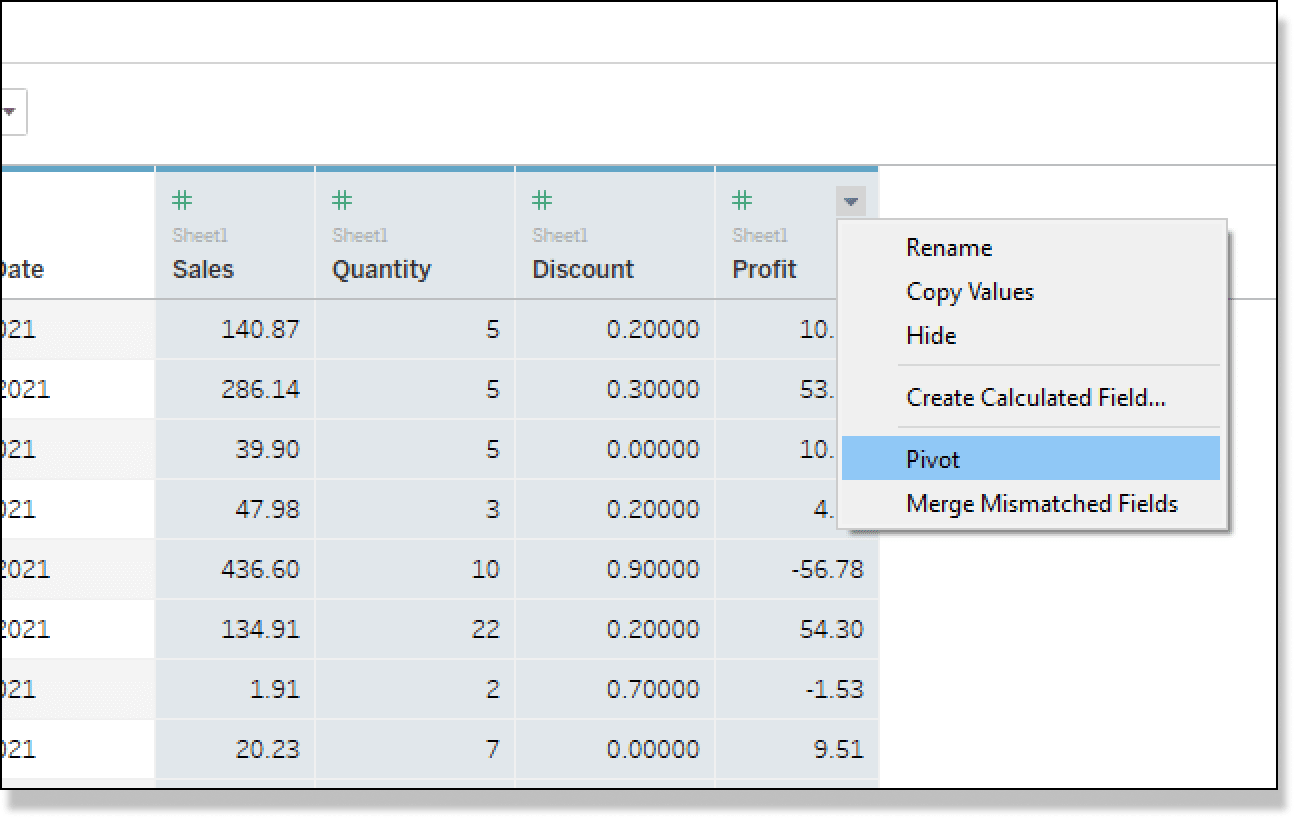
When I click Pivot, you will see that the structure of my data changes. I now have two new columns called Pivot Field Names and Pivot Field Values.
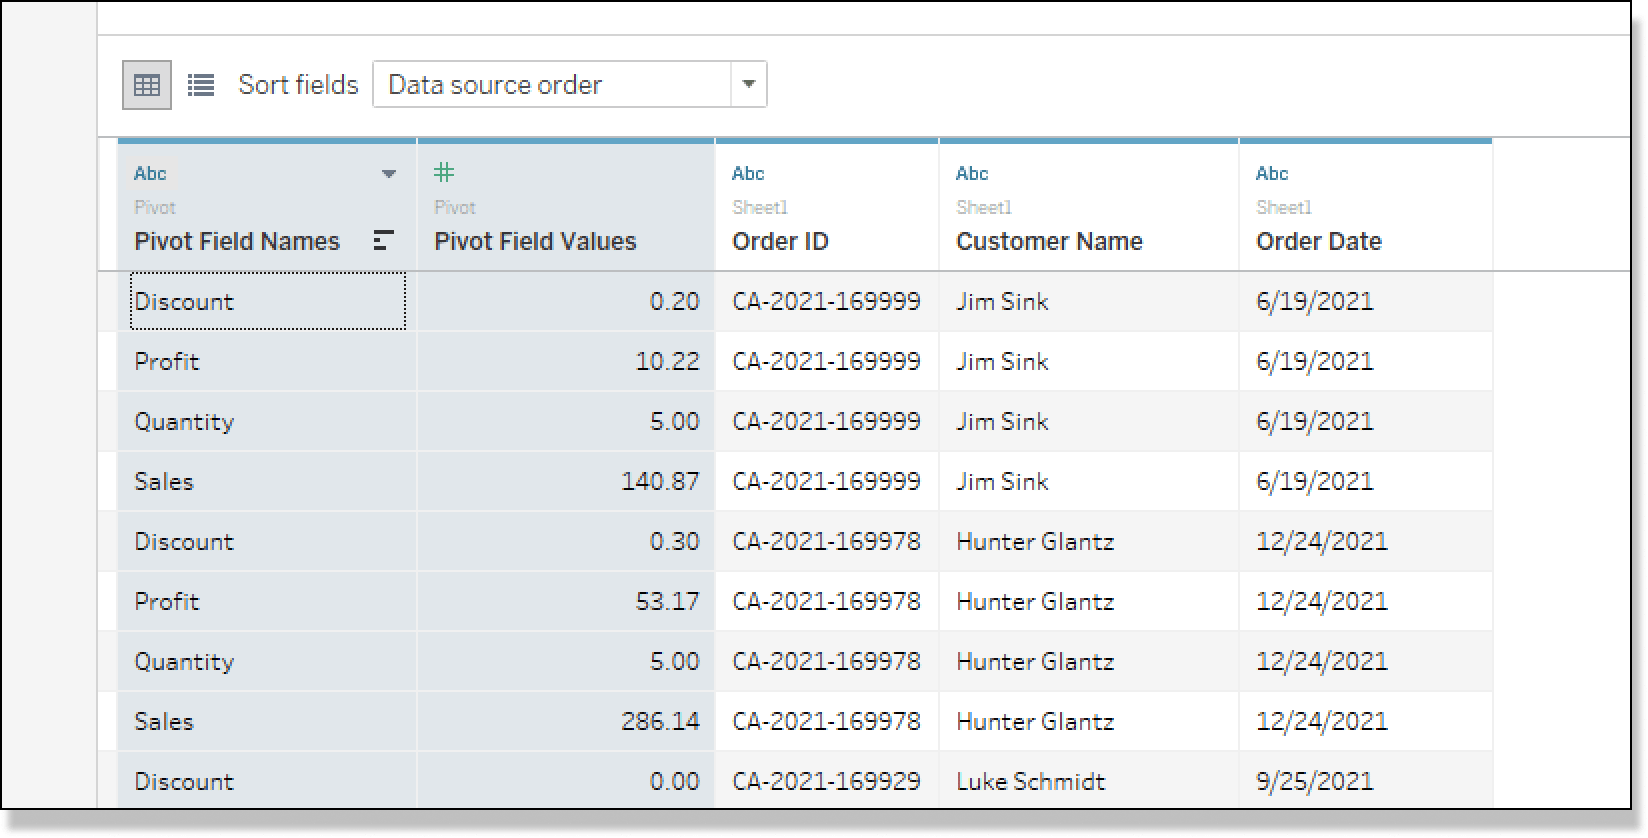
With this data structure, I now have a row for each dimension. This will allow us to create a user filter to limit the fields that the user would have access to using row-level security. Before we implement our user filter, let’s recreate our original chart.
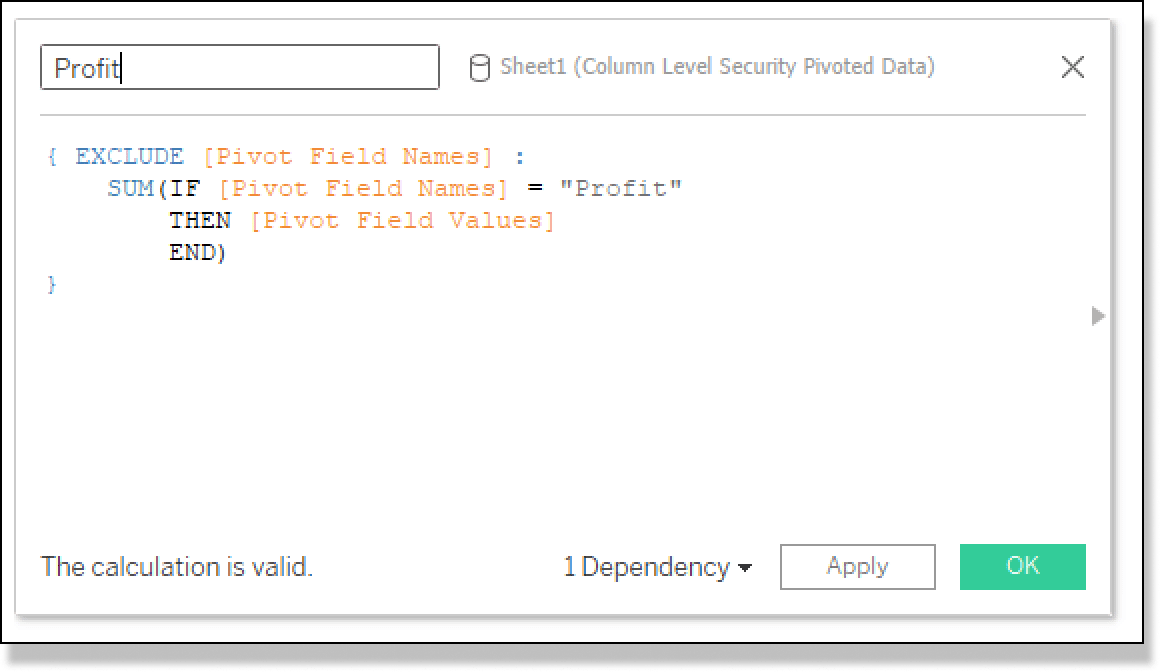
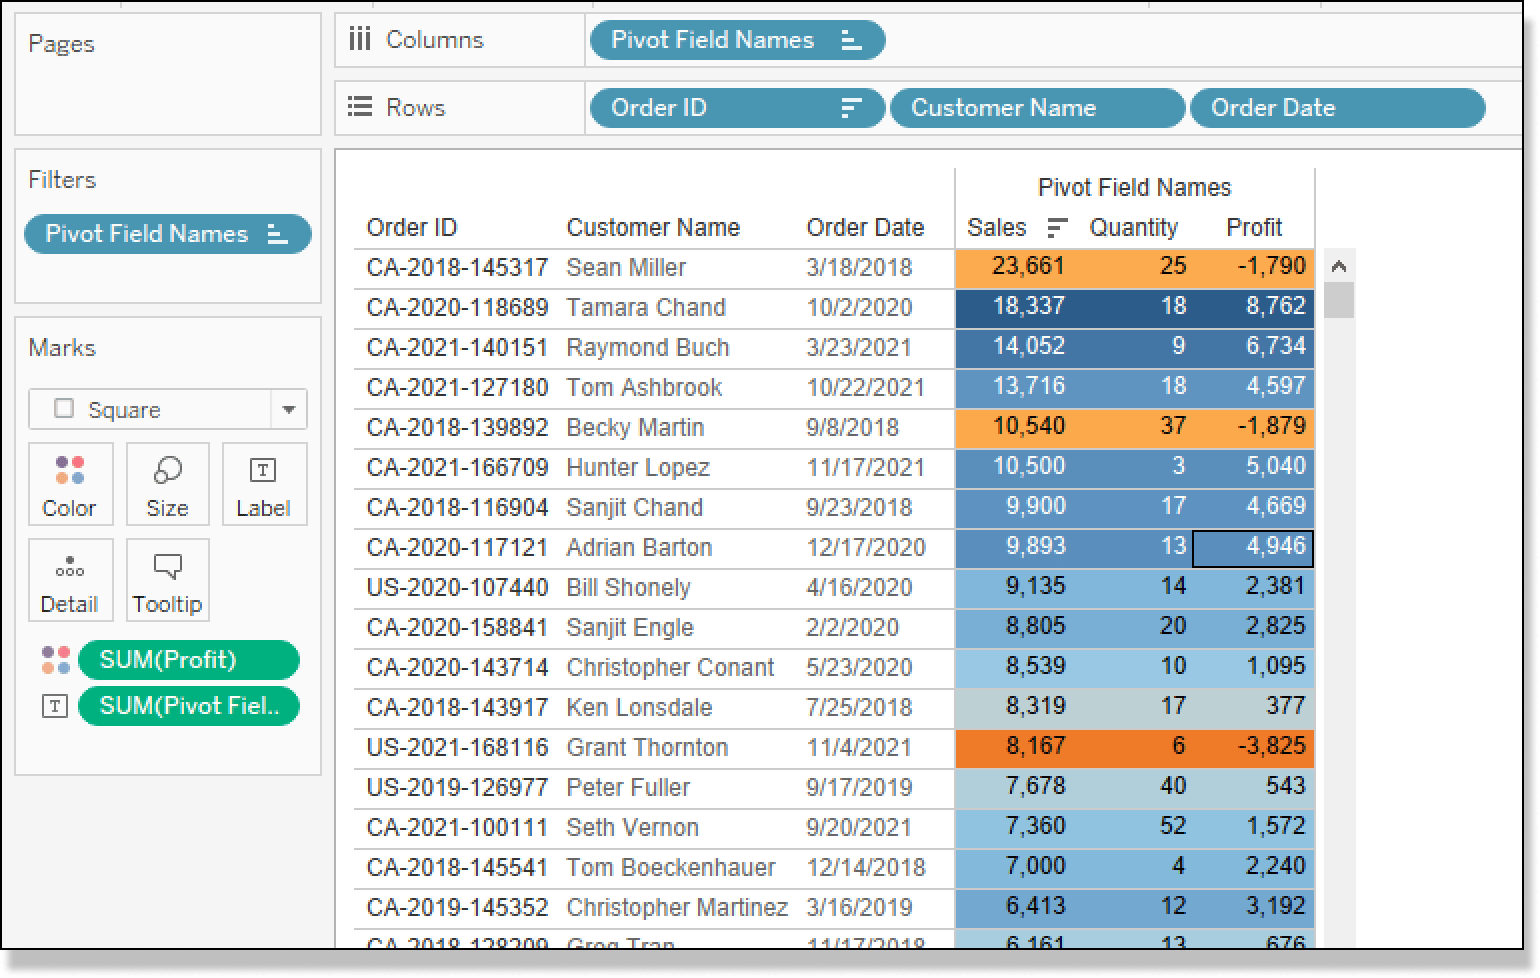
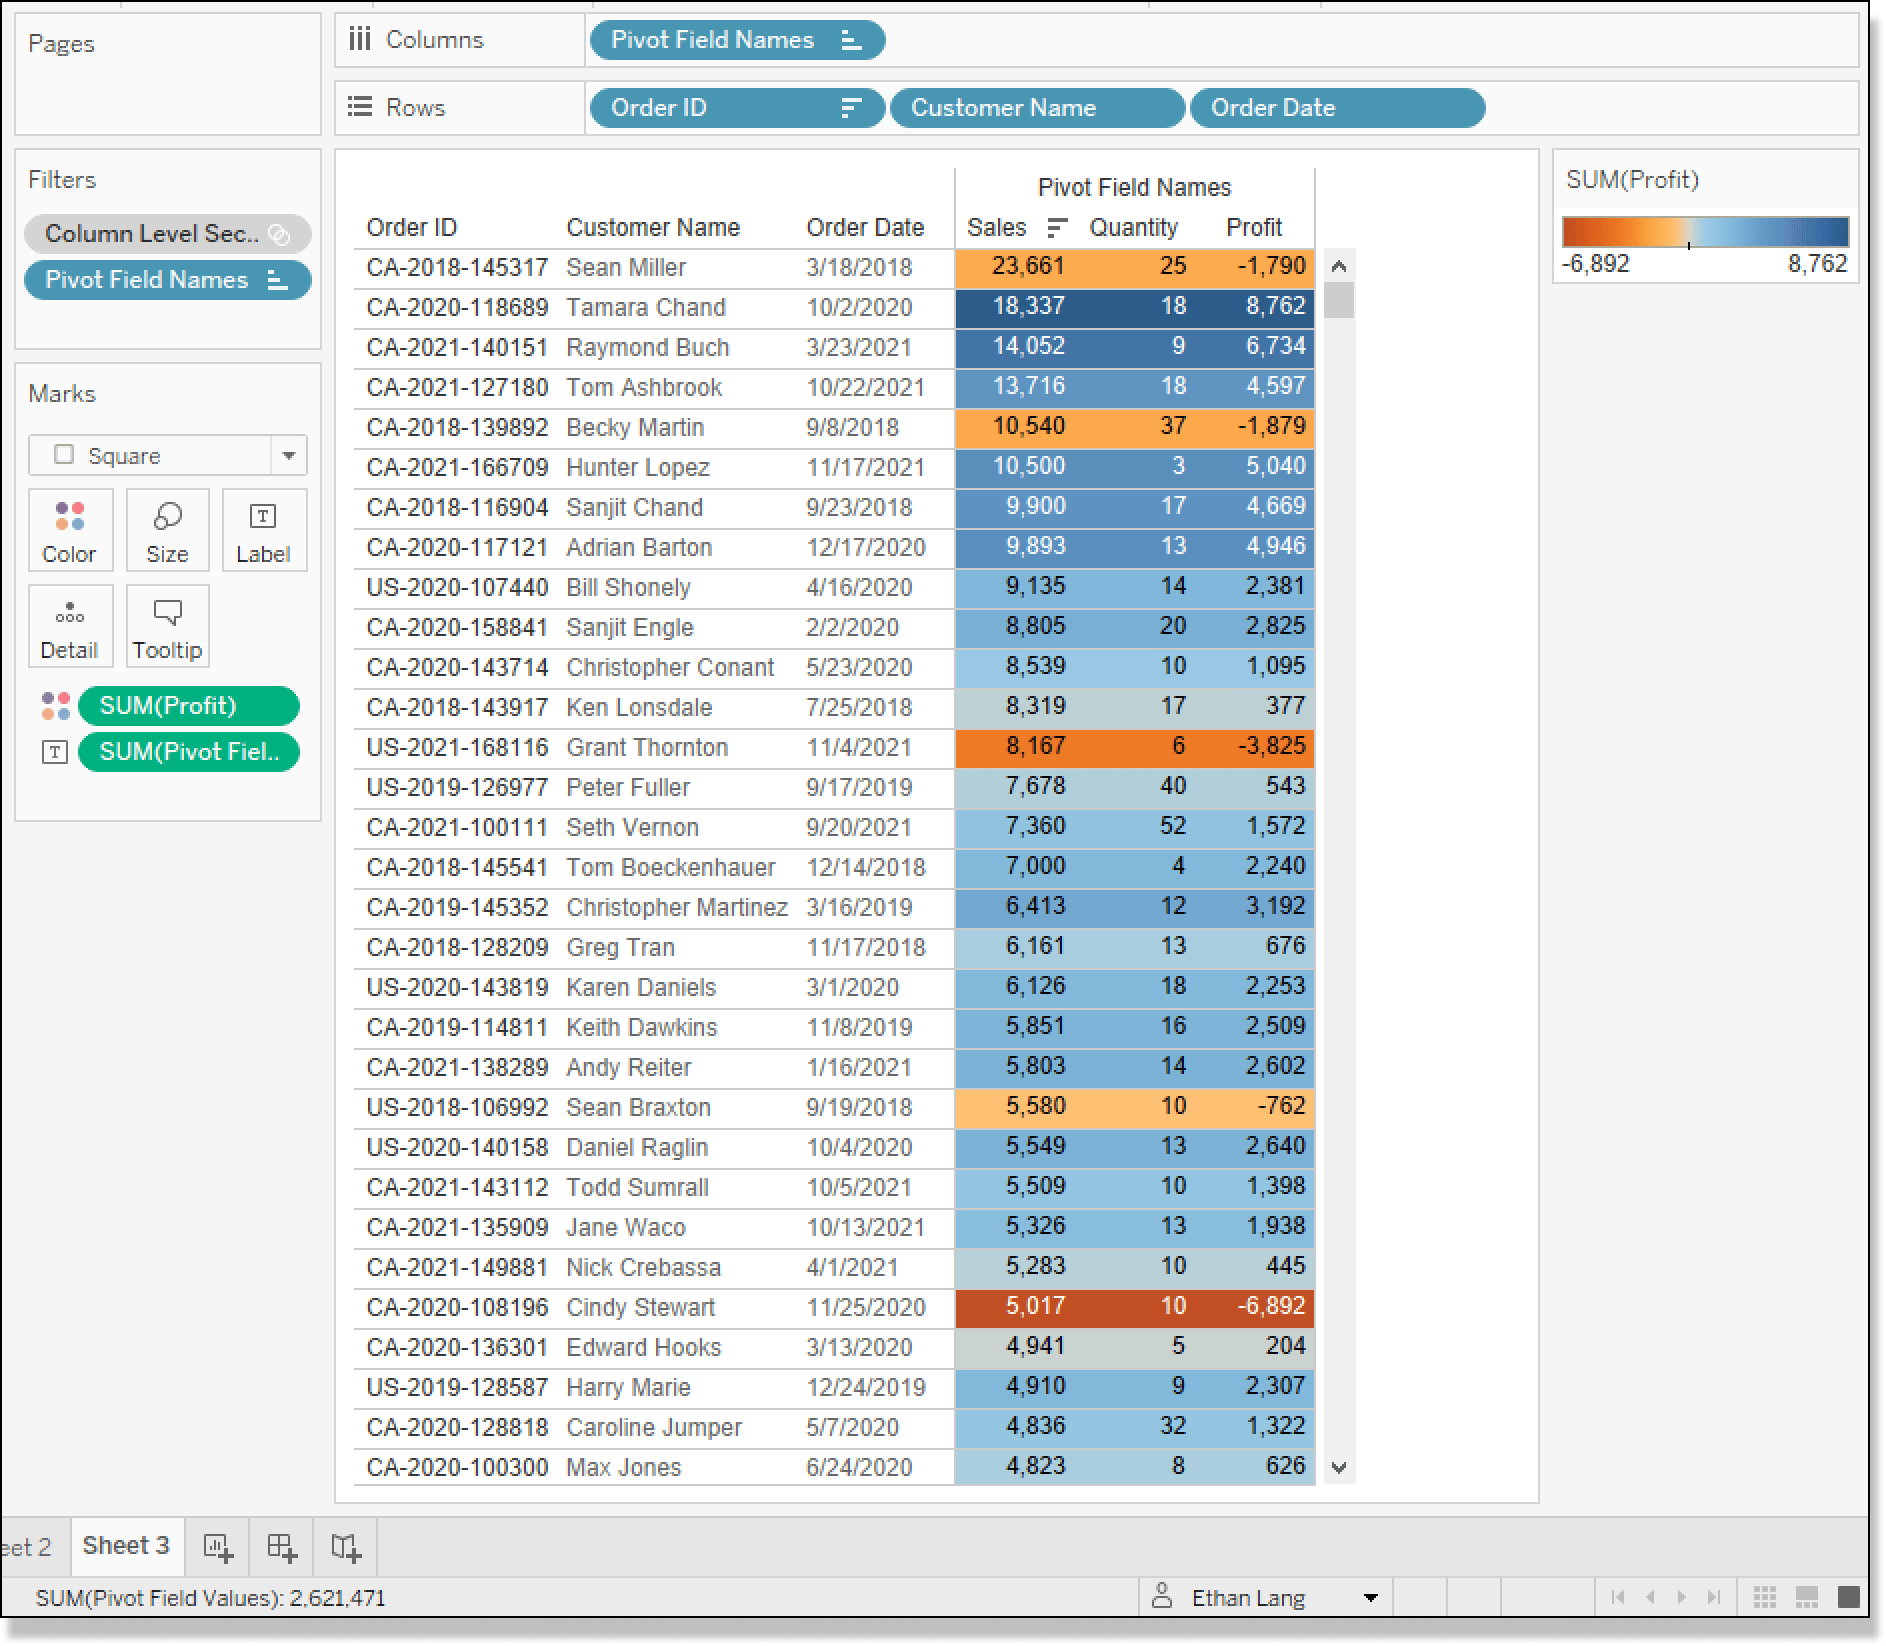
I will do this by creating a new sheet and dragging Order ID, Customer Name, and Order Date to the Rows shelf. Then drag Pivot Field Names to the Columns shelf and Pivot Field Values to the Label property of the Marks card. My original table was also colored by SUM of Profit. To get this same effect, I am going to create a new calculated field that isolates the profit numbers for each record. I will right-click any blank space in the Data pane and select Create then Calculated Field. I will title this new calculated field Profit and enter the following calculation.
{ EXCLUDE [Pivot Field Names] :SUM(IF [Pivot Field Names] = “Profit” THEN [Pivot Field Values] END)}
I will drag my new Profit calculation to the Color property of the Marks card and sort the table by Sales.
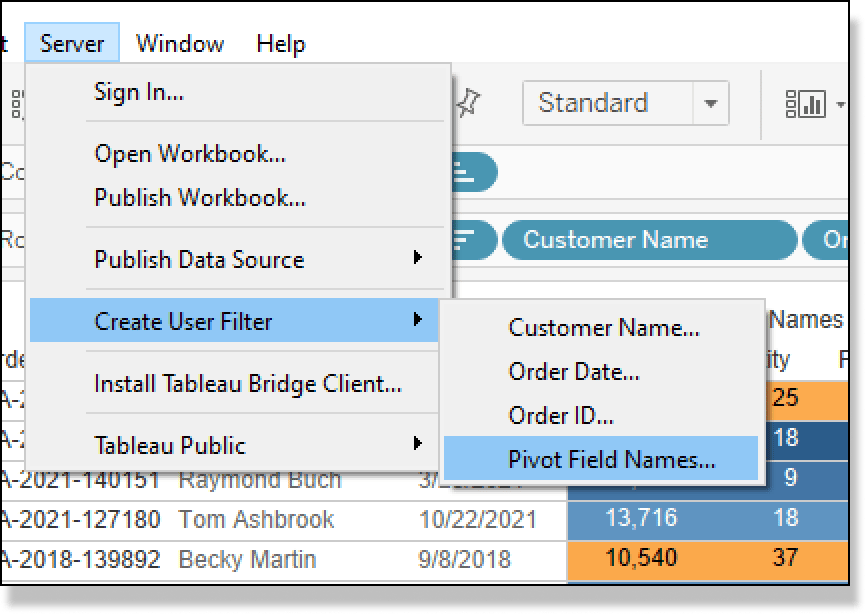
To implement row-level security, I need to sign into my Tableau Server or Tableau Online instance first. I will click Server from the top navigation, then Sign In, and follow the prompts. Once I am signed in, I will click Server from the top navigation, select Create User Filter, then select Pivot Field Names from the list of dimensions.
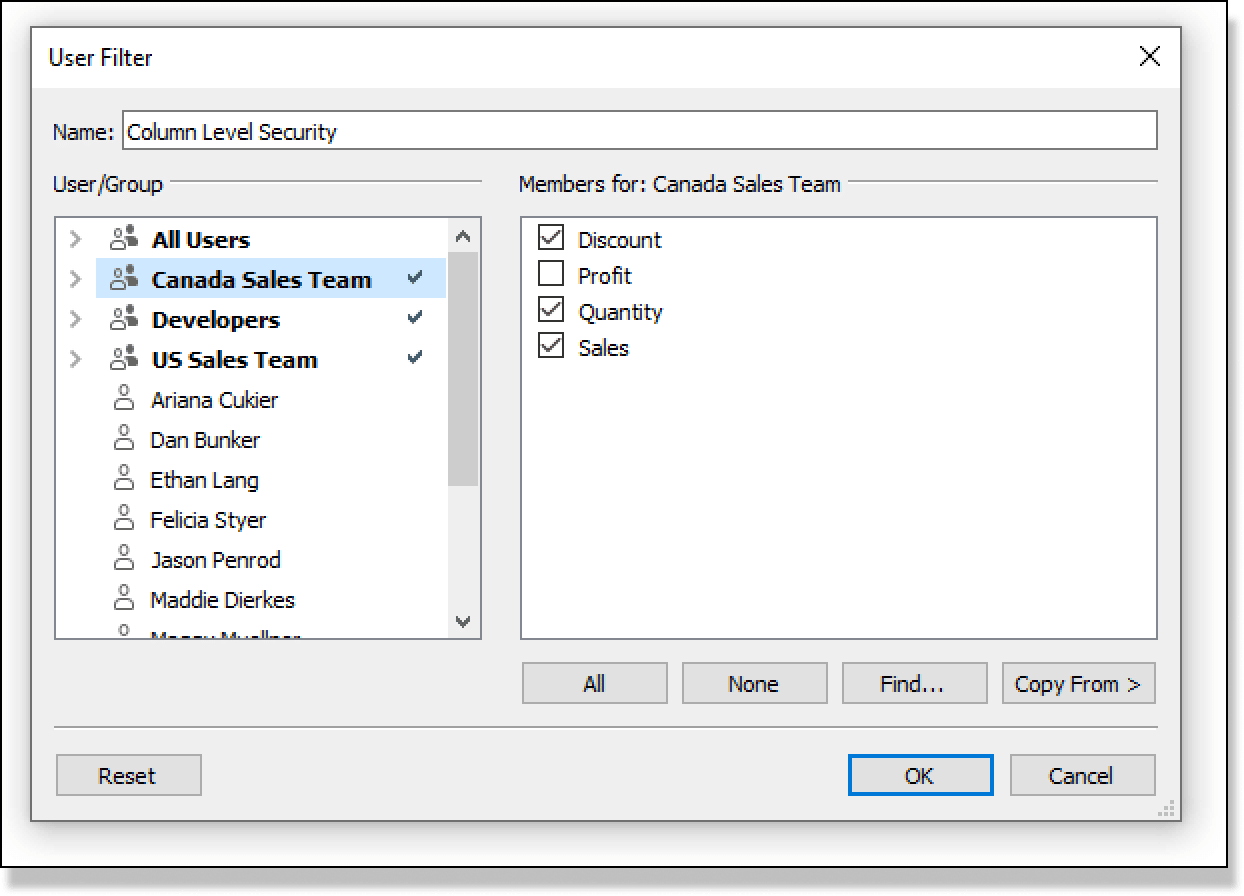
For this use case let’s suppose that I want to allow our sales team to see only the Sales data and no Profit data, while our Developer team can see it all. To do this, I will select the Canada Sales Team group on the left and select Sales, Discount, and Quantity from the right. I will assign the same settings to the US Sales Team group and for the Developers group, I will assign all four values.
I will drag our new Column Level Security user filter to the Filters shelf. At first nothing happens because I am in the Developers group.
However, if I switch over to Ariana, who is in our Canada Sales Team group, by selecting her name out of the list of users in the bottom right of the Authoring Interface, we will see Profit disappear.
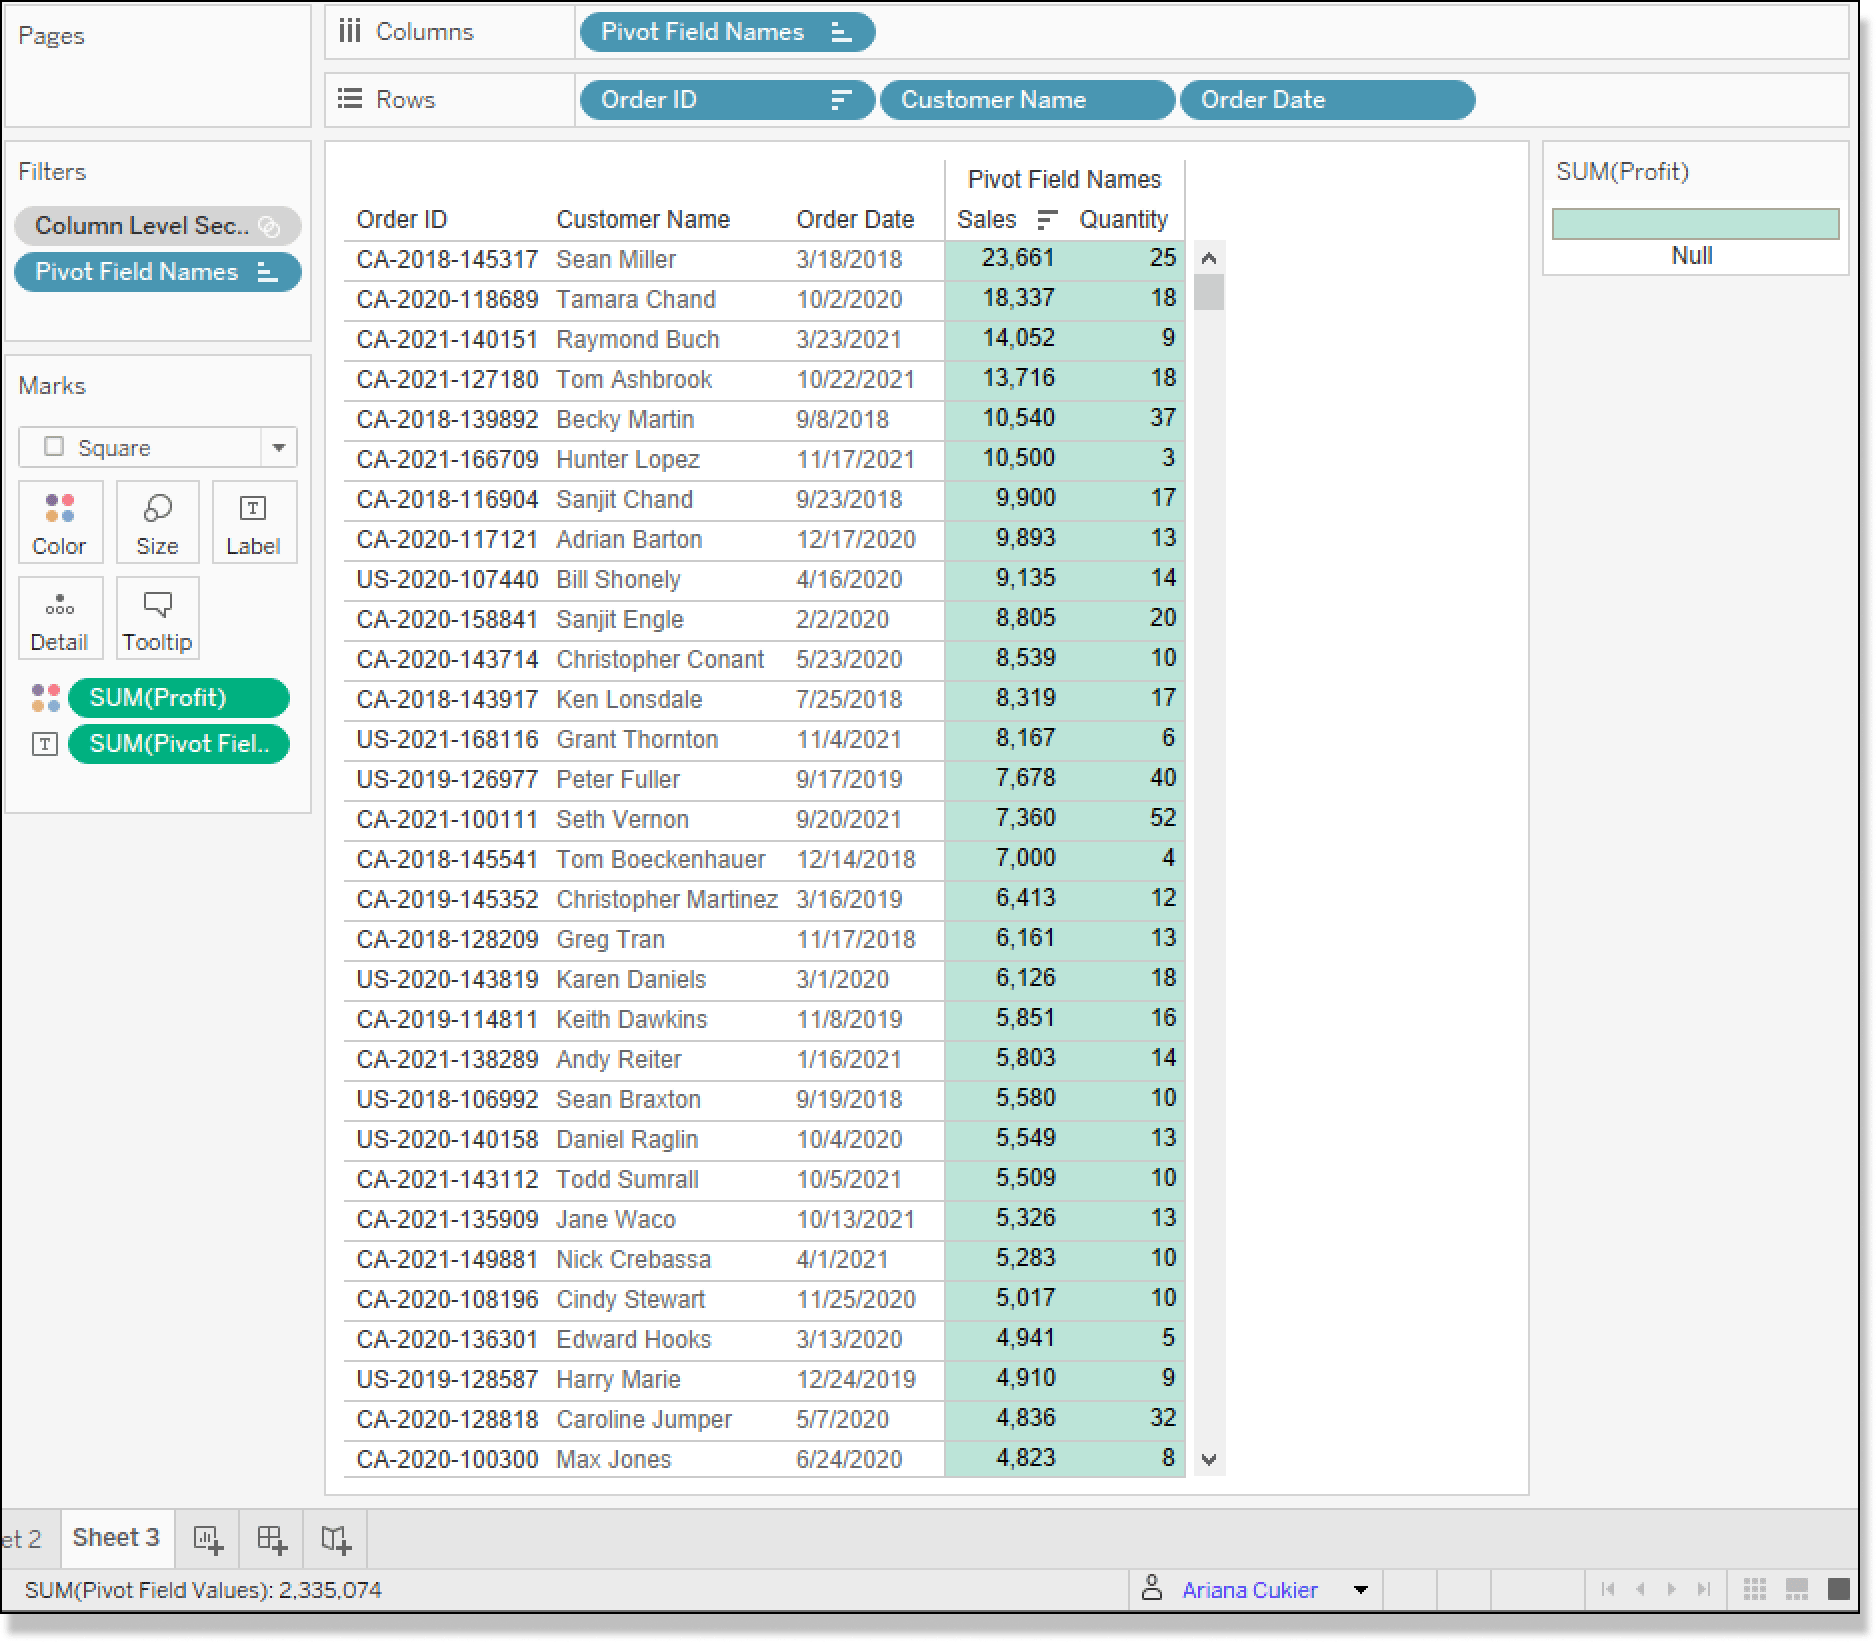
Not only did Profit disappear, but so did our coloring! You can see in the Color legend to the right that the profit values are now NULL.
Pros:
Easier to manage – By creating a user filter and managing the access from a centralized field, I can ensure the security is implemented correctly.
The Profit field name is filtered out – Unlike the previous example where profit values were NULL, but the measure named stayed in the view; this tactic filters out the column all-together. By implementing this method, we have reduced the need to create multiple dashboards or data sources.
Cons:
Created a larger data structure – By pivoting our data, we grew the number of rows needed. For this example, we had four columns and 5,009 rows originally. By pivoting the data on those four columns, we added four times as many rows, so the 5,009 grew to 20,036. A small price to pay for security; however, what if we had 20 million rows? By adding more rows to our data, we are going to see a negative impact on the performance of our dashboard.
Creating a separate data source and report
The absolute most secure way to ensure that the correct data is getting to those who need it is to create a separate data source and connect to it instead. As a Tableau Developer, I would use this tactic only as a last resort since it increases the number of data sources and reports to maintain.
![]()
How you would implement this depends on the type of data connection you have. For this reason, I won’t go into the tactics needed to implement this method, I will just talk through the strategy.
You would ultimately want to create a duplicated data source and remove the measures and dimensions you want to be secured from the raw data. Once those measures have been removed, you connect to it and publish your workbook with the new secure connection and assign permission to this accordingly.
Pros:
Most secure way – All in all, this is the most secure method to firewall certain measures from a group of users.
Cons:
Creates more maintenance – This is going to create a lot more work for your Developers and Data Engineers. If there is an update needed to this dashboard, you will need to update them in both workbooks to keep them consistent.
I hope you enjoyed this two-part series on security.
Until Next Time,
Ethan Lang
Director, Analytics Engineering
[email protected]

Written By
Ethan Lang

Peer Review
Felicia Styer
Assoc. Director, Analytics Solutions

Peer Review
Alyssa Huff
Assoc. Director, Information Design
Related Content
How to Implement Row-Level Security in Tableau
When working with data, security is always top of mind within an organization. Most businesses spend a lot of time…
How to Pivot, Unpivot, and Double Pivot Data in Tableau Prep
One of the first topics I cover during my live training events is what I view as the single biggest…

Ryan Sleeper
Start on the right foot by properly preparing data for Tableau The single biggest barrier to Tableau adoption is properly…