How to Pivot, Unpivot, and Double Pivot Data in Tableau Prep

One of the first topics I cover during my live training events is what I view as the single biggest barrier to Tableau adoption: connecting to a data source that was structured to be human-friendly in Excel. These traditional reports often have dates in the column headers, measures in the rows instead of the columns, and subtotals, among other potential pitfalls. When used as a data connection, all these aspects of the data layout can be problematic for how Tableau interprets the data source and prevents you from easily exploring the data as Tableau was designed to do. That’s why I was so excited to see that a new feature in Tableau Prep version 2019.1 is the ability to pivot rows to columns – or unpivot the fields. You have been able to pivot columns to rows for a long time in both Tableau Desktop and Tableau Prep, but now it is even easier to quickly restructure an existing Excel report so you can start exploring it in Tableau right away. As long as you are a Tableau Desktop user with a Tableau Creator license, you can install Tableau Prep and do this yourself!
![]()
This post uses the Rotten Tomatoes data source used to create my BLOCKBUSTER visualization to show you how to pivot columns to rows (pivot), rows to columns (unpivot), or both, in Tableau Prep 2019.1 or later.
Using Tableau Prep to shape, combine, and clean data
By the end of this post, you will be able to recreate this flow in Tableau Prep that pivots some columns to rows, then some rows to columns:
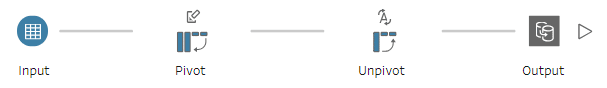
This flow was needed to prepare the data source to create my recent BLOCKBUSTER visualization. Tableau Prep was used to shape, combine, and clean 50 different data sources into one consolidated data connection!

The visualization required a critical data source from Rotten Tomatoes that was used to create the the scatter plot, Critics Score callout, and Audience Score callout. There was just one problem: the data source contained the measures in rows going down the first column, and all of the movie titles were going left to right in the column headers. Here’s how some of the underlying data looks for the highest grossing actor of all time, Samuel L. Jackson.
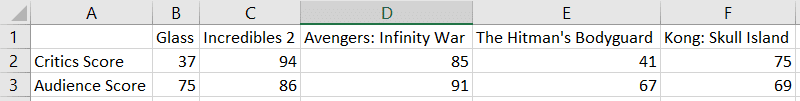
With the data in this format, Tableau will interpret Column A as a dimension called F1 (because it’s not named), and the remaining columns as measures. That’s one measure for each of the 108 movies Samuel L. Jackson has appeared in – ouch! Let’s clean this up using Tableau Prep so we have one dimension called Movie Title, a measure for Critics Score, and a measure for Audience Score. Our three fields should be in the column headers with one record per row containing the movie title along with their two scores.
Continue reading with a free account, or login.
Unlock this tutorial and hundreds of other free visual analytics resources from our expert team.
Already have an account? Sign In
By continuing, you agree to our Terms of Use and Privacy Policy.
How to pivot data in Tableau Prep
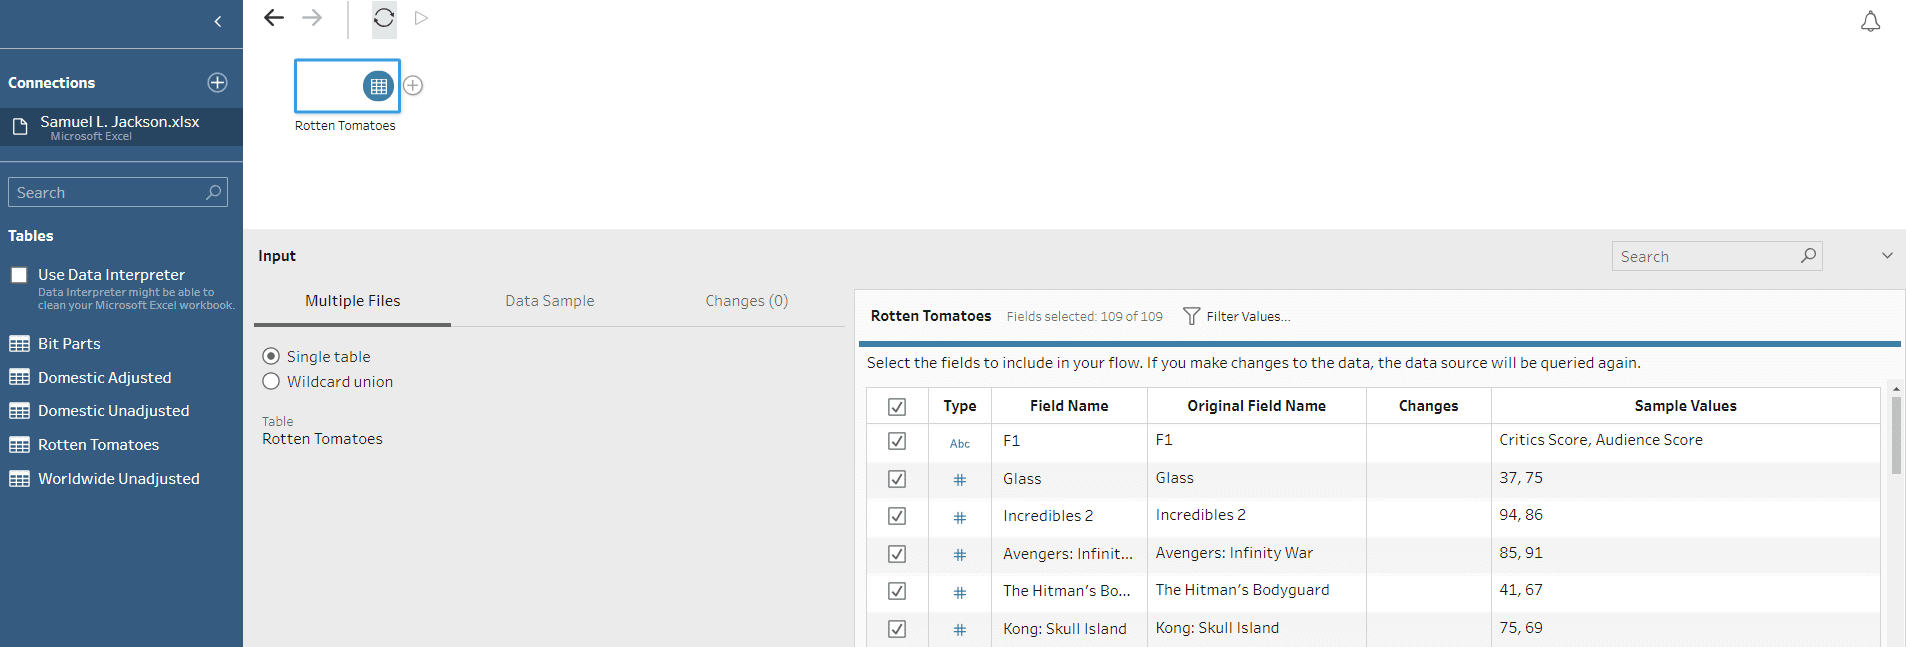
First, I will connect to the data source by opening Tableau Prep, clicking the green Connect to Data button, finding my Samuel L. Jackson Excel file, and dragging the Rotten Tomatoes table from the Connections pane to the Flow pane.
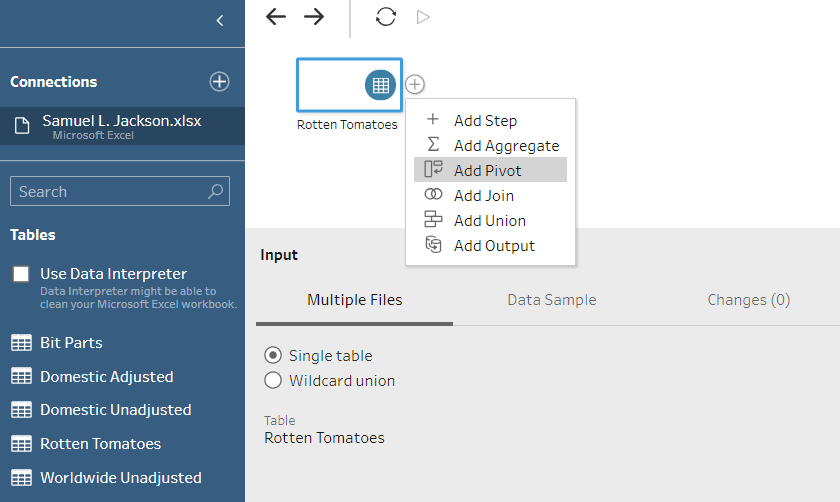
Next, click the plus sign next to the input and choose Add Pivot.
The first pivot we’ll do is a traditional pivot where we convert the columns to rows. In this case, every column other than the first (the unnamed field for Critics Score and Audience Score) are columns that need to be pivoted. To do so, choose every column header that you want pivoted to rows, and drag them into the area that says “Pivoted Fields”.
In my case, I’ll choose every single field except for F1 which contains the Critics Score and Audience Score. When choosing multiple fields, you can use Control + Click to select additional fields one at a time or Shift + Click to select multiple fields at once. Since Samuel L. Jackson has so many movie titles to pivot, I’ll click the first title, navigate to the last title and hold the Shift key while clicking on it. This selects the first column header, the last column header, and everything in between. I’ll then find the column called F1 and click on it while holding the Control key to deselect it. My view looks like this after dragging all of these fields to “Pivoted Fields”:
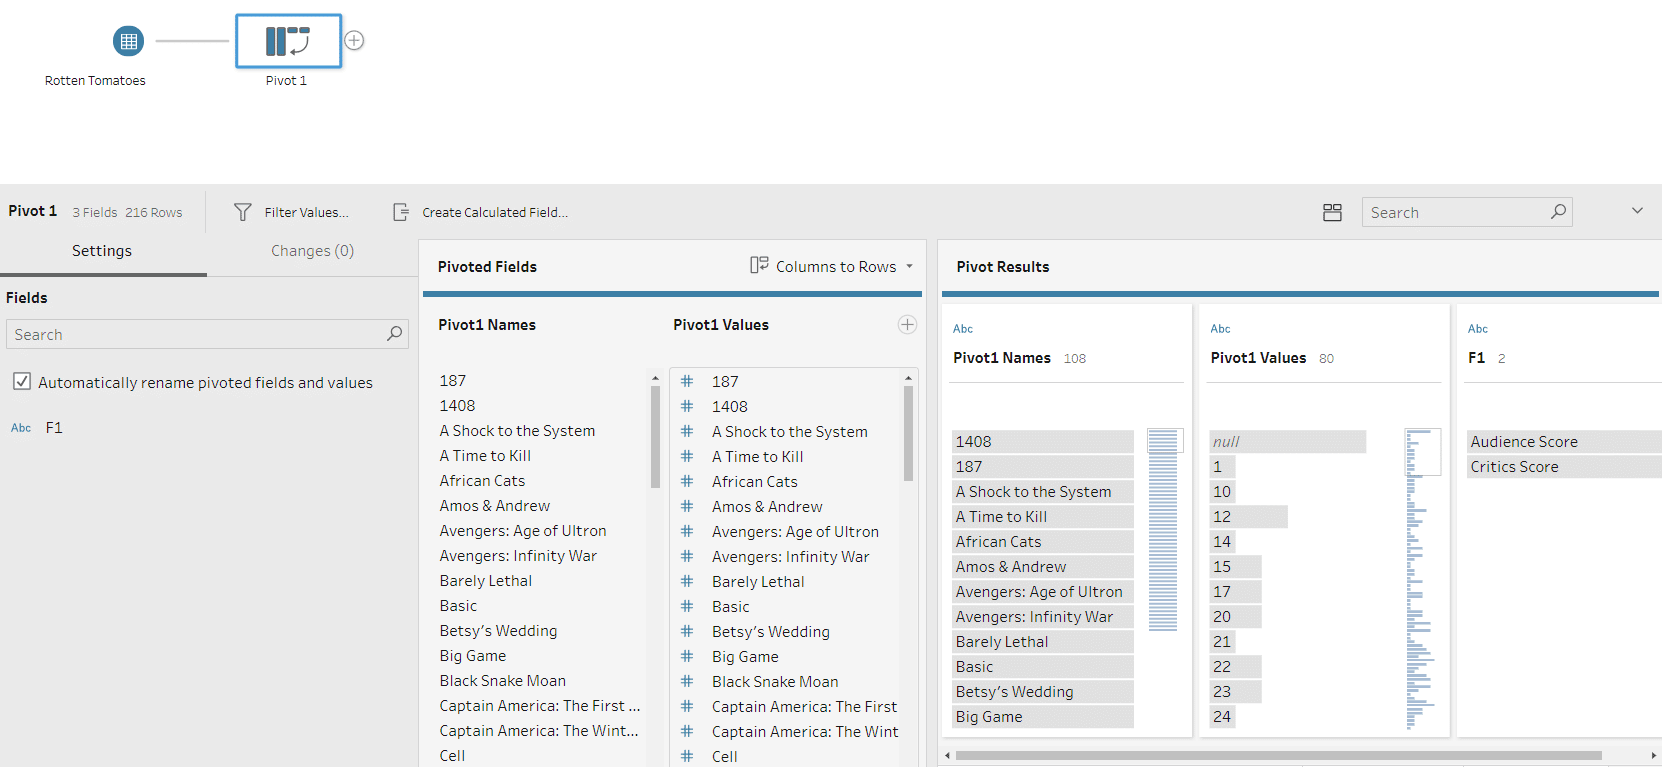
At this point, we’ve pivoted the column headers so each movie title becomes a record in rows. The field Pivot1 Names can be renamed to “Movie Title” by just double-clicking on the column title and typing over it. This is much better as we’ve made our table of data taller instead of wider, but each movie title has two rows: one for the Critics Score and one for the Audience Score.
How to unpivot data in Tableau Prep
To make this dataset even easier to work with, it would be best to unpivot the F1 field, or move our Critics Score and Audience Score fields from rows to columns. By doing this, we’ll replace the one measure currently in our data (Pivot1 Values) with separate measures for our Critics Score and Audience Score fields, respectively.
If you ever need to unpivot fields in addition to pivoting fields – or “double pivot” – add another Pivot step to your flow. This time, change the drop down next to where it says “Pivoted Fields” from the default “Columns to Rows” to “Rows to Columns”.
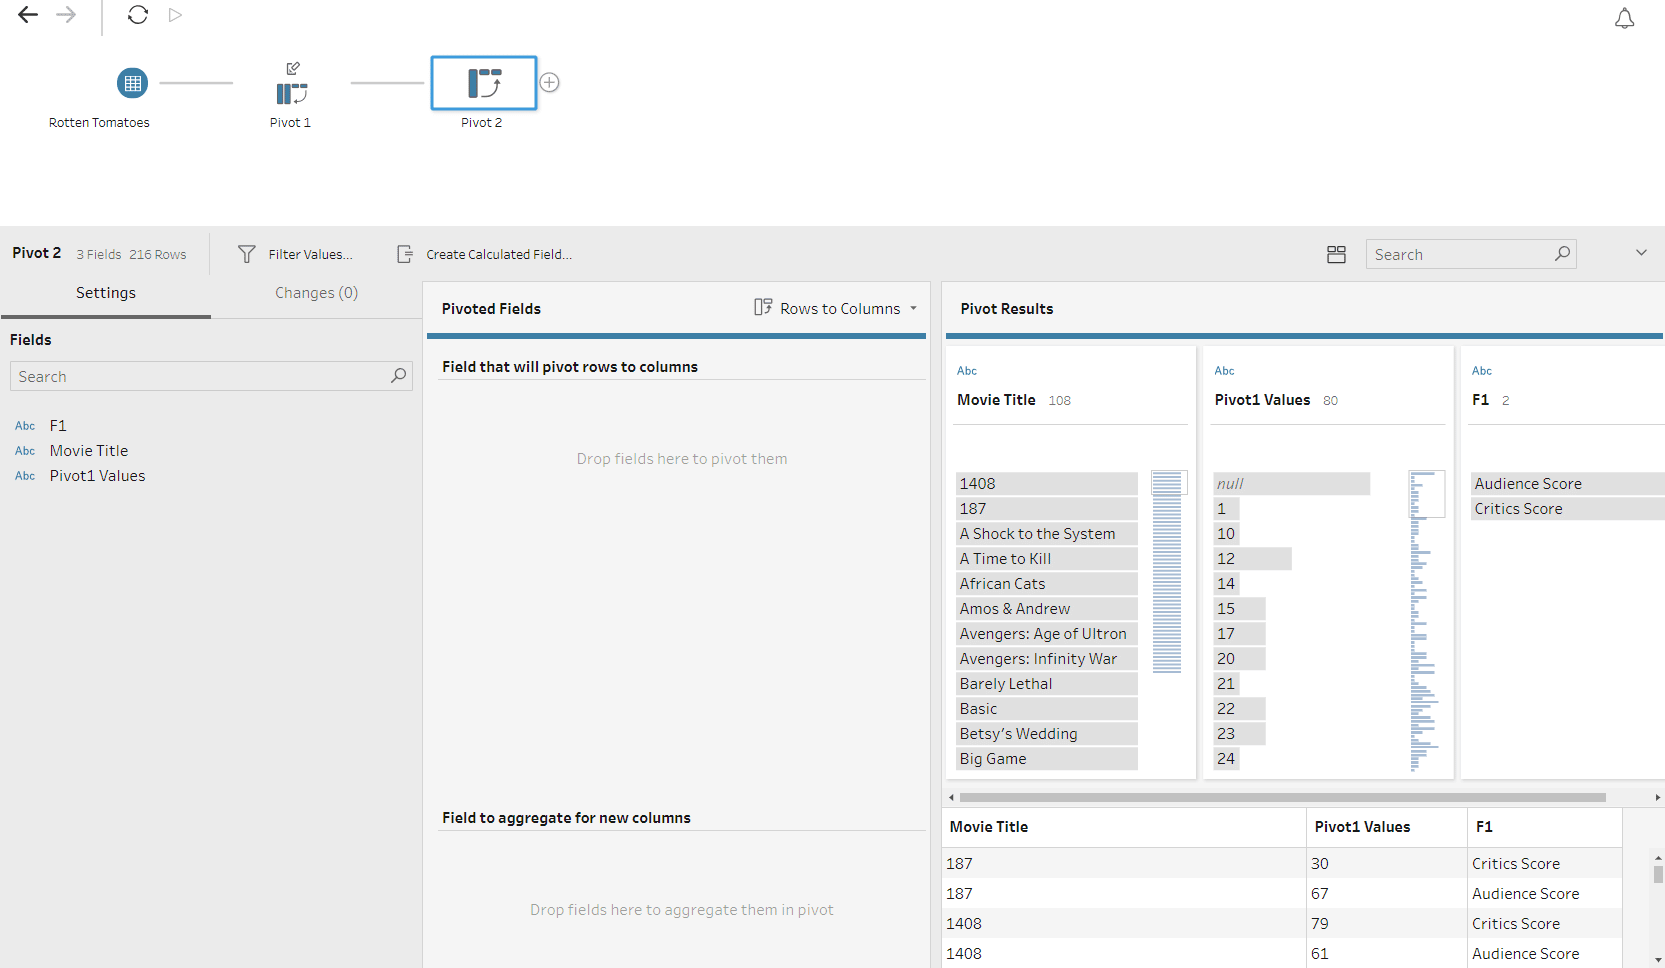
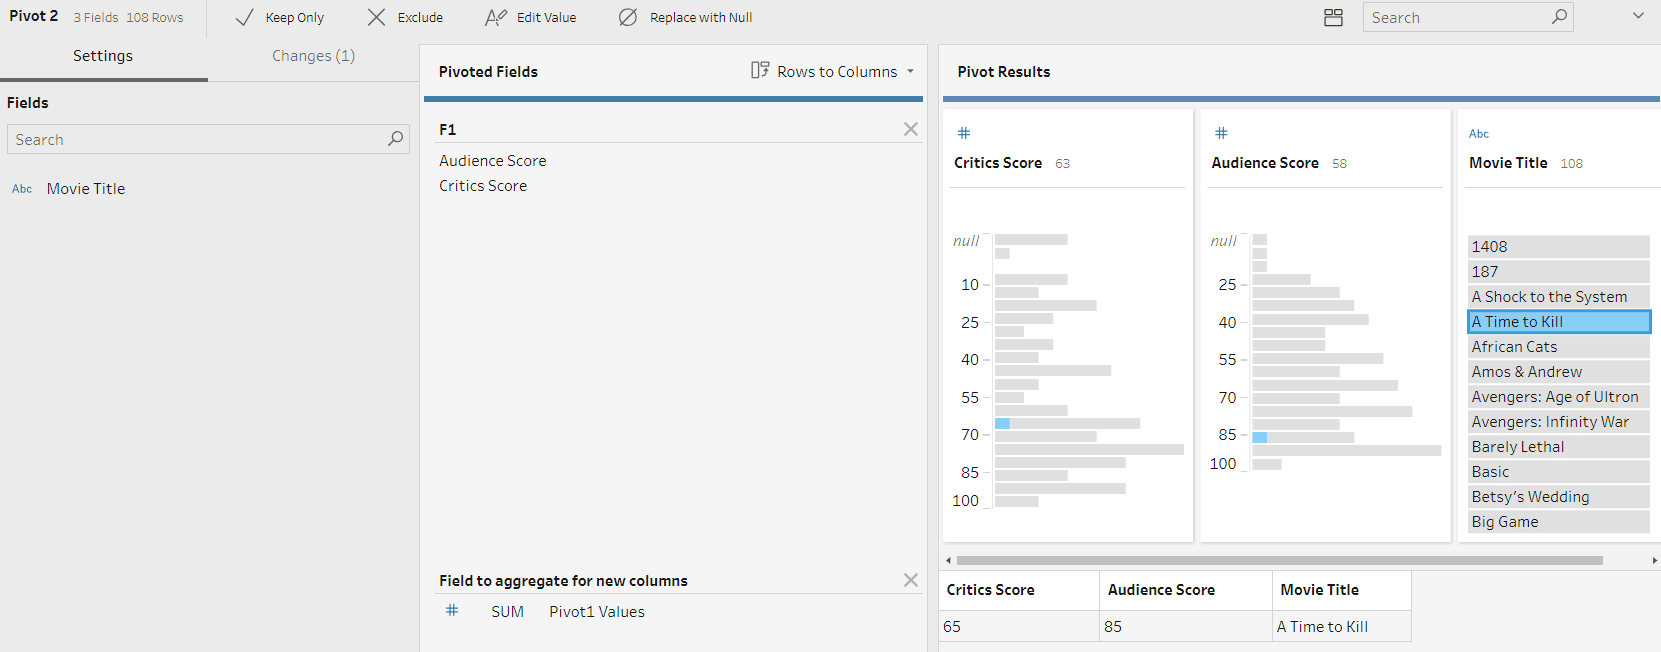
When unpivoting rows to columns, you have to choose not only which fields to pivot, but which fields to aggregate. In this case, we’re pivoting the F1 column which contains Critics Score and Audience Score, and we’re aggregating Pivot1 Values (the scores).
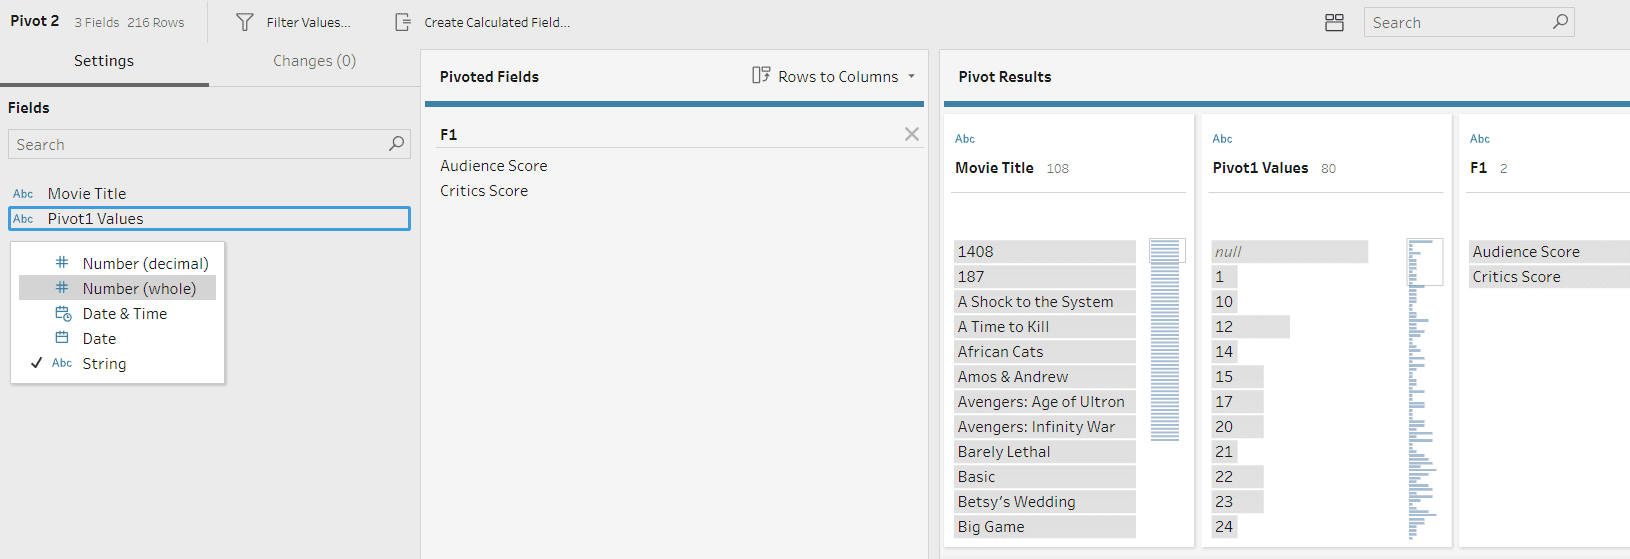
Some of Samuel L. Jackson’s movies do not have a Critics Score or Audience Score on Rotten Tomatoes so the first entry is NULL. By default, Tableau interprets fields with a null value in the first row as having a data type of String. This can be problematic when trying to aggregate numbers, so for best results, I’ll change the data type of the Pivot1 Values from String to Number by simply clicking on its blue data type icon.
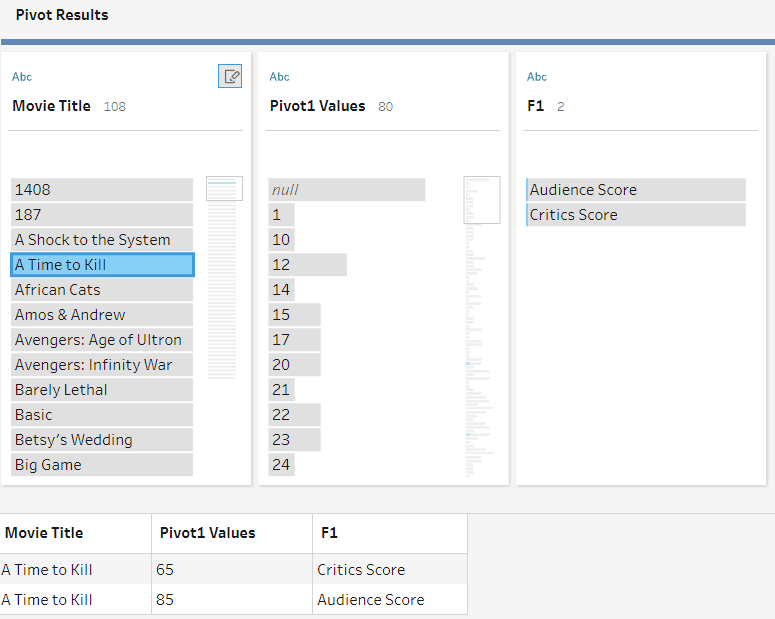
After changing the data type from String to Number (whole) and adding the Pivot1 Values to “Field to aggregate for new columns”, my Pivot step looks like this. I’ve highlighted a movie to show you there is now one record per movie containing its title as a dimension, then separate measures for the Critics Score and Audience Score.
![]()
Finalize the data with an Output step
We’re now ready to finalize the flow by adding an Output step and exporting the pivoted version of the data for use with Tableau Desktop.
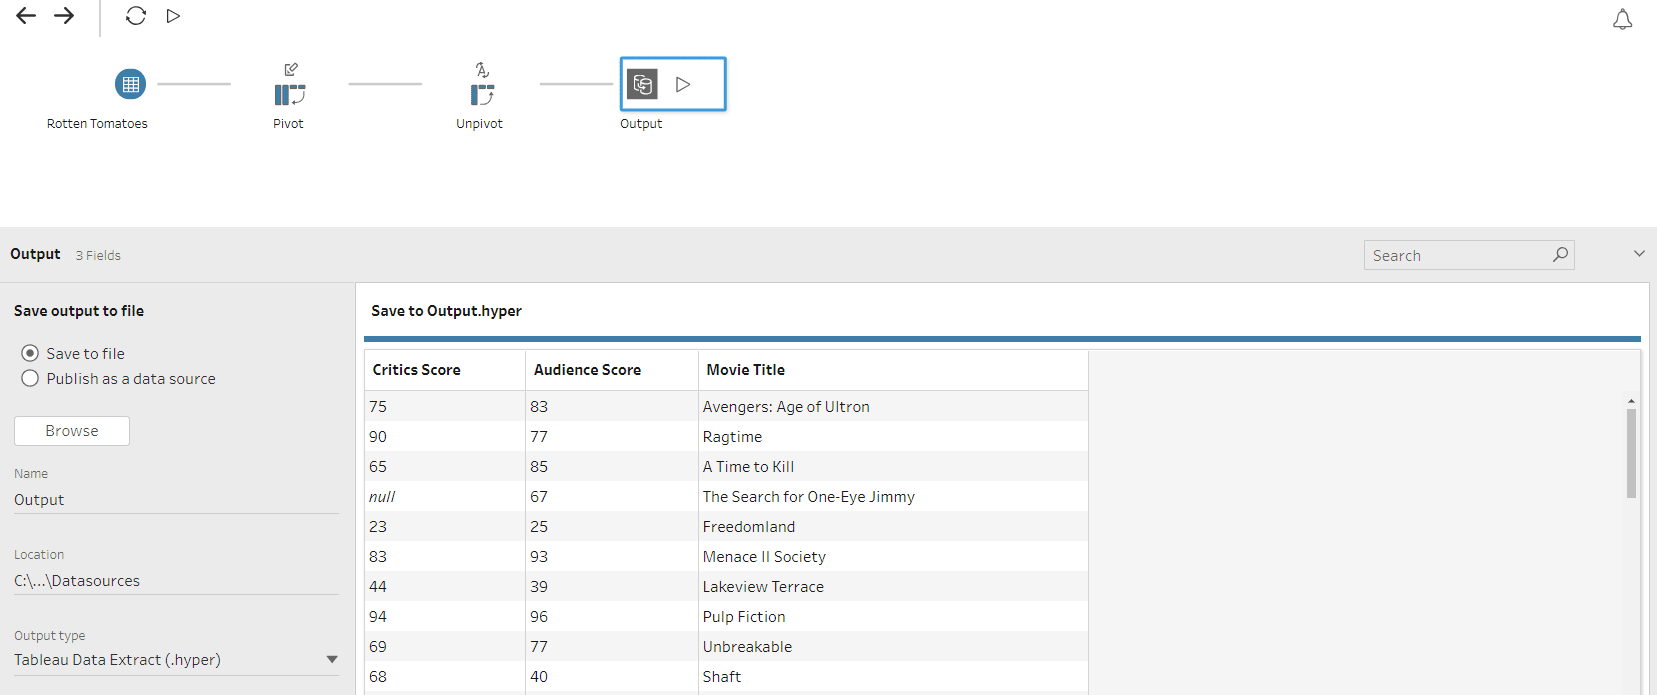
Now that we’ve pivoted the columns to rows to create a dimension for Movie Title, then unpivoted the Critics Score and Audience Score measures from rows to columns, we can easily analyze this data in Tableau. For example, I could start with the measure Critics Score, then break it down by the Movie Title dimension to see which movies received the best critical reception.
Thanks for reading,
– Ryan
If you need help learning Tableau Prep, Playfair Data offers an optional 1/2 day add-on to our private Data Visualization training.


Written By
Ryan Sleeper
Related Content
A Quick Start Guide to Tableau Prep

In this tutorial, we’ll be covering the Tableau Prep tool and how we can use it to build out data…
3 Tips for Data Quality Assurance (QA) in Alteryx

Anyone who works with data would probably say that ensuring accuracy is half the battle. While a final Quality Assurance…
9 Quick Alteryx Tips to Optimize Your Data Workflows
When beginning to develop an Alteryx workflow, sometimes I find myself asking, where should I start? What happens next? How…