How to Mask Survey Results in Tableau
Anonymous survey analysis has one key challenge – how do we incorporate categorical and demographic information while protecting the participant’s privacy? Looking at the data by demographic subgroup is the only way to detect patterns indicating different experiences. However, disaggregating the data in this way can expose the responses of members in small subgroups. Here’s how we can mask survey results in Tableau.
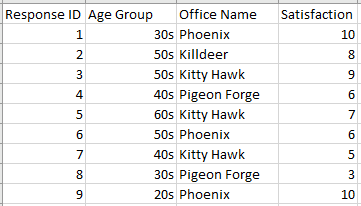
In this tutorial, we are going to use some fake Net Promoter Score data. If you would like to follow along, the data can be viewed and downloaded from this shared location. This dataset consists of four columns – Response ID, Age Group, Office Name, and Satisfaction.
We also have a basic dashboard that we’ll be updating to mask survey results in Tableau to protect the participants’ anonymity. It includes a few KPIs, a table with scores by Office and Age Group, and a response distribution.
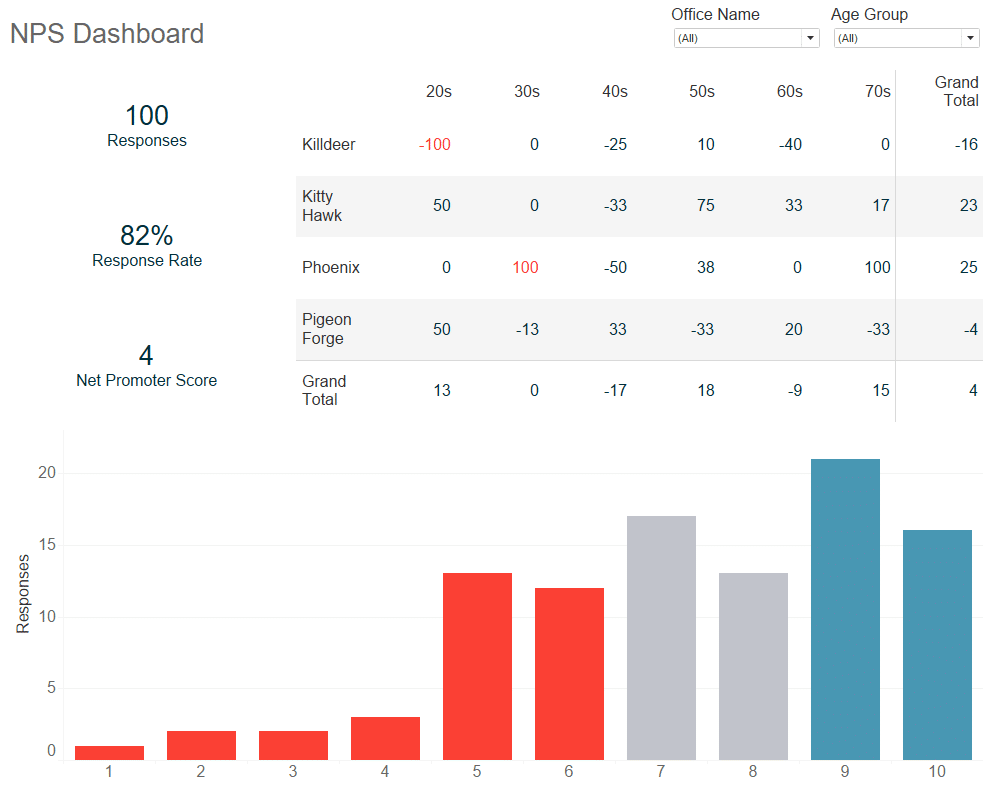
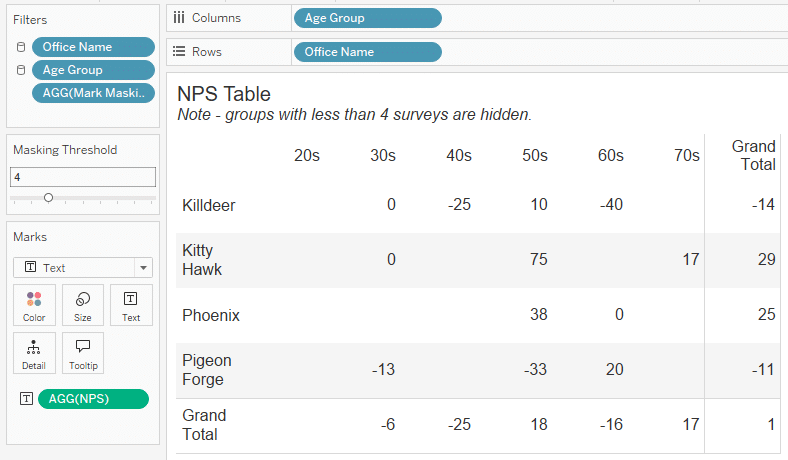
Looking at the dashboard, the two highlighted cells represent just one participant – there is only one participant in their 20’s from the Killdeer office, and one participant in their 30’s at the Phoenix office. We need to update the workbook to obscure their responses in the breakdown table, and prevent the filters from revealing other individual’s response values.
We will use two different methods. For worksheets where all scores 1-10 are represented in a single mark, we focus on how many surveys each mark represents. When a mark has just one participant, or falls under a dynamic masking threshold, we filter out that mark. The second method is for sheets like the response distribution worksheet, that include the response value, or a dimension derived from the response values. In this case, we need to count the surveys ignoring that dimension instead, hiding the pane or worksheet when there are not enough participants represented.
Create a free account, or login.
Unlock this tutorial and hundreds of other free visual analytics resources from our expert team.
Already have an account? Sign In
Hide marks with responses under masking threshold
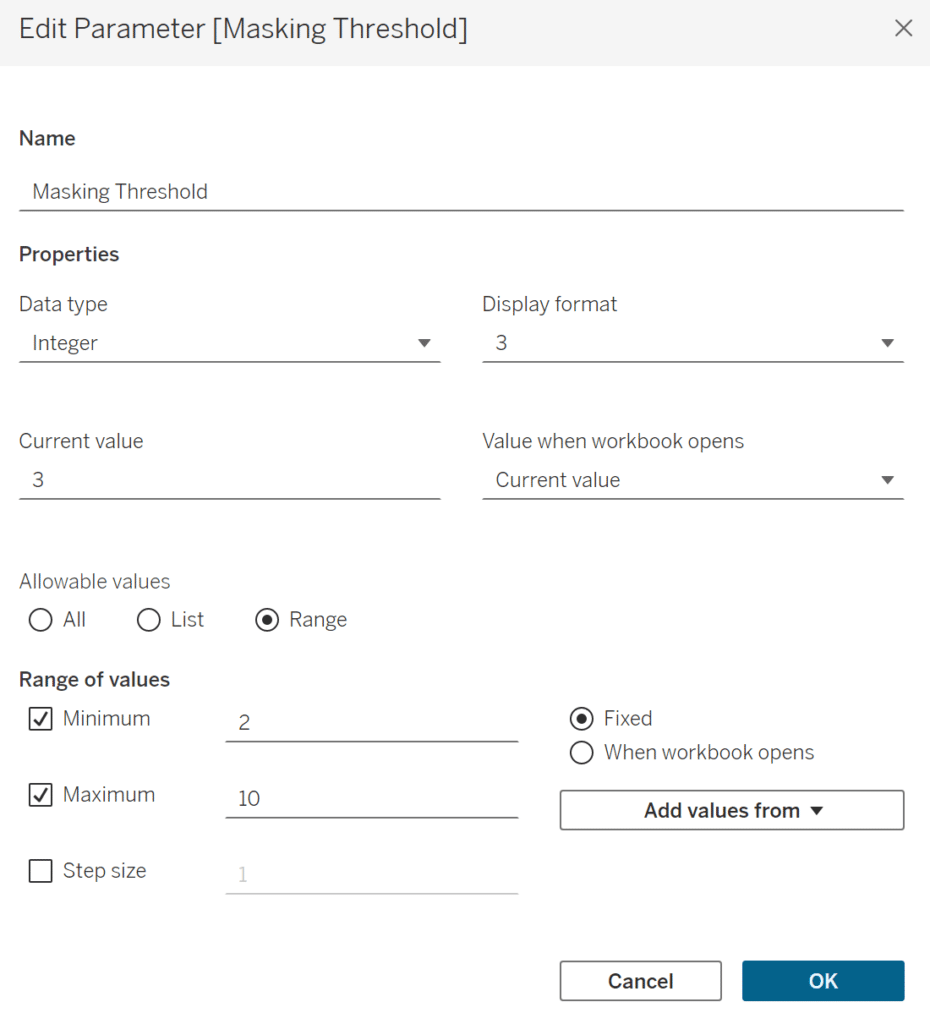
I’ll be building the masking filter with a dynamic threshold, controlled by a parameter value. If you know what your threshold will be, you can replace any references to the parameter with a hardcoded value. My parameter is an integer parameter with a set range of 2 – 10.
Let’s start with the table. This worksheet doesn’t include any dimensions based on the survey responses – this means that any cell on the table could include Promoter, Neutral, and Detractor satisfaction scores at the same time.
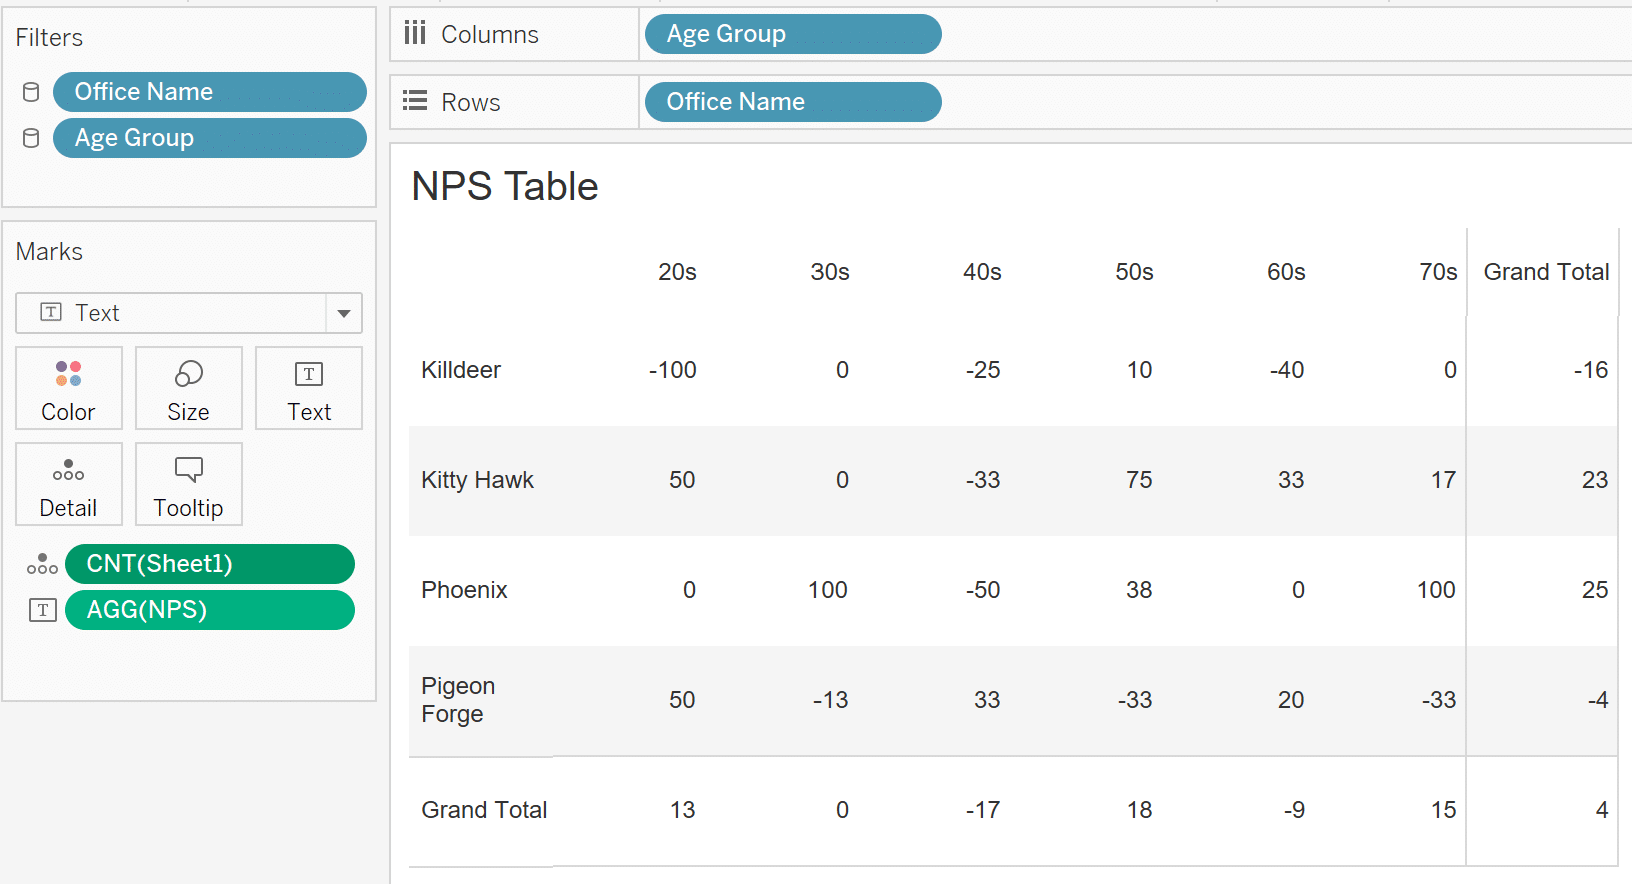
Let’s look at the number of records in each mark.
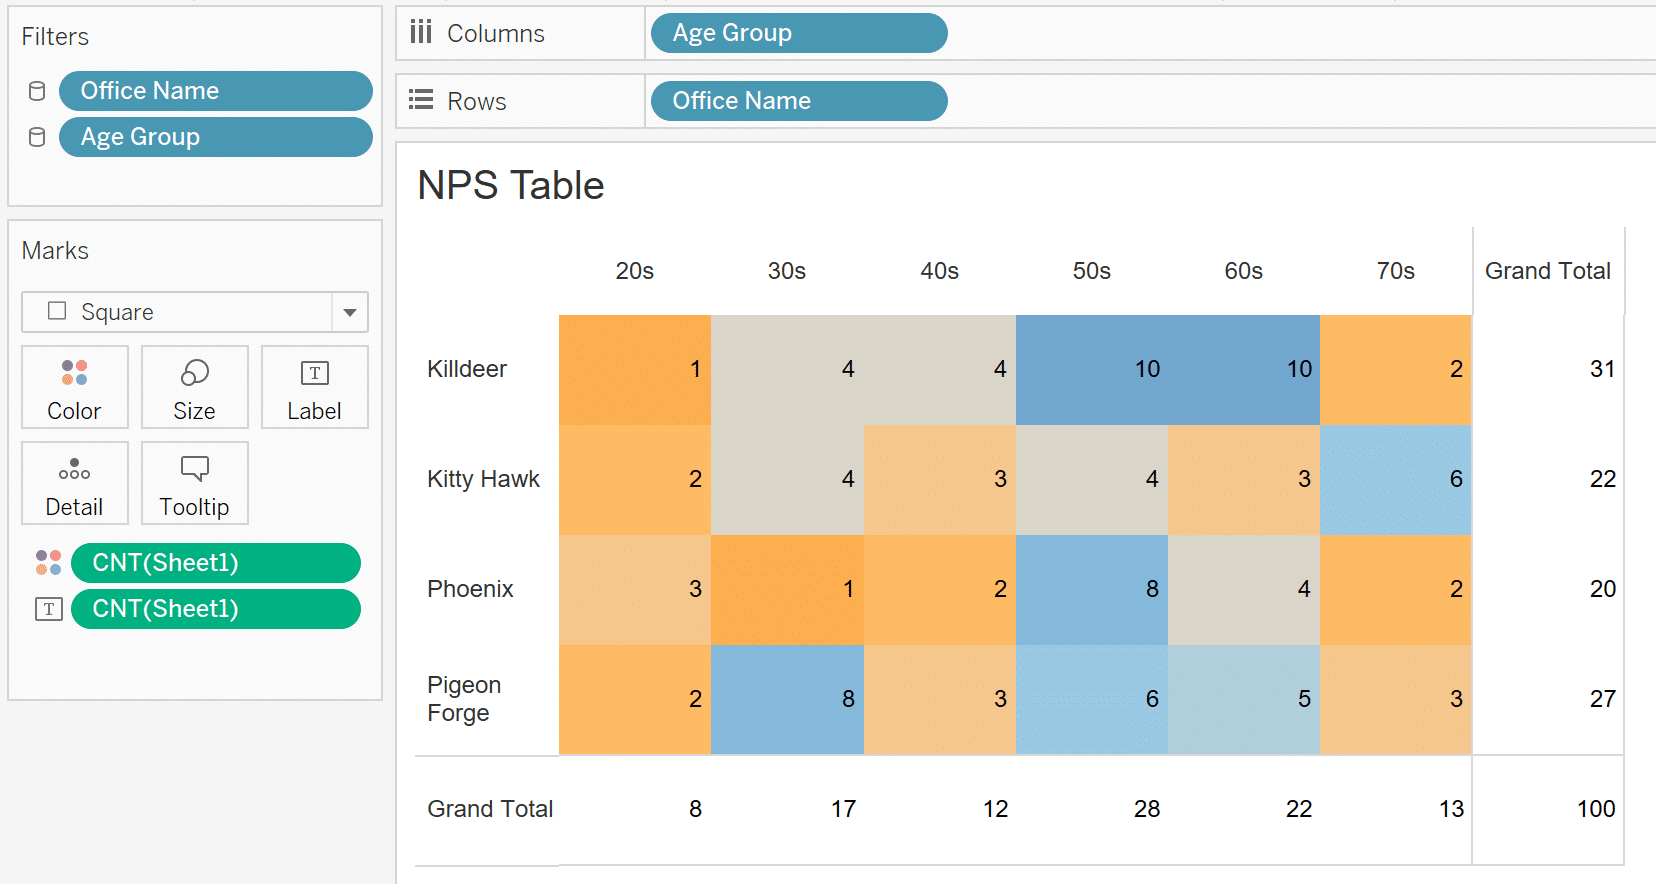
Two cells have just one record, five cells have two records, and another five cells have three records.
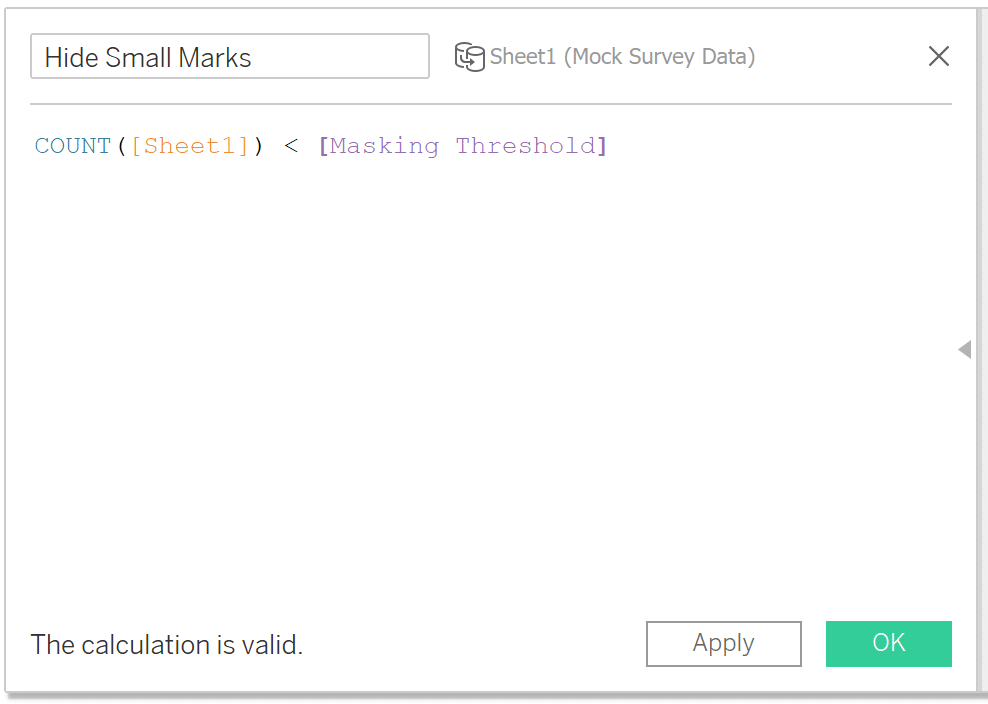
I create a calculated field to compare the number of records to the masking threshold. The threshold can be a fixed number or a parameter.
COUNT([Sheet1]) < [Masking Threshold]
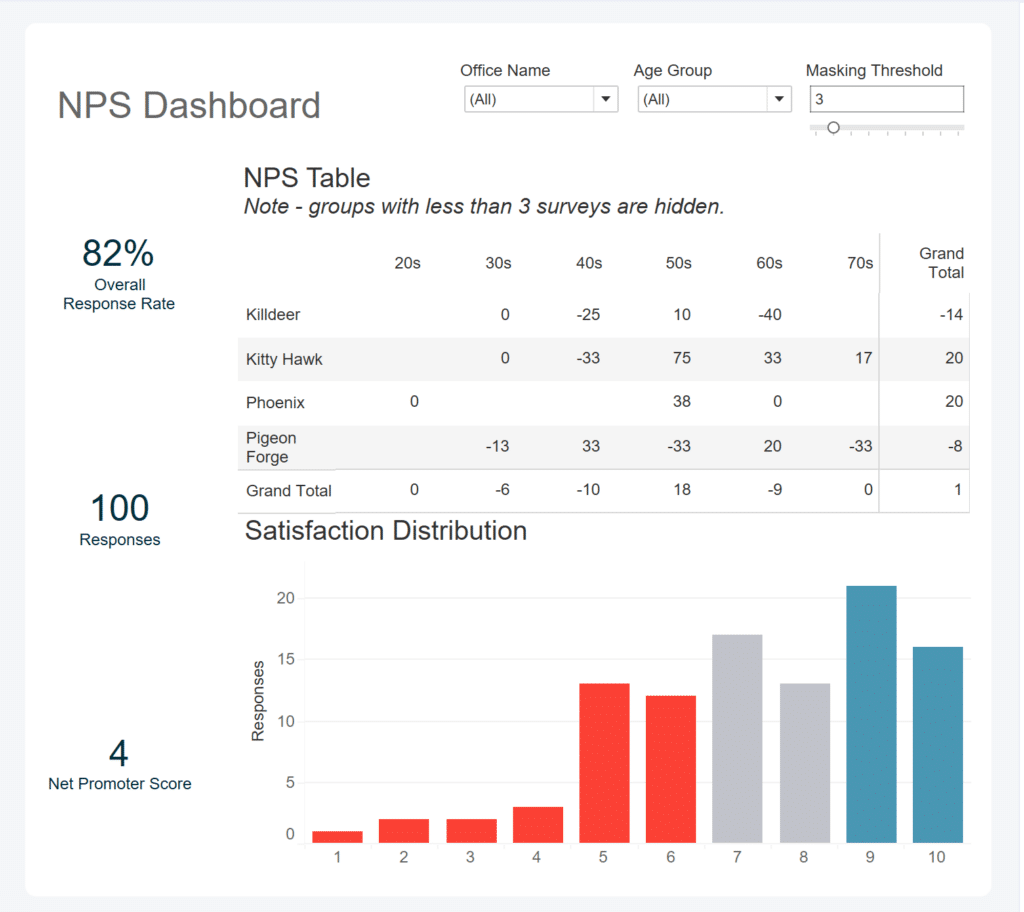
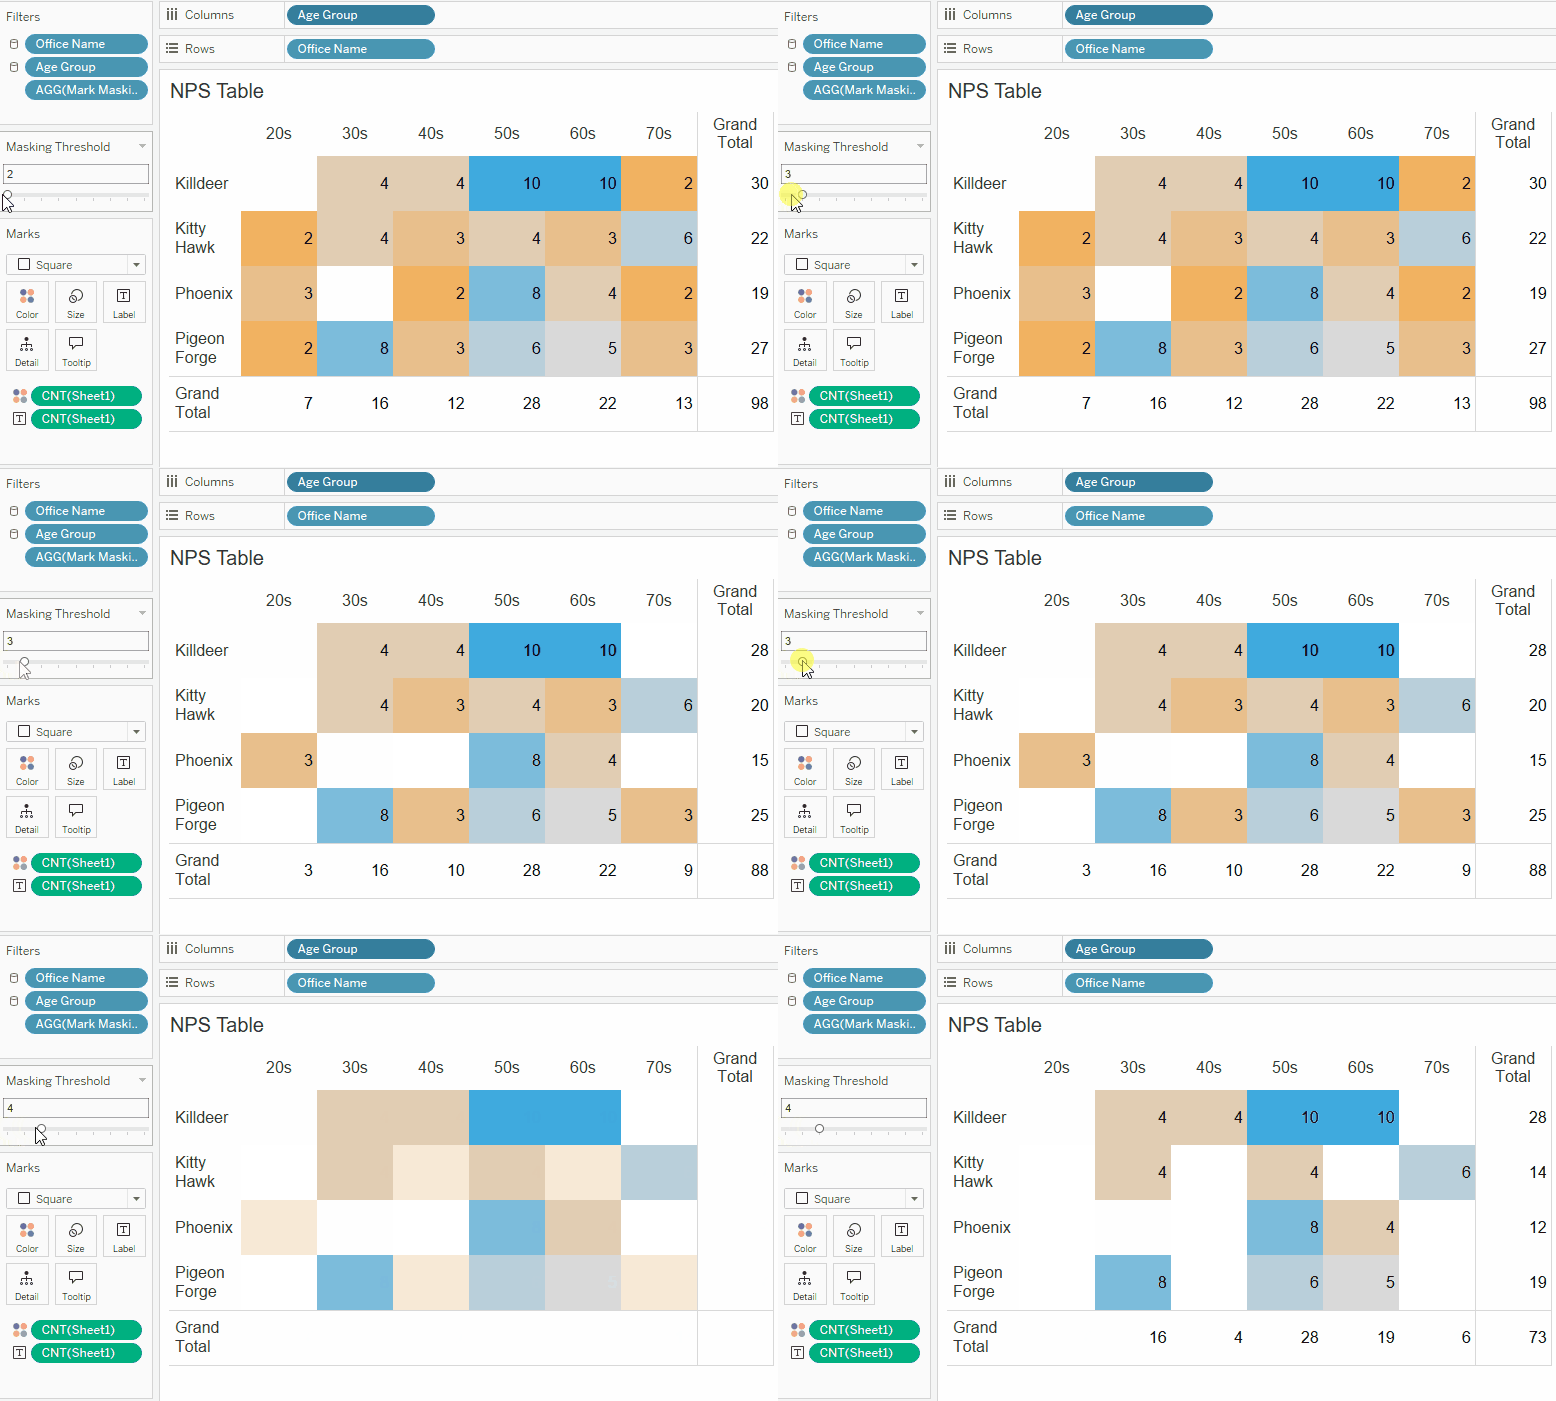
Then we apply this calculation to the view as a filter. We can watch cells go blank as the Masking Threshold parameter is updated.
After creating the filter, the last step is notifying the user that some results may be hidden.
How to Add a ‘Filter in Use’ Alert to a Tableau Dashboard
Prevent filters from isolating responses
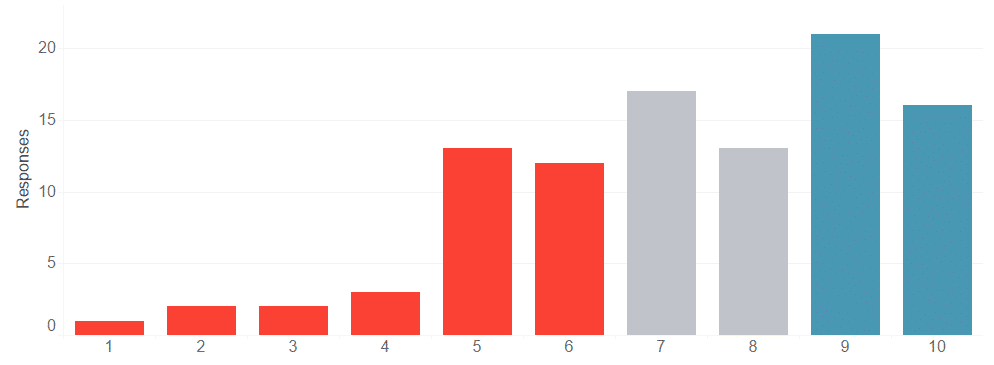
On worksheets with response breakdowns, we can’t filter marks the same way. For example, in this Satisfaction Distribution view there is only one response that selected 1 on the NPS question. We don’t want to filter this mark out, even though the response count is under the threshold. This isolated mark does not reveal an individual’s identity; the mark is just one piece of a larger whole. Instead of looking at the number of surveys in each mark, we need to look at the total number of surveys across all NPS values, and compare that total to the masking threshold.
We can use an EXCLUDE level of detail expression or WINDOW_SUM() table calculation to find the total survey count across the Satisfaction values.
Let’s start with the EXCLUDE calculation. Make sure to include all of the response dimensions in the view in the partition clause. Here, I need to include both Satisfaction and Satisfaction (group).
{ EXCLUDE [Satisfaction], [Satisfaction (group)]:
COUNT([Sheet1])} < [Masking Threshold]
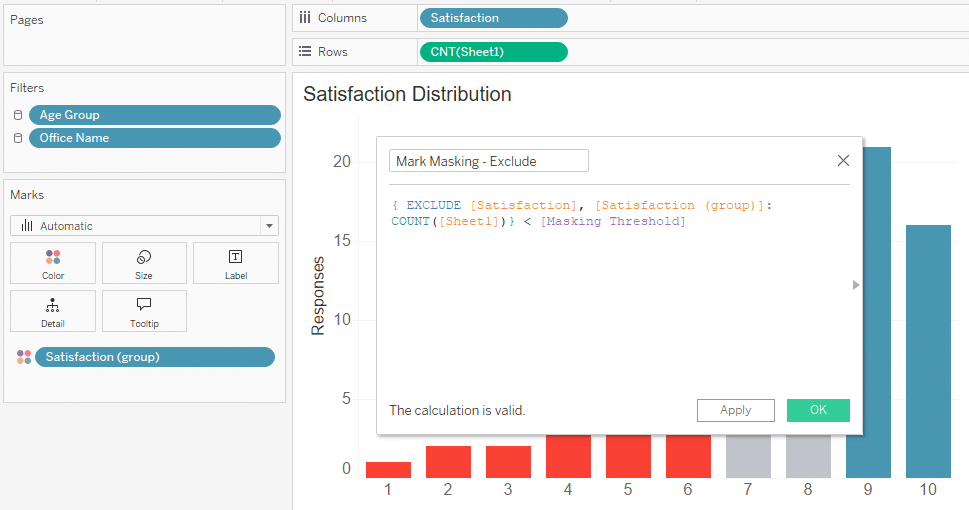
Then add the calculation as a filter, keeping FALSE values. Now we can see the view go blank when Office is set to Killdeer and Age Group is set to 20s.
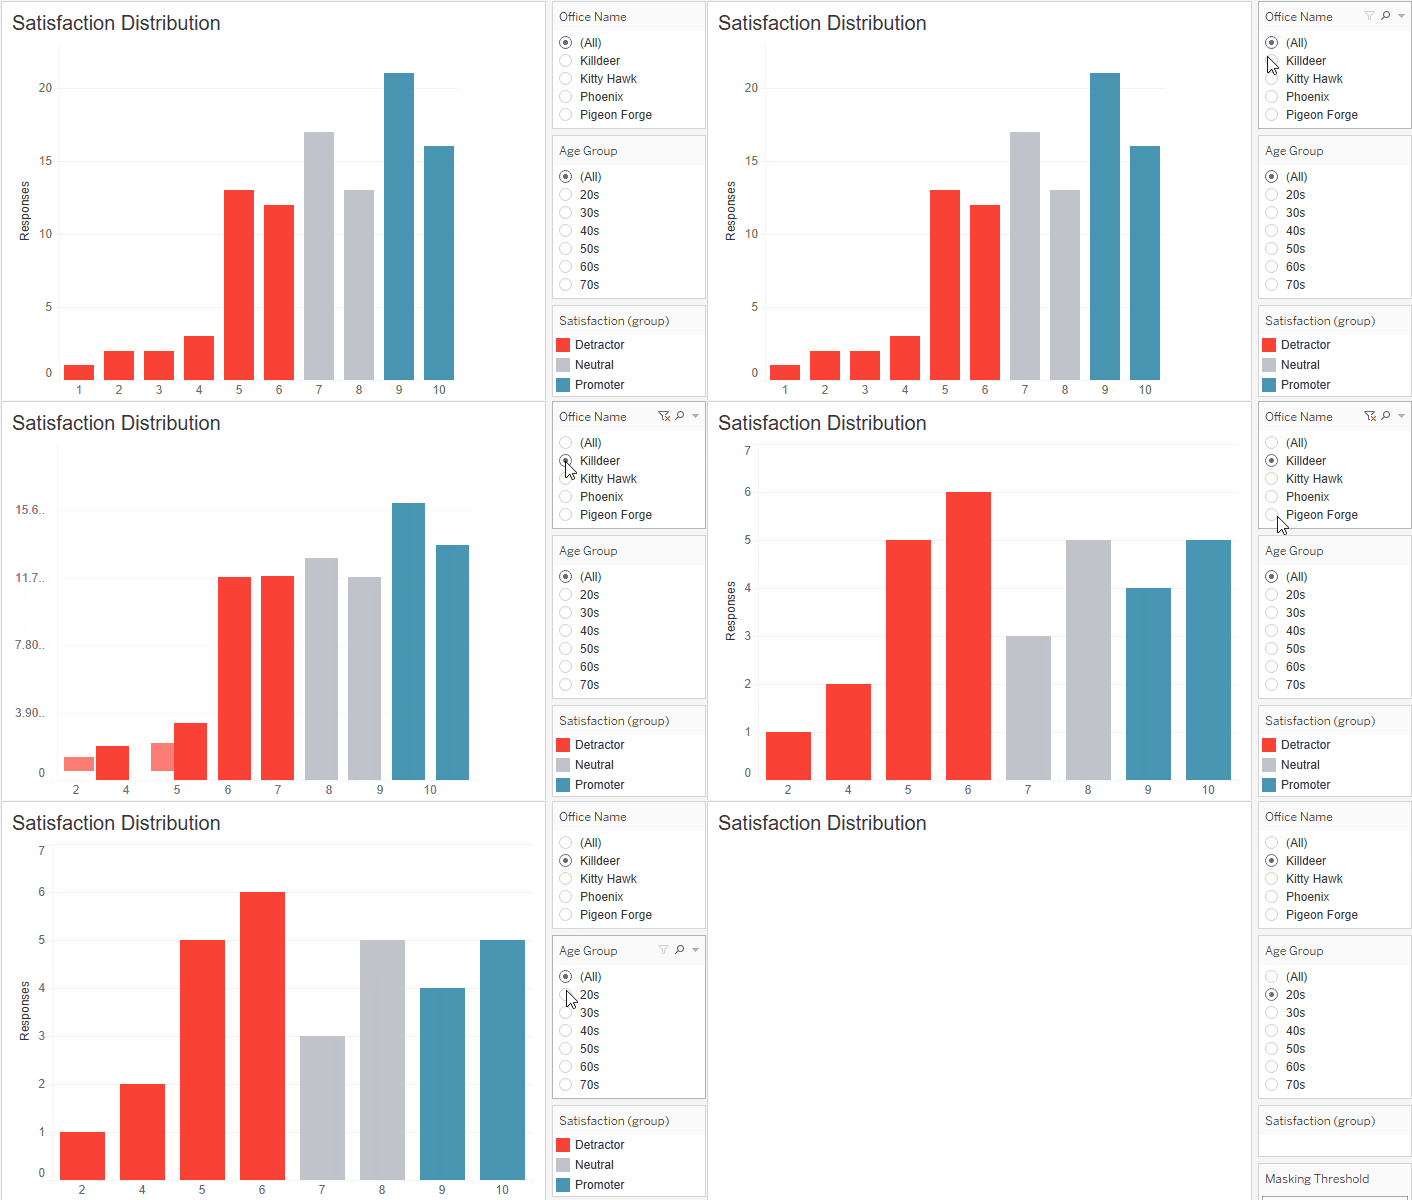
This filter can be applied across multiple worksheets as a shared filter. Depending on your data source structure and workbook build, you might need multiple versions of the Exclude function for different views in your workbook.
The Beginner’s Guide to Tableau Level of Detail (LOD) Calculations
The WINDOW_SUM function is more flexible, but requires more configuration after adding it to a worksheet. It also cannot be used as a shared filter – each sheet with the WINDOW_SUM filter will need to be set up independently.
This calculation is simpler – we wrap the survey count in the WINDOW_SUM() function, and then compare that value to the Masking Threshold value. There’s no need to specify which dimensions to ignore at this point.
The Beginner’s Guide to Tableau Table Calculations
WINDOW_SUM(COUNT([Sheet1])) > [Masking Threshold]
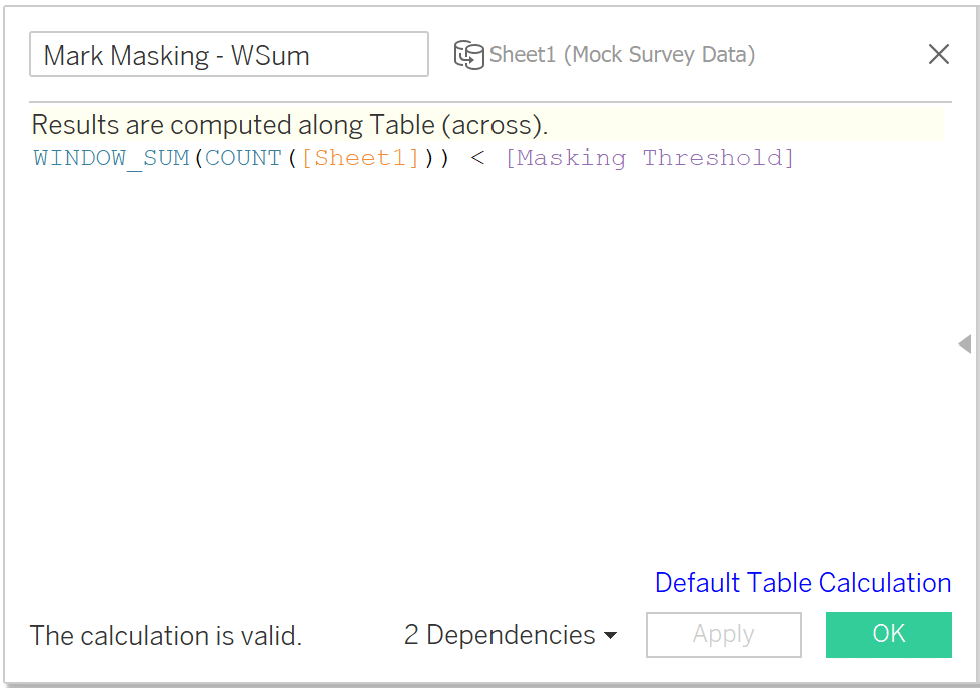
Next, we add the calculation to the worksheet and configure the computation settings. Make sure all dimensions related to the survey responses are selected. Here, I have to select both Satisfaction and Satisfaction (group). You can leave other dimensions unselected, like Age Group or Office Name in this dataset.
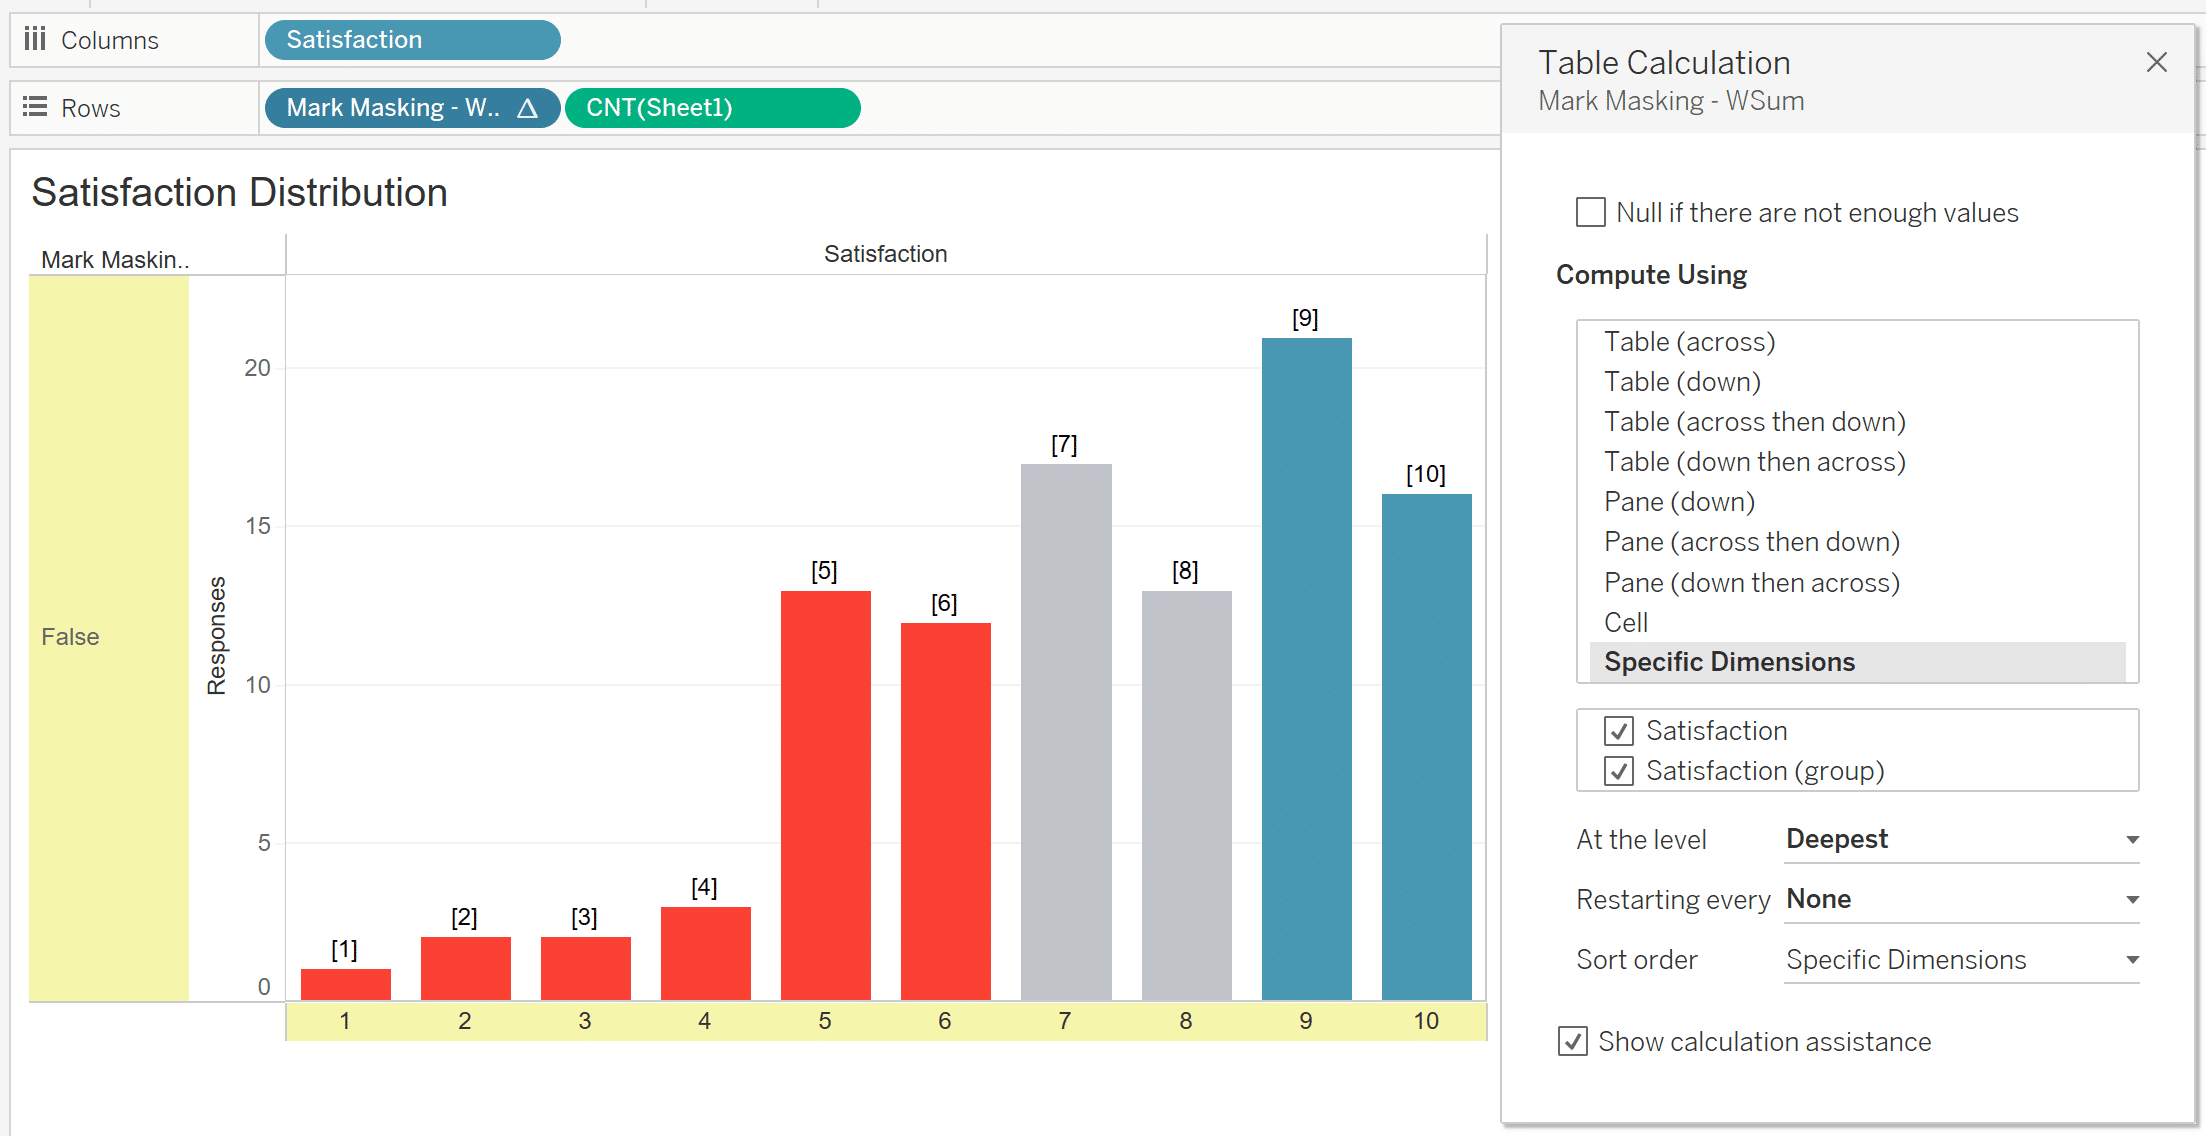
Then add the filter to the worksheet, keeping False values. Now the view goes blank when Office is set to Killdeer and Age Group is set to 20s.

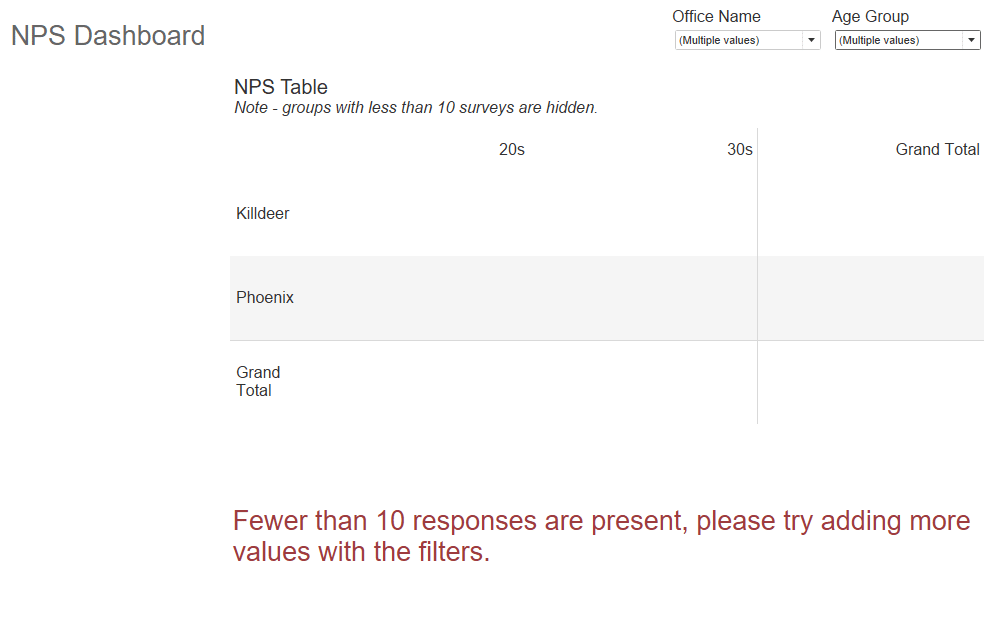
Finally, add notifications and alerts to the dashboard. Because this view is structured in a way that is all or nothing, I’m adding an alert text box layered behind the worksheet. This will appear when there is no data in the worksheet, and is hidden by the worksheet background when data is present.
Limit access to the data
When you publish the workbook, it’s critical that users cannot access the raw data. This means you need to lock down those permissions! Since our goal is to maintain anonymity, this is an essential step in how to mask survey results in Tableau.
When you publish the workbook, do not allow Download Full Data, Web Edit, Run Explain Data, or Download a Copy. Always test out the access with a viewer login, and check that the raw data cannot be accessed before sharing the workbook with your stakeholders.
Thanks for reading,
Felicia
Related Content
How to Build a Semi-Sunburst Chart in Tableau
A Semi-Sunburst chart in Tableau creates a visually striking effect that catches the viewer’s attention. If you need to add…
Felicia Styer
Learn about Relationships and Tableau’s Logical Layer Are you struggling to combine data from different data sources? This video demonstrates…
How to Implement Row-Level Security in Tableau
When working with data, security is always top of mind within an organization. Most businesses spend a lot of time…
