The Beginner’s Guide to Tableau Level of Detail (LOD) Calculations

In the ever-evolving landscape of visual analytics, you can often find yourself working with complex datasets, multiple data sources, and different systems. This can lead you to working with data at different levels of detail. Thankfully, Tableau has built in functions that make it easy for you to work at different levels of granularity. I say easy, but Tableau level of detail calculations or Tableau “LODs”, for short, can be one of the most challenging functions to work with. In this post, I will discuss what level of detail is in a dataset, review Tableau’s three LOD functions, and show you an example of how to use each of them.
What is Tableau’s level of detail?
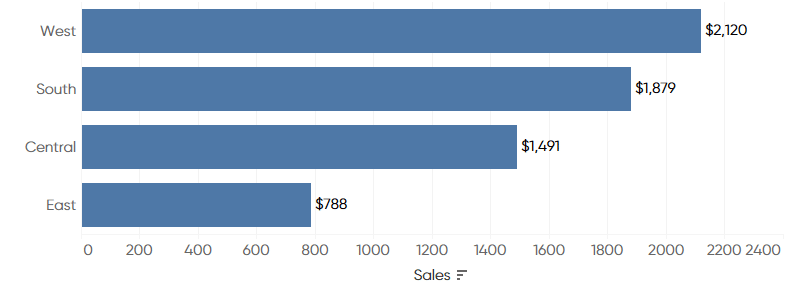
The granularity of your data is what each individual row represents. For the Sample – Superstore data that comes with every download of Tableau, each row represents an item in an order. The views we build have a level of detail that shifts based on the dimensions included. For instance, consider this bar chart that looks at Sales by Region.
Continue reading with a free account, or login.
Unlock this tutorial and hundreds of other free visual analytics resources from our expert team.
Already have an account? Sign In
By continuing, you agree to our Terms of Use and Privacy Policy.
If you were to define the level of detail here, it would be at the Region level of detail. What if you added State to the view as shown in the next visualization?
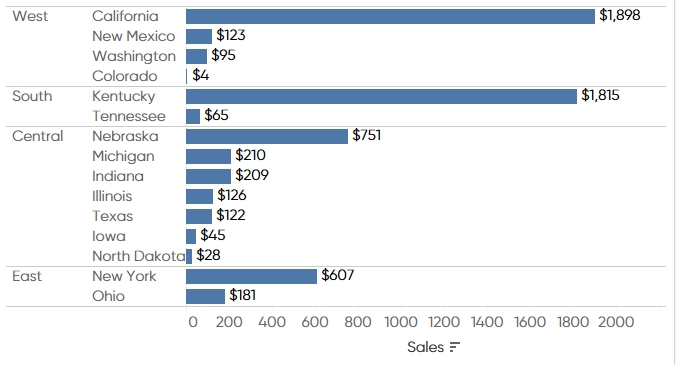
Here you have gone an additional level of detail down to State. You would now refer to this view at the State level of detail because that is the lowest level of detail in the view.
![]()
Where you typically run into issues is when you want to have a view at a lower level of detail and want to compare the data in that view to a higher level of detail or vice versa. By default, the calculations or aggregations you add to the view are calculated at the view’s level of detail. Meaning if you wanted to go up or down a level of detail in the view, you would need to use level of detail calculations or table calculations in Tableau.
The next figure is a great introduction to the three types of level of detail calculations and how they work.
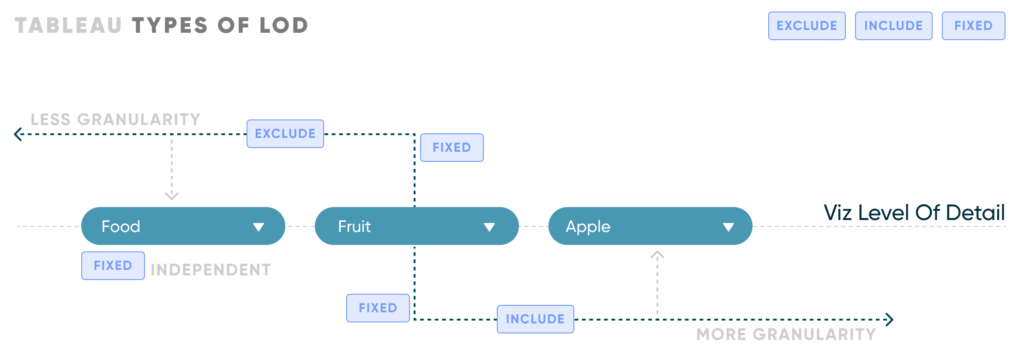
You can see that if you wanted to go to a higher level of detail than the default, visualization level of detail, you would use the EXCLUDE function in Tableau. This would exclude, or ignore, dimensions in your view and allow you to calculate at a more aggregated / less granular level of detail.
If you wanted to go to a less aggregated / more granular level of detail, you can use the INCLUDE function in Tableau. This is where you would include additional dimensions for your calculation in the view.
The last level of detail function that Tableau has is the FIXED Tableau LOD. This function will fix the calculation / aggregation at whatever level of detail you want.
Now that you have a brief understanding of the three Tableau LOD functions, let’s dive into each function individually.’
An Introduction to Tableau Level of Detail Expressions
Using Tableau’s EXCLUDE level of detail function
One of the Tableau LOD functions is EXCLUDE. This function is going to allow you to exclude dimensions in the view to allow you to calculate aggregations without those dimensions. As an example, let’s say you wanted to compare the average sales of the region to the average sales in each state within that region. Let’s walk through that together.
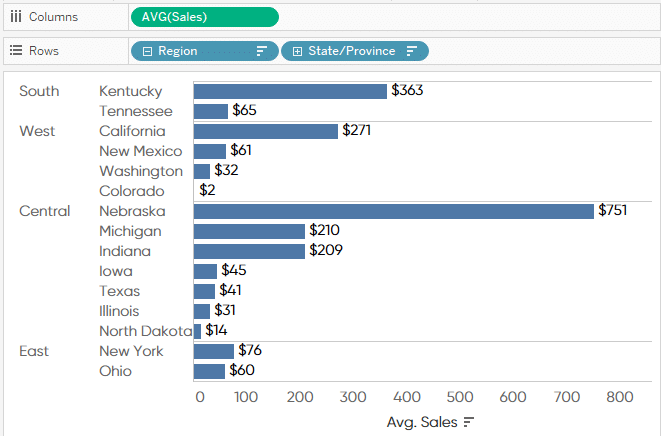
First, I will build a view that is going to show the AVG Sales by Region by dragging AVG Sales to the Columns shelf and Region to the Rows shelf as shown below.
Take note of the values in this view. In the next step, you are going to recreate these values at a lower level of detail.
If you drill down a level from Region into the State/Province level of detail, you will see the average sales by state.
Now you can create a Tableau LOD calculation using the EXCLUDE function and add that to the columns shelf in the view. The formula for this calculations is:
{ EXCLUDE [State/Province]: AVG([Sales])}
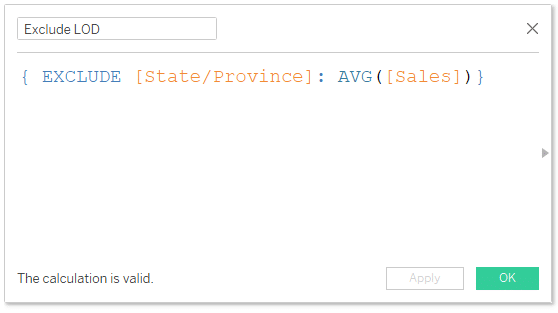
This calculation is going to exclude the state level of detail. Adding this new calculated field to the view, you will see that it assigns the region’s average sales to each state. If you compare back to the region view, you will see these averages match.
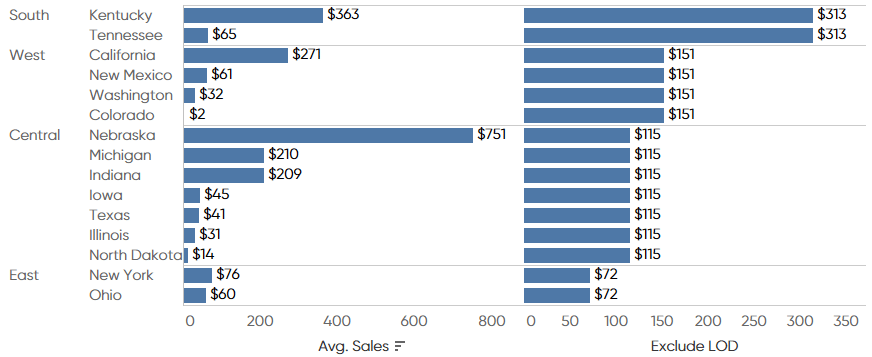
You can even take it a step further by creating a calculated field that takes the difference between the state average sales and the region average sales using the LOD calculation.
AVG([Sales])-AVG([Exclude LOD])
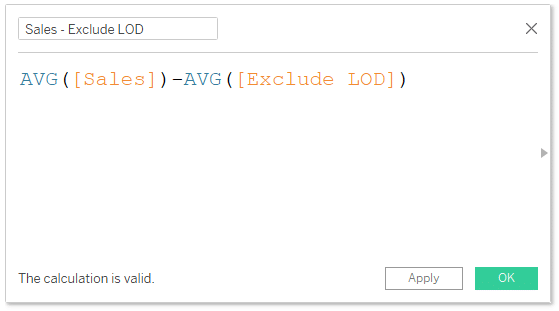
It’s also important to note, with Tableau LODs the aggregation within the brackets “{ }” doesn’t count as the overall aggregation for the calculation itself. As a matter of fact, if you didn’t have the function “AVG” around Exclude LOD in the Sales – Exclude LOD calculation you would get an error. This is because you are defining the aggregation that will be used to calculate the LOD at the row level then you define the aggregation outside the LOD brackets “{ }” for the view level. That is what is happening here in the Sales – Exclude LOD calculation.
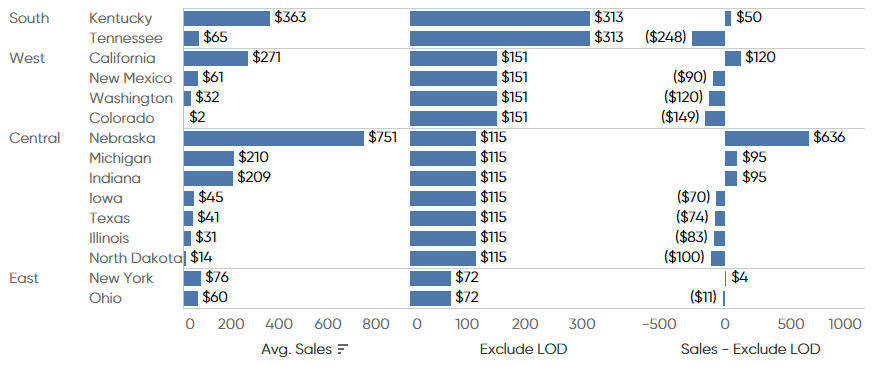
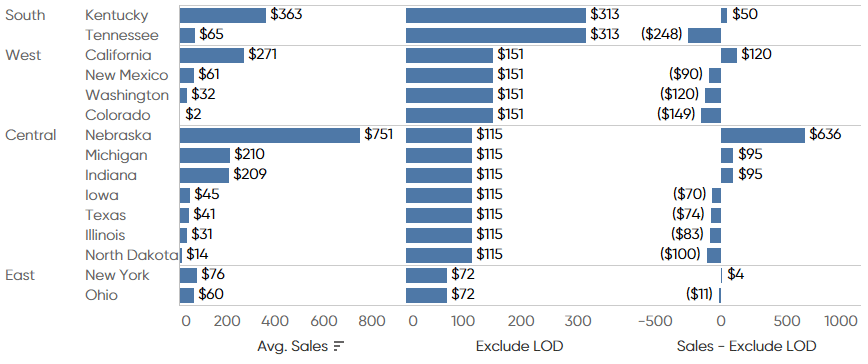
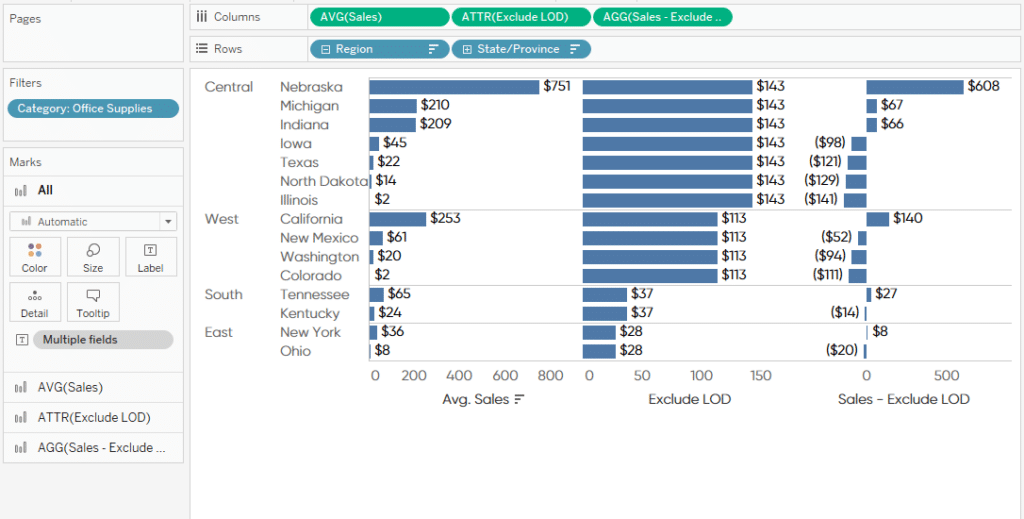
If you add “Sales – Exclude LOD” to the Columns shelf as well, you will see a new diverging bar chart that shows you the difference between the states average sales compared to the region’s average sales.
Using Tableau’s INCLUDE LOD function
The next Tableau LOD calculation is the INCLUDE function. This will allow you to include a lower level of detail in the calculation. To demonstrate how this function works, I will start with the average sales by region bar chart.

Next, create a calculated field using the INCLUDE function to get the average sales by state. Your calculation should look like this:
{ INCLUDE [State/Province]: AVG([Sales])}
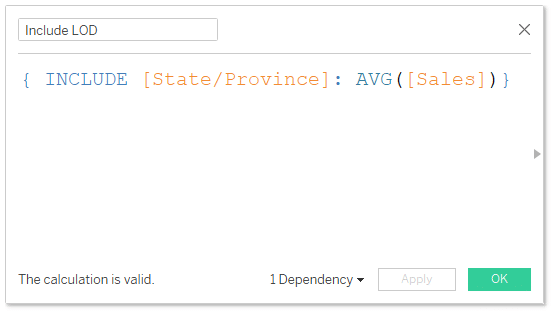
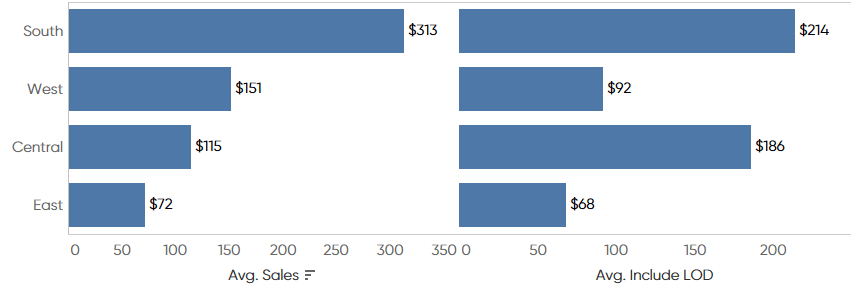
If you add the new “Include LOD” calculation to the Columns shelf, you will see different averages calculated for each region.
Why is that? To best show you what is happening, right-click on the South region and click “View Data” from the menu.
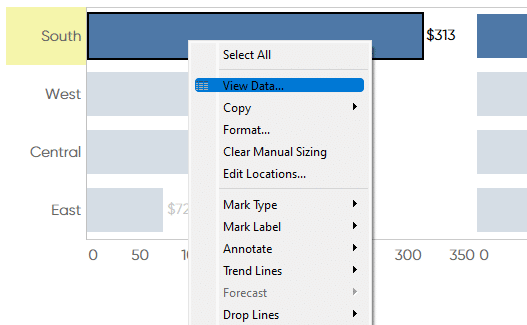
When the window opens, you will see several “Tabs” on the left-hand side. If you click on the “Include LOD” tab, it will show you the data that is being used to derive the results.
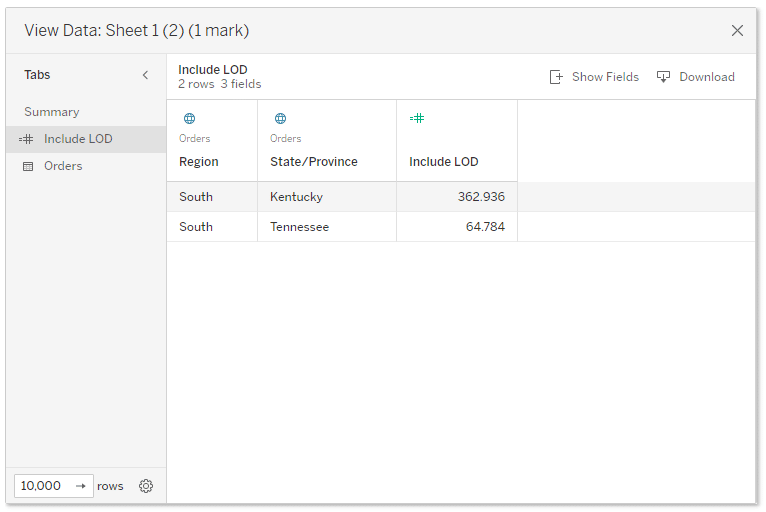
You can see that there are two states in this region, Kentucky and Tennessee, with average sales of $362.94 and $64.78. If you take the average of those values you get $214 which is the number the INCLUDE LOD calculated. This means that the “Include LOD” calculation is essentially getting the average sales by state and then averaging them. Not best practice taking averages of an average but this is just a demonstration of functionality.
Now, if you click on the Orders tab, this will show you the data that is being calculated in the view at the Region level of detail.
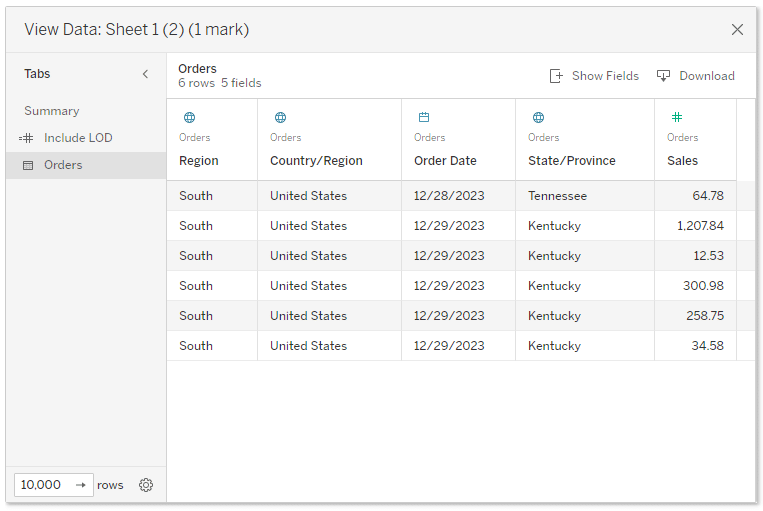
If you take the average of the Sales columns you will get $313. Again this is due to the fact that the “Include LOD” calculation went to the state level of detail, calculated the average sales by state, then calculated the average of that.
Using Tableau’s FIXED LOD function
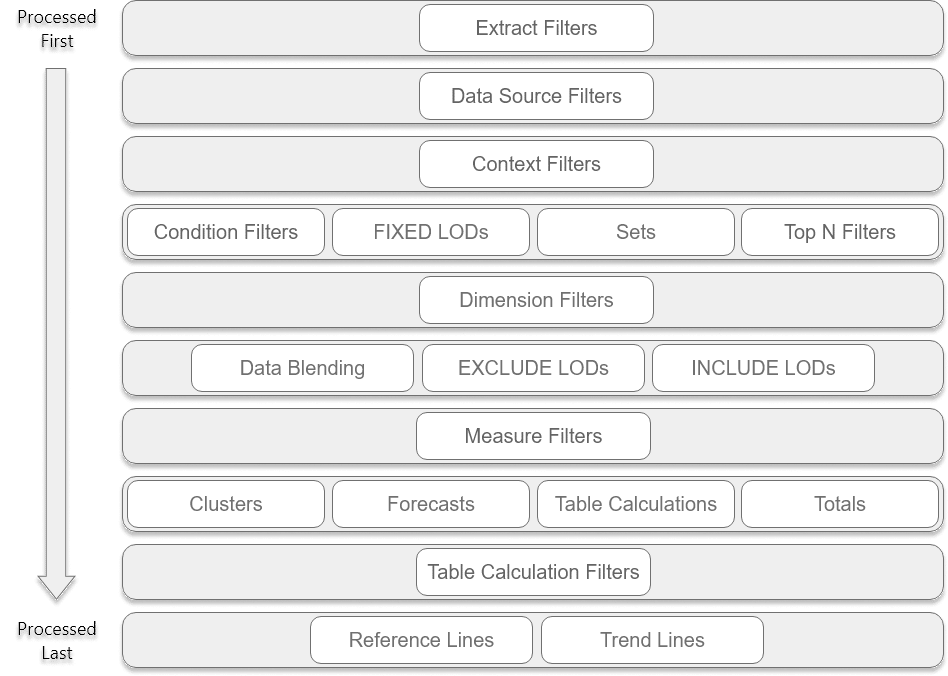
The last Tableau LOD uses the FIXED function. Using the FIXED function allows you to fix a calculation at any level of detail you want. The one key difference between this function and the other two is that a FIXED LOD can not be affected by additional breakdowns in the view like dimension filters. This is because of where FIXED LODs are processed within Tableau’s order of operations.
The Definitive Guide to Filters in Tableau
You can see that FIXED LODs are processed at the fourth row and the other LODs are processed on the sixth row. This means that even though you are using an LOD expression to go up or down a level of detail in the view, there are still factors like dimension filters that can affect the value.
![]()
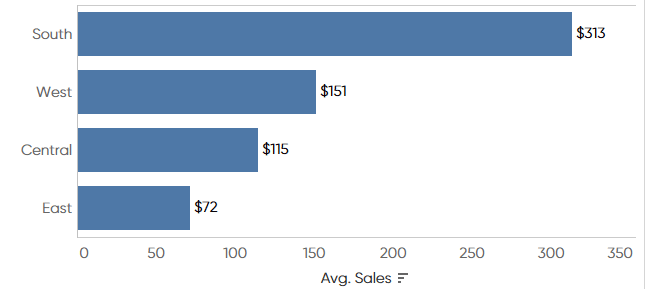
Let’s go back to the example within the EXCLUDE section.
You can see that each region’s average sales were $313, $151, $115, and $72. What happens if you add Category to the Filters shelf and filter the view on Office Supplies?
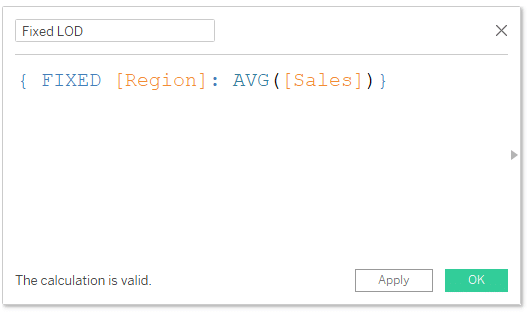
You can see that each column’s values have now been filtered – even the EXCLUDE LOD. If you were to use the FIXED function, the value would not be affected by the filter. To demonstrate this, create a new calculated field using the FIXED function.
{ FIXED [Region]: AVG([Sales])}
If you add this to the Columns shelf next to the Exclude LOD, you will see that the original average sales values for each region appear.
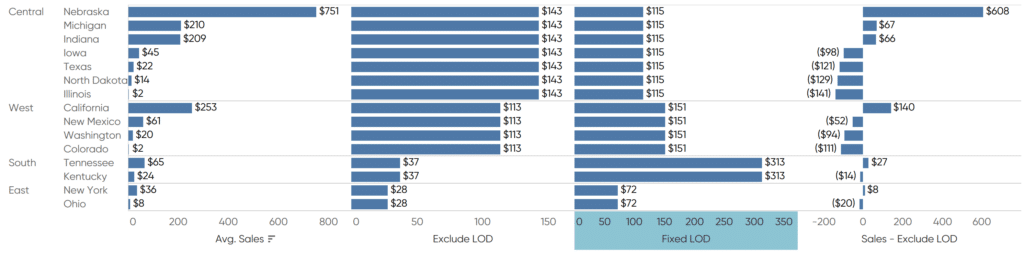
Again, this is because FIXED LODs are processed first and calculated before the dimension filters are processed.
There are many use cases for level of detail expressions, but potentially equally as many things to consider when attempting to use them. Hopefully this tutorial helps guide you in the right direction when controlling the granularity of your analyses using Tableau LODs.
Until next time,
Ethan Lang

Written By
Ethan Lang

Peer Review
Felicia Styer
Assoc. Director, Analytics Solutions
Related Content
The Beginner’s Guide to Basic Tableau Calculated Fields

At Playfair Data, we call calculated fields one of the “Big 3” – the three technical features that unlock the…
The Beginner’s Guide to Tableau Table Calculations
Tableau table calculations, while very powerful, can be both tricky and confusing to work with. There are some great benefits…
The Definitive Guide to Filters in Tableau
When designing a dashboard, we often want to give our users the ability to slice and dice the data on…