How to Use Tableau Prep to Combine Data at Different Levels

If you’ve been following the Tableau Desktop tutorials here at Playfair Data, it is likely that you also have a license to Tableau Prep Builder (just ask your license administrator to provide the activation key). Combining Tableau Prep with Tableau Desktop makes it possible for you to be a self-sufficient, end-to-end analyst from data engineering to dashboard development.
One of infinite use cases you can solve on your own in Tableau Prep is preparing a data source to analyze employee utilization, even when the numerator and denominator for the formula are at different aggregations. The “scaffolding” and join techniques shared in this post will be helpful any time you need to combine data sources at different levels for your analysis.
Using Tableau Prep to analyze employee capacity and utilization
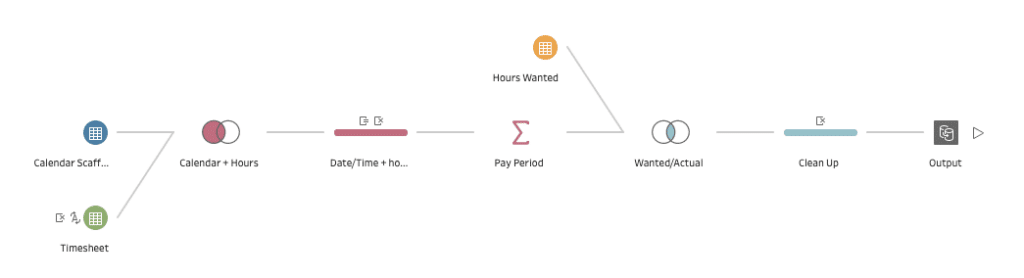
By the end of this post, you will be able to recreate the following flow in Tableau Prep which combines timesheet data at an hourly level and capacity data at a pay period level. This image will also be a helpful reference to see which Tableau Prep steps (Input, Join, Clean, Aggregate, Output) are required to prepare data at different levels of aggregation.
A common business need is analyzing employee utilization and time. Employers want to know how often their employees are working and how that compares to the number of hours they want to work, or the number of hours they have available. In most cases there are two main data sources that will be needed for this.
![]()
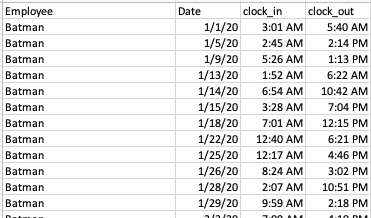
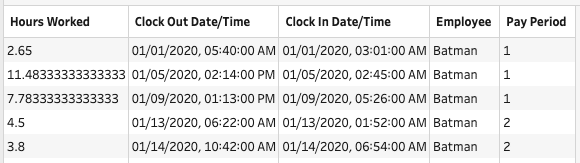
Timesheets – lists each employee and the date and times they clocked in or out.
Hours Wanted – lists each employee with the number of hours they would like to work or are available to work (by pay period).
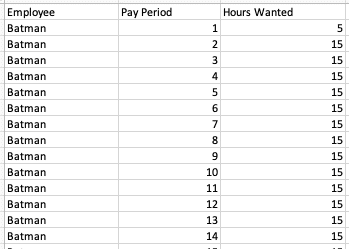
The main problem in this data is that the timesheet data and hours wanted data are at two different levels. Timesheets are recorded daily, and hours wanted is recorded by pay period. Since these data sources are at two different levels, there needs be a way to figure out what days belong in each pay period.
Continue reading with a free account, or login.
Unlock this tutorial and hundreds of other free visual analytics resources from our expert team.
Already have an account? Sign In
By continuing, you agree to our Terms of Use and Privacy Policy.
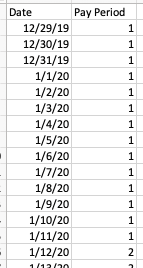
To account for the two different date levels, create a third data source that provides a crosswalk or lookup for each day and pay period.
Calendar scaffold – lists every day of the year and the associated pay period.
Working in Tableau Prep
Open Tableau Prep and use two Input steps to bring in the Timesheet and Calendar Scaffold data sources. Next, use a Join step to join the Timesheet data source to the calendar scaffold on Date.
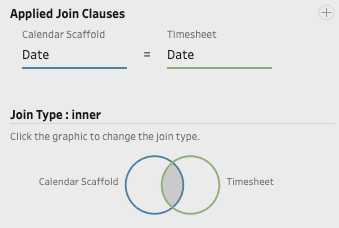
This join will bring the Pay Period numbers into the Timesheet data.
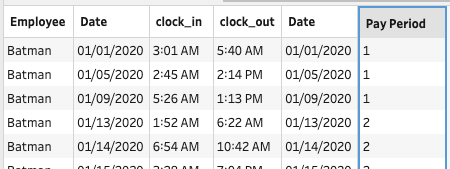
Some adjusting needs to be done with the dates and times which can be done by clicking the ellipsis on a field’s card from the Profile pane and choosing “Create Calculated Field”. So far, the date field, clock_in, and clock_out times are in separate columns.
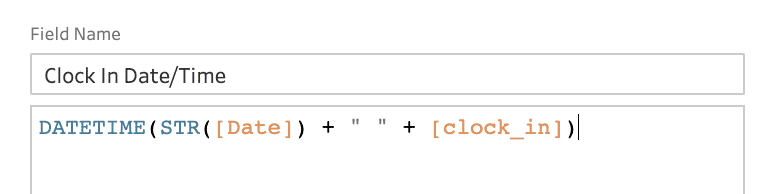
Create two datetime columns in order to calculate the number of hours worked on each day (Clock In Date/Time and Clock Out Date/Time). Here’s how the Clock In Date/Time calculated field looks; you would also need to complete this step for the [clock_out] column.
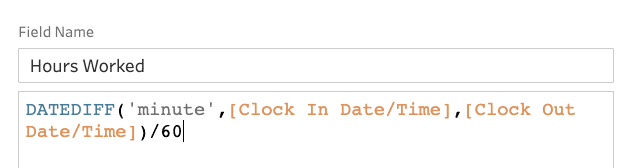
Next, create a calculated field that computes the number of hours between the newly created Clock In Date/Time and the Clock Out Date/Time fields.
Clean up any redundant fields to remove any clutter from the data.
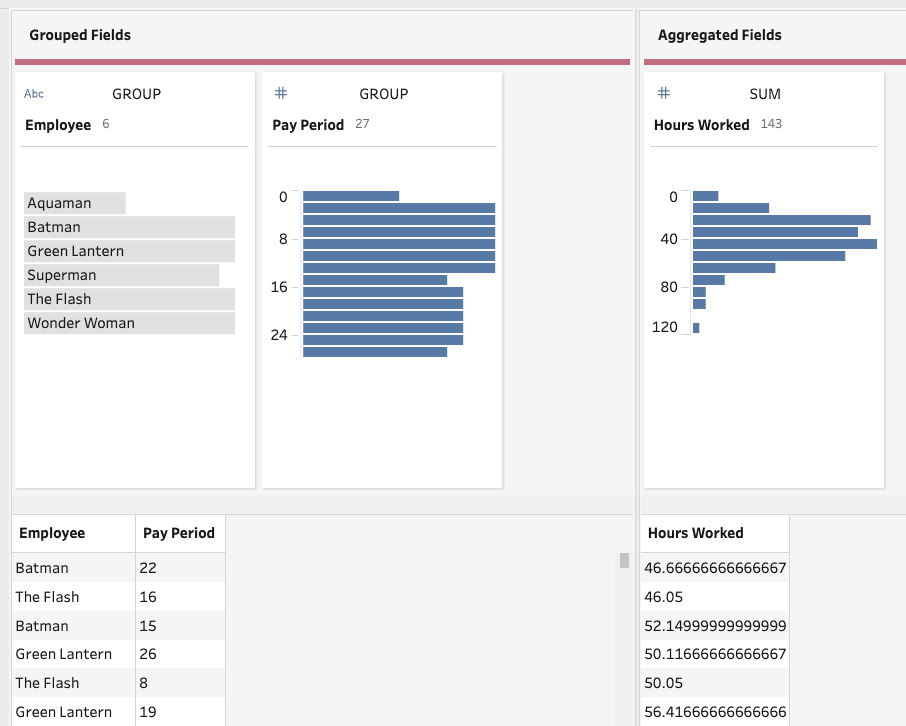
Since the data sources are at two different levels, some sort of aggregation needs to be done so the timesheet and hours wanted are in alignment. In this case, aggregate to the pay period level (the highest level in the data) by adding an Aggregate step in Tableau Prep.
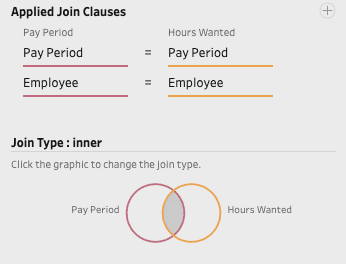
Once the timesheet data is at the pay period level, you can join it to the Hours Wanted data source by Pay Period and Employee.
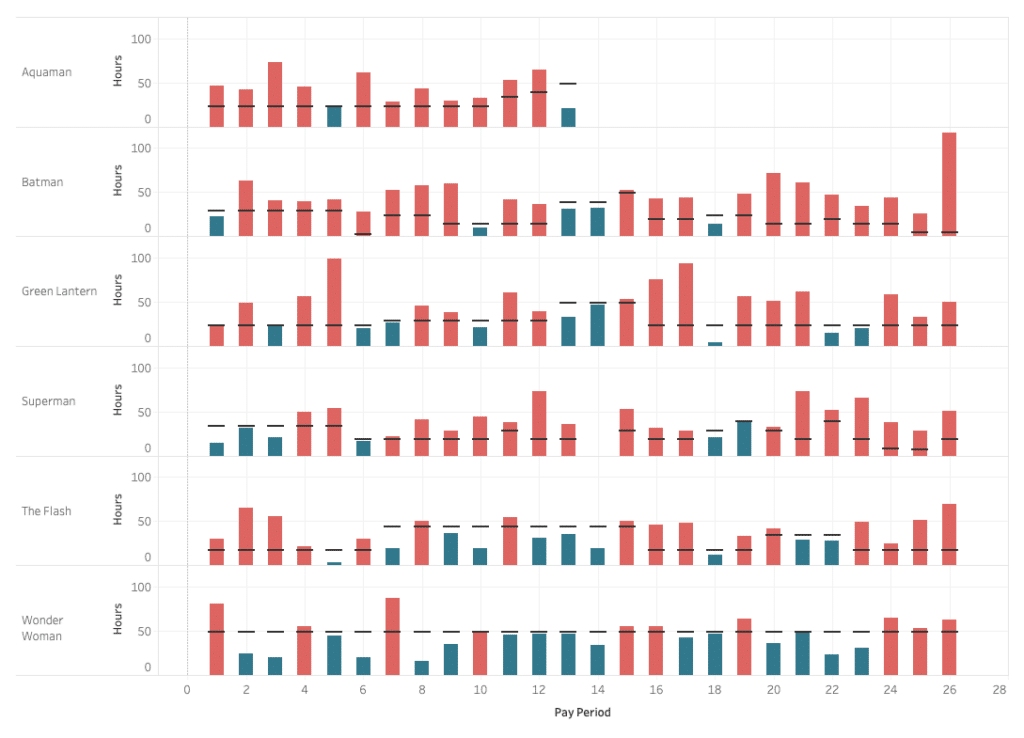
As a last step, clean up any redundant fields that aren’t needed and use an Output step to export the data. The only thing left from there is to visualize the combined data in Tableau!
Brittany Fong
Playfair Data Partner Consultant
[email protected]

Written By
Brittany Fong
Related Content
A Quick Start Guide to Tableau Prep

In this tutorial, we’ll be covering the Tableau Prep tool and how we can use it to build out data…
3 Tips for Data Quality Assurance (QA) in Alteryx

Anyone who works with data would probably say that ensuring accuracy is half the battle. While a final Quality Assurance…
Solutions from Tableau Training: How to Deduplicate Joined Rows

There are always problem-solving brainstorms at our Tableau training events, and sometimes the solutions are so relevant for all Tableau…