Solutions from Tableau Training: How to Deduplicate Joined Rows
There are always problem-solving brainstorms at our Tableau training events, and sometimes the solutions are so relevant for all Tableau users that I want to share them on a larger scale. In one such case, an attendee was trying to solve the business problem of currency conversion. They worked for a global company and needed to join a dataset containing monthly exchange rates to their primary data source. Joins in Tableau are a powerful way to add new dimensions and measures to your analysis, but without a good understanding of how they affect your dataset, you will often end up with inflated numbers. This post shares the challenge with joining multiple data sources and several solutions to ensure you are getting accurate answers, such as deduplicating rows.
How to Deduplicate Joined Rows in Tableau
The challenge of working with joined data sources in Tableau
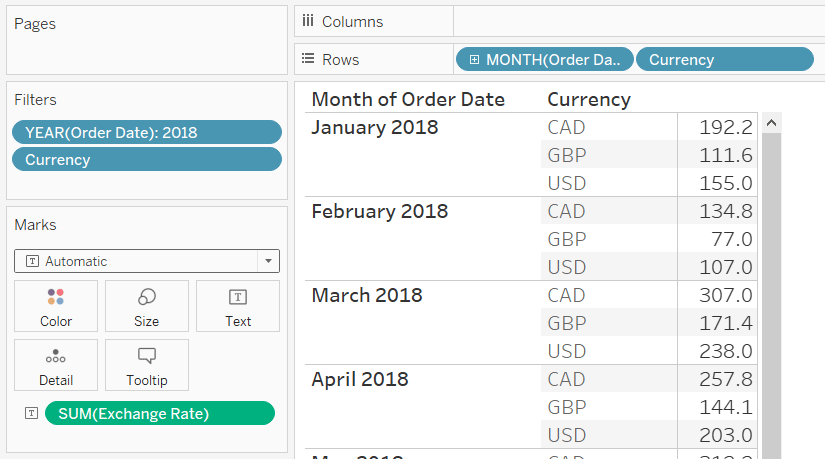
My favorite way to use joins in Tableau is to add additional fields to my analysis when my primary table and the table containing the new fields have at least one dimension in common. For example, let’s say that I want to add a column from the Returns table to the Orders table of the Sample – Superstore dataset. The join would look like this in Tableau Desktop:
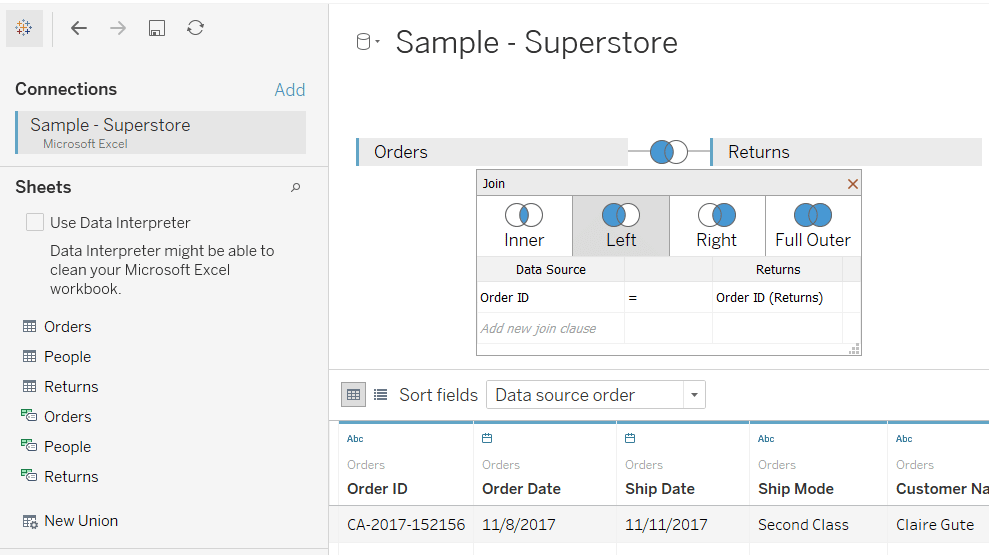
Since both tables contain the Order ID dimension, left joining the Returns table to the Orders table will add the new “Returned” column to the dataset. For each Order ID, I will have a Yes or NULL to tell me which orders were returned. I could use this new column as a flag and/or create a calculated field to count the number of returns.
![]()
The problem is that the Returns table only tells me if an order was returned at the Order ID level while the Orders table can have multiple rows per Order ID (in the case that multiple products were purchased in a single order). When this is the case, the join causes duplicate rows. For example, Order ID CA-2015-143336 contains three products, and the join causes three rows (two of them new) to be created for each product.
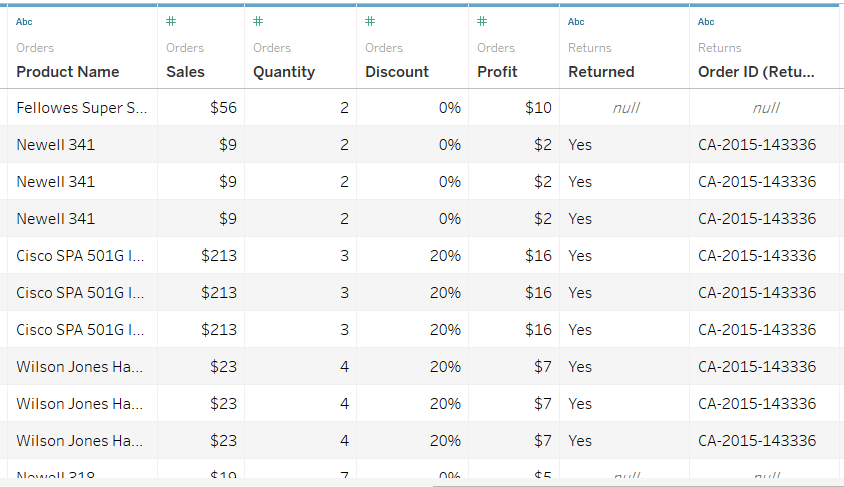
This can be very problematic for an untrained analyst because sales for the Newell 341 product in this order just went from $9 to $27.
Continue reading with a free account, or login.
Unlock this tutorial and hundreds of other free visual analytics resources from our expert team.
Already have an account? Sign In
By continuing, you agree to our Terms of Use and Privacy Policy.
How to deduplicate joined rows using Tableau’s level of detail expressions
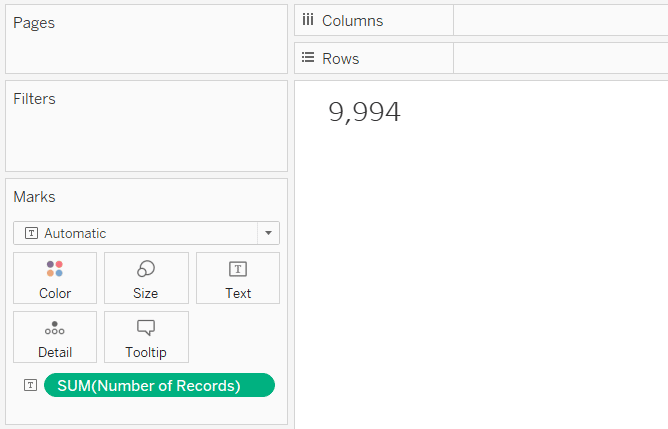
The easiest way for Tableau authors to correct this type of row duplication is to create a calculated field that uses a FIXED LOD expression to isolate one value for the most granular level of detail in the join. First, to illustrate how to identify an issue, we’ll cover one of the first things I do when working with a new data source in Tableau, which is to view the number of records. You can do this by simply placing the generated field called Number of Records onto the Text Marks Card. In the default (i.e. unjoined) Orders table, this would result in 9,994 records.
However, if I do the same check for the joined dataset, I get 12,420 records.
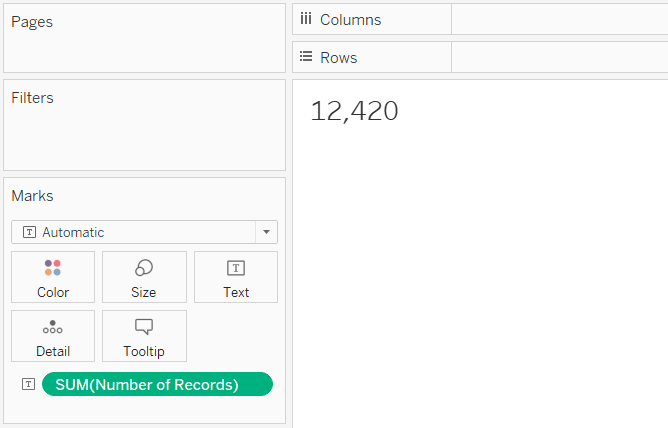
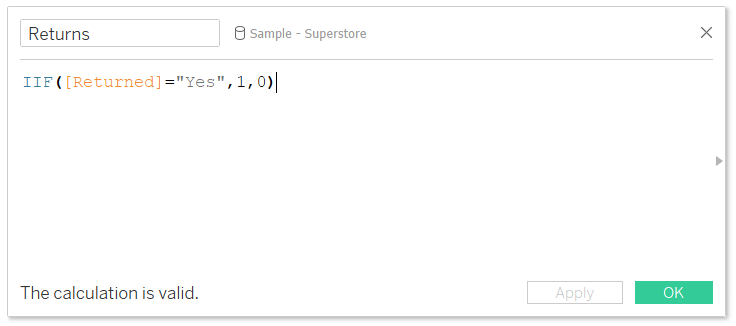
This means I have 2,426 duplicate records. This becomes problematic when we try to use this joined dataset in a real-life scenario. Let’s say I want to count the number of returned orders and have created this calculated field to tally the number one every time the Returned dimension equals “Yes”.
Placing this calculation on the Text Marks Card reveals the inflated answer of 3,226.
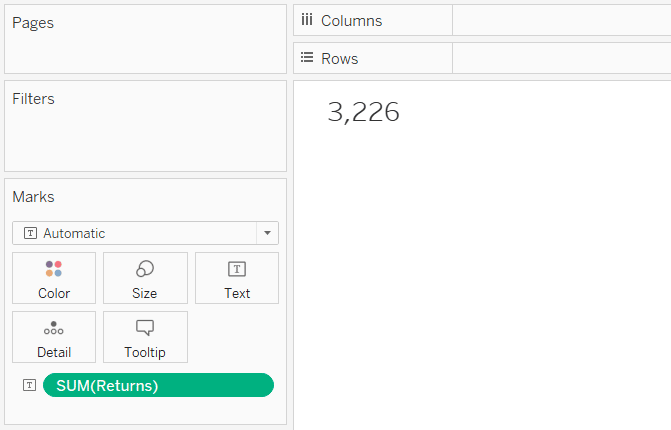
I know this number is inflated because the entire Returns tab in the Sample – Superstore Excel file only contains 800 rows. If I want to only count one return per order, I need to deduplicate the Yes tallies at the Order ID level of detail. If you use an aggregation of MIN, you will get one tally per Order ID.
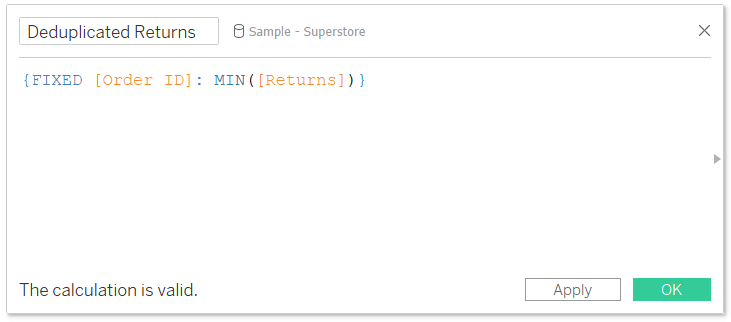
Level of detail expressions are unique in Tableau in that you can use an aggregate of an aggregate. We’ve already aggregated the number of returns per Order ID with the MIN aggregation in the calculated field, but now I can also SUM up those number of returns.
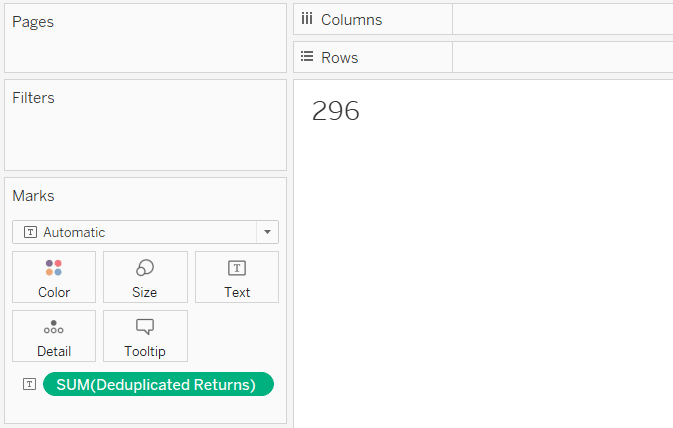
This means that there was at least one item returned in 296 distinct orders.
An Introduction to Tableau Level of Detail Expressions
How to deduplicate using a row ID field
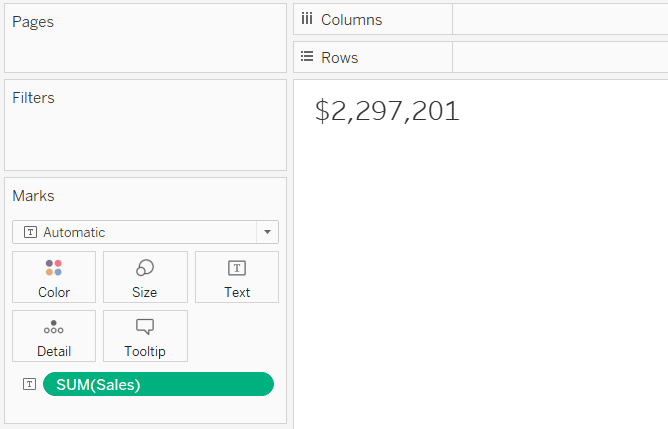
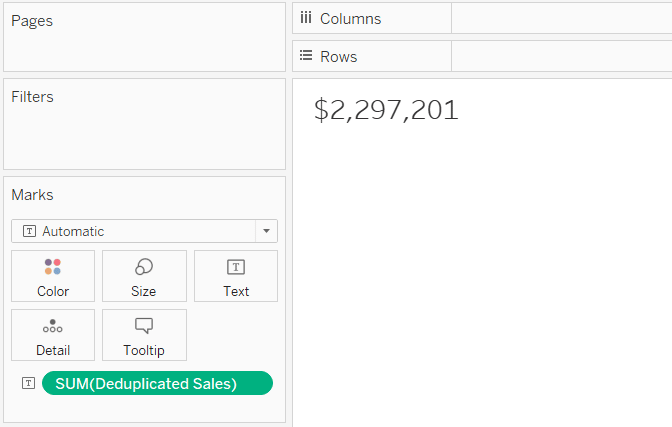
The method described to this point is useful any time you are wanting to use measures from the secondary data source, but you can do something similar to ensure you are always using deduplicated values in the primary data source. Let’s say we wanted to use the Sales measure from the primary data source; the unjoined SUM of Sales is $2,297,201.
Unfortunately, after joining the Returns table to the Orders table, we get the inflated answer of $2,901,677.

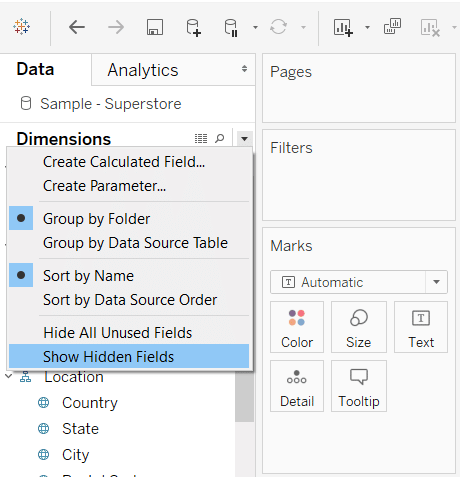
It is easiest to deduplicate rows in the primary data source when you have a dimension with unique Row IDs for each row in the data source. Little known fact, but the Sample – Superstore dataset does have such a dimension which you can access by clicking the down arrow in the top-right corner of the Dimensions area of the Data pane and choosing “Show Hidden Fields”.
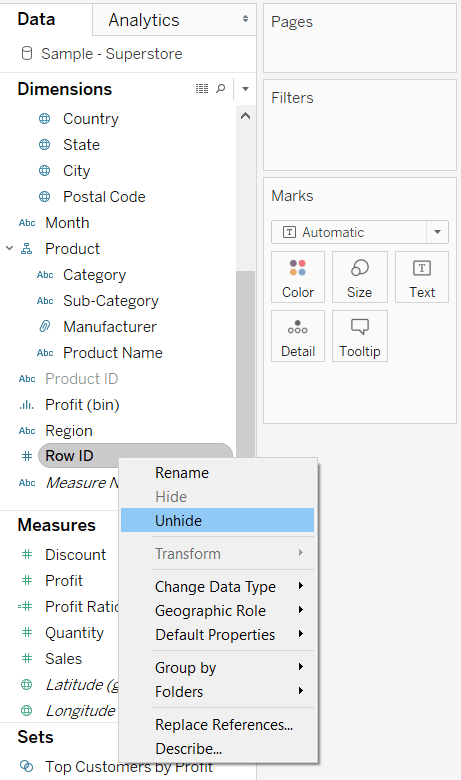
A dimension called “Row ID” will appear in gray lettering. After right-clicking on the Row ID dimension and choosing Unhide, you can use the dimension in a calculated field.
The formula for Deduplicated Sales is:
{FIXED [Row ID]: MIN([Sales])}
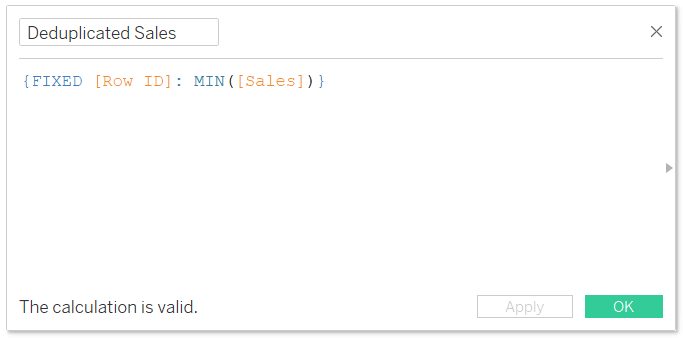
This newly Deduplicated Sales results in the expected sum of $2,297,201.
How to deduplicate using LODs with more than one dimension
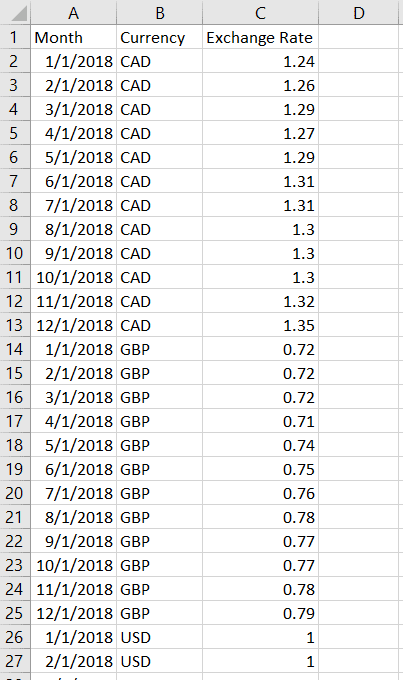
The business case described in this post’s introduction was a global business trying to do currency conversion. Their company had an exchange rate to US Dollars for two dimensions: Month and Currency. To simulate the scenario, I’ve set up this Excel file containing one year of exchange rates for Canadian Dollars and British Pounds.
Since the Sample – Superstore dataset only contains US Dollars, I’m going to pretend we are localizing currencies for analysts in our Canadian and English territories (i.e. show what USD would be in their respective local currencies).
I will left join this exchange rate table to the Sample – Superstore dataset. Fields with a data type of Date have a lot of nuances, so for ease of illustration, I have added a column to the Sample – Superstore dataset that truncates every date at the first of the month.
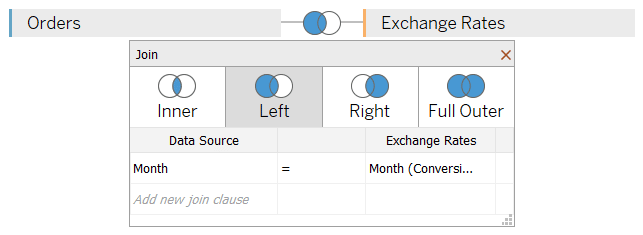
If I put a quick table together to look at 2018 exchange rates to make sure it matches the underlying Excel sheet, I once again see that the join has caused inflated values.
If I were to use this as is, my result would be way off, and we may make an inaccurate insight that leads to wasted resources in our business.
To correct the duplicate rows and inflated values caused by the join, we will use a similar LOD expression we used on the Returns table to deduplicate. The difference is that this time, we have multiple dimensions to deduplicate. To deduplicate when there is more than one dimension, simply separate all the dimensions with commas immediately after the FIXED LOD.
![]()
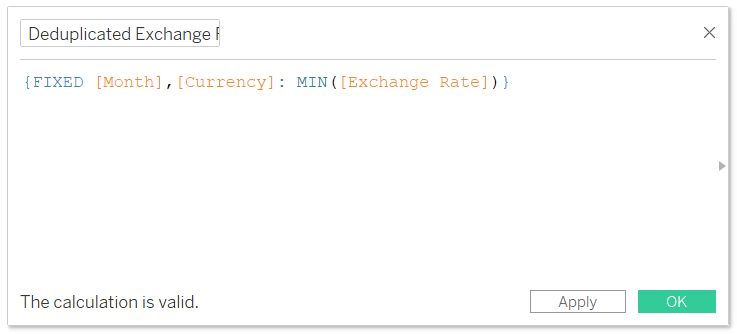
In the case of our currency conversion table, the calculation is:
{FIXED [Month],[Currency]: MIN([Exchange Rate])}
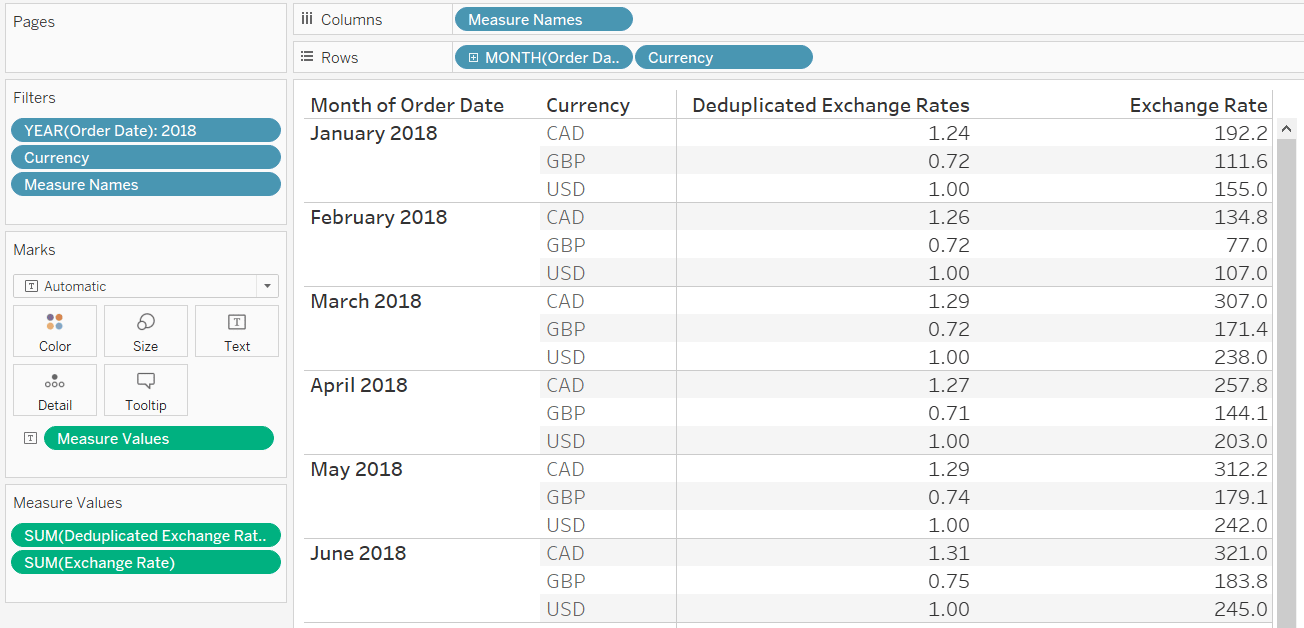
After adding this calculation to the quality assurance table, we see that things are checking out:
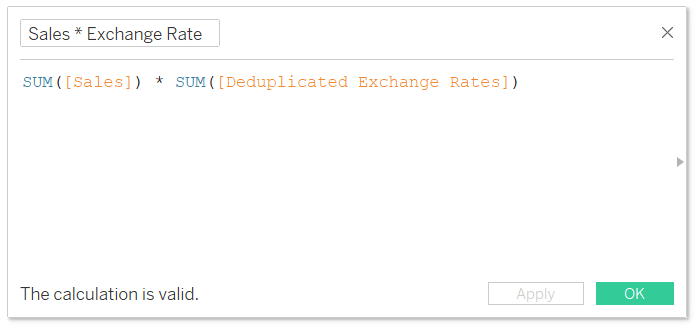
Now that I trust the exchange rate results, I can use this deduplicated calculated field in another calculated field to multiply our original monthly Sales values by the respective monthly exchange rate in each country. The calculation would be something like:
Here’s a line graph with the USD sales values on the first row and our converted sales values on the second row. On the second row, changing the Currency filter will multiply each month’s USD sales value by the appropriate monthly exchange rate to correctly localize the amounts.
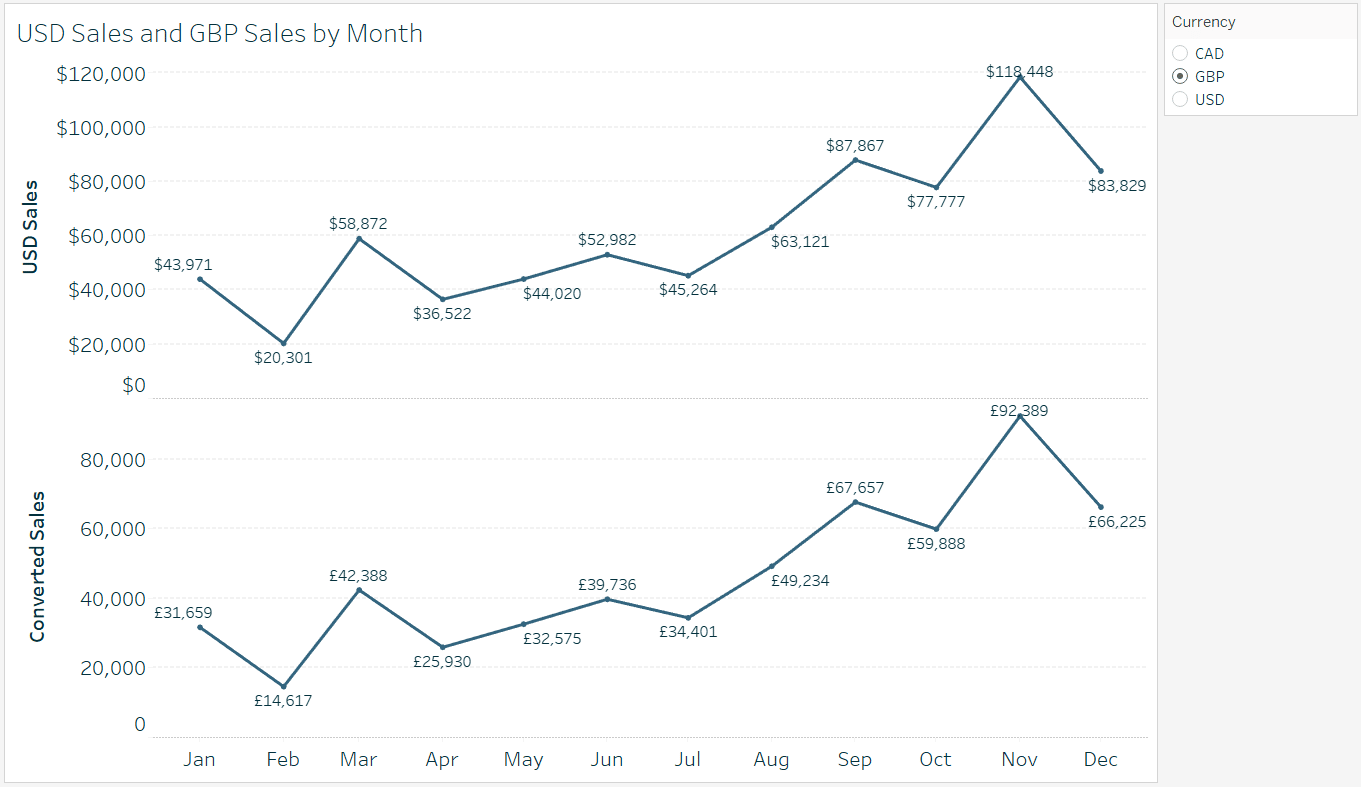
To learn how to automatically format the mark label prefixes and suffixes, see the related post, How to Dynamically Format Numbers in Tableau.
I should note that in this last example, because we are using both the Month and Currency dimensions, I could have skipped the calculated field with the LOD expression and got the correct answer by manually changing the aggregation of the Exchange Rate measure to Minimum.
However, deduplicating using Level of Detail expressions has two benefits: (1) you don’t have to constantly worry about matching the correct aggregation with the visualization’s level of detail, and (2) you are allowed an extra aggregation; we did this earlier when we aggregated an aggregate by summing up minimum values.
For one more real-world application of using LODs to deduplicate joined rows – and just for a cool trick – see the related post, How to Turn Data Normalization On and Off in Tableau.
Thanks for reading,
– Ryan


Written By
Ryan Sleeper
Related Content
Bringing Tables Together: Tableau’s Physical Layer

Welcome to our series on bringing tables together! This first article is all about the physical layer in Tableau, including…
How to Do Currency Conversion in Tableau with Google Sheets

With many organizations operating in different countries, the topic of currency conversion becomes more important for data visualization specialists. Despite…

Ryan Sleeper
Harness the Power of ‘LOD’s for Better Analyses Ryan introduces one of the most powerful analytical features of Tableau and…