Quick Start Guide to TabPy

TabPy is a Tableau feature that allows you to utilize Python scripts as calculated fields for your visualizations. It is not to replace the use of Python for complicated data engineering and machine learning tasks but can help add additional functionality while building dashboards in Tableau. TabPy allows you to utilize Python to create a measure more efficiently than having to create sometimes dozens of complex LOD and table calculations to get to the same value. Python may seem daunting to those unfamiliar, but it is a relatively straightforward language and especially with advancements in open-source AI, there are plenty of easy ways to learn it.
In my experience, TabPy can be especially useful when doing exploratory data analysis. It adds an extra dimension to what sort of insights you are able to gain from your data. You can integrate some advanced learning techniques to guide your decisions on where to continue with your analysis. In this tutorial, I will show you how to set up TabPy on your machine and a couple of ways to integrate it to your analysis.
TabPy setup
If you want to follow along with my completed workbook, then that can be found in this Google Drive folder.
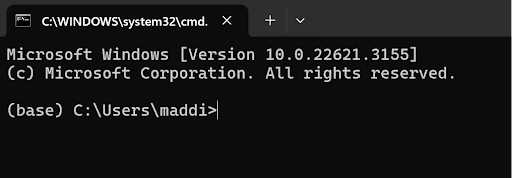
First let’s get started setting up TabPy. At this point, you should have Python installed to your computer, either directly or through Anaconda Navigator. Open up your computer command prompt, which you can do either directly on your machine base or by creating an environment for it. I prefer to use the command prompt through Anaconda Navigator, or you can find it by searching your Windows machine for Command Prompt. The window should look something like this:
Continue reading with a free account, or login.
Unlock this tutorial and hundreds of other free visual analytics resources from our expert team.
Already have an account? Sign In
By continuing, you agree to our Terms of Use and Privacy Policy.
Type “pip install tabpy” and hit enter and allow it to run.

Once that is finished running, close and reopen your command prompt and then simply type in “tabpy” to run TabPy on your computer. Keep the command prompt window open the entire time you are running TabPy in Tableau. You may be prompted if you would like to proceed without authentication. I do not currently have password authentication set up on my computer, but you can choose to do that if you wish. If you do wish to proceed without authentication, hit “y” and enter.
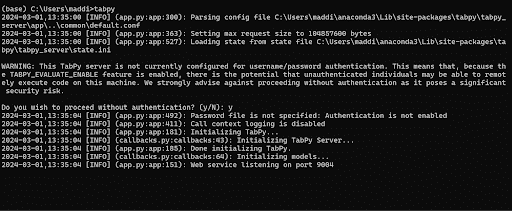
Once that is finished running, you will see on the last line it says” Web service listening on port 9004”. You will need that number to run TabPy in Tableau.
![]()
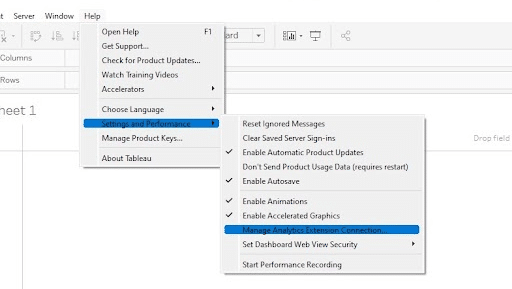
Open up Tableau and connect to the Sample-Superstore dataset. Click the Help dropdown, then Settings and Performance, and last Manage Analytics Extensions.
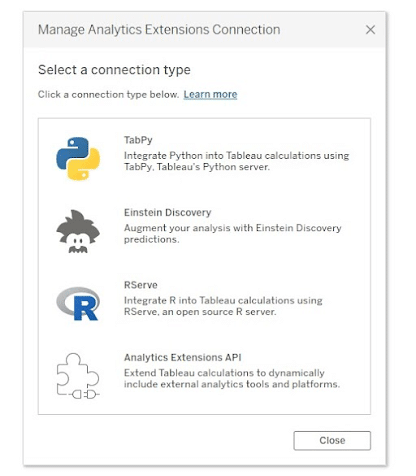
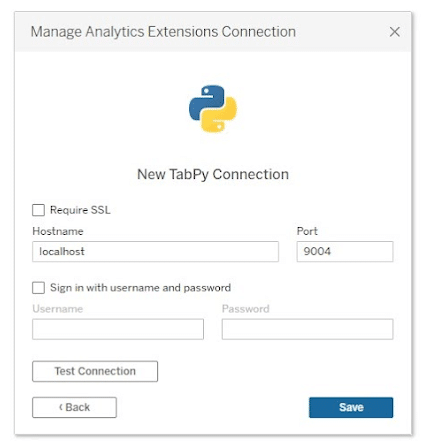
You should then see the below image on your screen. Select TabPy:
Type in “localhost” in the Hostname and “9004”, the number referenced in the command prompt, into Port. If for some reason yours is different, use that.
Hit Save and you should be notified of a successful connection:
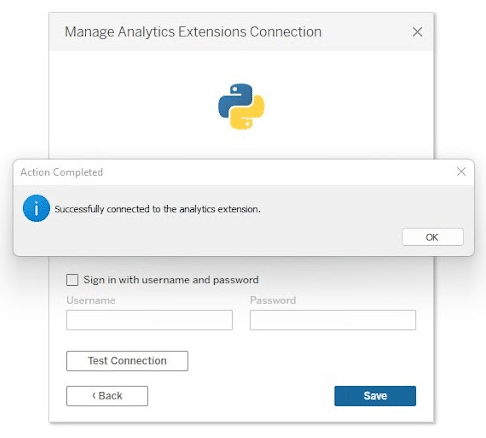
Once you have a successful connection, you can begin utilizing Python in Tableau!
Introduction to TabPy scripts
TabPy can be utilized with four different calculated field functions that specify the output type of the script.
- SCRIPT_BOOL: Returns Boolean value
- SCRIPT_INT: Returns integer value
- SCRIPT_REAL: Returns numeric value
- SCRIPT_STR: Returns string value
Based on what you want your output to be, you will choose the appropriate script function. For example, I want to use TabPy to calculate the sum of sales multiplied by five. In this case, I could choose SCRIPT_INT or SCRIPT_REAL depending on if I want decimals or not. I am going to choose SCRIPT_INT for this example. In the Python script, where you want to input a field from the data, you will denote it as _arg# with # being the number of data input. Then, in the same order you input them after the script. For example:
SCRIPT_INT(“return [x*5 for x in _arg1]”, sum([Sales]))
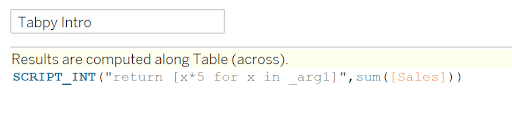
In the script, _arg1 represents Sales from the Sample-Superstore dataset. If you wanted to have an equation with Sales and Profit, then you would add in an _arg2 and sum(Profit) after sum(Sales). To check our work, I also just created a standard Tableau calculation to cross reference with:
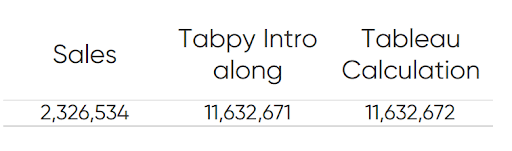
Would I implement TabPy for something like this? Probably not. But here are three use cases for utilizing TabPy in your workbooks.
The Beginner’s Guide to Basic Tableau Calculated Fields
Random number
One of my biggest gaps working in Tableau is not having the Excel equivalent of RANDBETWEEN(). However, you can use TabPy to do it with a Python script. The calculation is very simple. Say you want to randomly assign customers to different groups. You can use this script to easily do so:
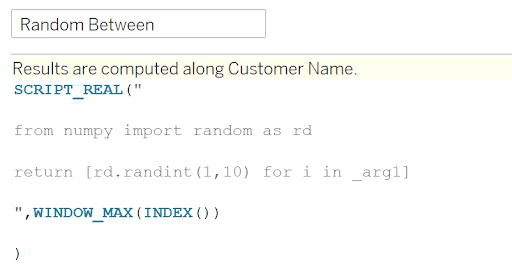
SCRIPT_REAL(“
from numpy import random as rd
return [rd.randint(1,10) for i in _arg1]
“,WINDOW_MAX(INDEX()))
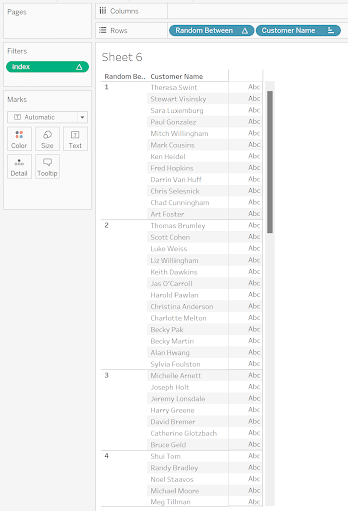
This calculation is saying that for the number of items in the view, produce a random integer in between 1 and 10. If you drag customer name to the view and this function as well, you can see your customers randomly assigned to groups 1 through 10:
Correlation coefficient
A simple, telling measure that can be a bit complicated to create in Tableau. Correlation coefficient gives insight to whether there is a relationship between two variables and is often a measure used early on in exploratory data analysis. One variation is the Pearson’s Product Moment correlation coefficient which can be denoted as:
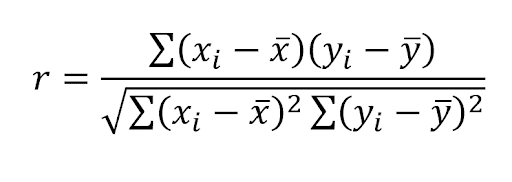
With r being the correlation coefficient and x and y being the two measures in which you want to analyze their correlation. You can see the correlation coefficient in the summary statistics when you implement a trend line, but you aren’t able to utilize that value in your visuals beyond that. Using a standard Tableau calculated field to do it would require a “hodgepodge” of nested table calculations that can be difficult to put together. There is also the Corr function in Tableau but that still can require LODs in its calculation. Using TabPy makes it as simple as below:
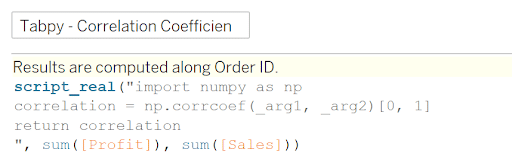
SCRIPT_REAL(“
from numpy import numpy as np
correlation = np.corrcoef(_arg1, _arg2)[0,1]
return correlation
“,SUM([Profit]), sum([Sales]))
Even if you are unfamiliar with Python, it is easy to find example scripts all over the internet. It is important to note to those unfamiliar with Python that the syntax does matter and gaining a basic understanding would be very beneficial.
![]()
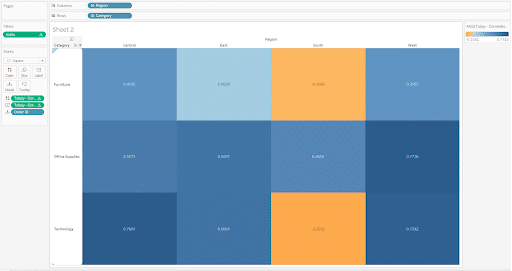
Now you have this as a calculated field you can integrate it into your analysis. Build out your view as you would like. I am going to drag Region to the Columns shelf, Category to the Rows shelf, and Order ID to the Detail property of the Marks card. Change the mark type to Square and size them as large as they can go. Then add the TabPy calculation to the Color and Label properties. I created an index table calculation on Order ID and filtered it to be at most one so that only one Order ID square was on the view for each Region and Category combination. Now you have a correlation matrix to use for your EDA.
K-Means clustering
Another more complex example is K-Means clustering. K-Means clustering is an example of an unsupervised learning method that looks to group together similar data points. If you are looking to fine-tune your model, It would be best to take it out of TabPy and do it directly in Python. But, for some data exploration you can utilize. TabPy to run a simple model and then use the results in your visualization. Here is an example of a script to run K-Means clustering:
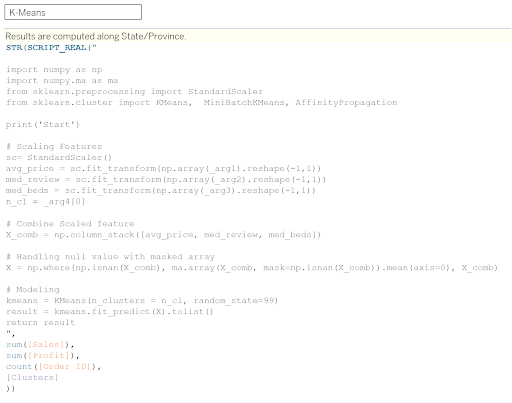
The logic is as follows:
STR(SCRIPT_REAL(“
import numpy as np
import numpy.ma as ma
from sklearn.preprocessing import StandardScaler
from sklearn.cluster import KMeans, MiniBatchKMeans, AffinityPropagation
print(‘Start’)
# Scaling Features
sc= StandardScaler()
avg_price = sc.fit_transform(np.array(_arg1).reshape(-1,1))
med_review = sc.fit_transform(np.array(_arg2).reshape(-1,1))
med_beds = sc.fit_transform(np.array(_arg3).reshape(-1,1))
n_cl = _arg4[0]
# Combine Scaled feature
X_comb = np.column_stack([avg_price, med_review, med_beds])
# Handling null value with masked array
X = np.where(np.isnan(X_comb), ma.array(X_comb, mask=np.isnan(X_comb)).mean(axis=0), X_comb)
# Modeling
kmeans = KMeans(n_clusters = n_cl, random_state=99)
result = kmeans.fit_predict(X).tolist()
return result“,
sum([Sales]),
sum([Profit]),
count([Order ID]),
[Clusters]))
How to Do Customer Segmentation with Dynamic Clustering in Tableau
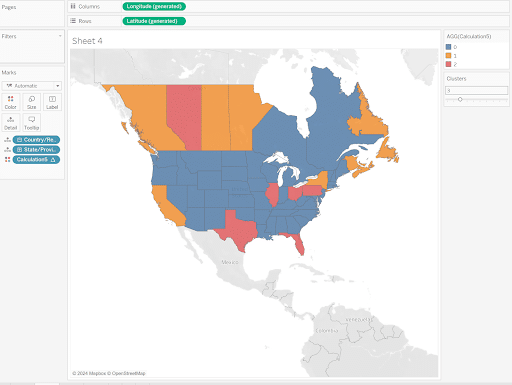
This calculation is aiming to cluster states based on similarities in Sales, Profit and Number of Orders. In the script, the Clusters parameter was added to allow the user to change the number of clusters without having to access the calculated field. Create a filled map on the view, add State to Detail and K-Means to Color to see how the states are clustered.
Now that you have learned how to set up TabPy on your computer and a few ways to utilize it, I encourage you to explore how you can use it to level up your analysis.
Stay after it,
Maddie

Written By
Maddie Dierkes

Peer Review
Ethan Lang
Director, Analytics Engineering
Related Content
How to Do Customer Segmentation with Dynamic Clustering in Tableau
Tableau has a few different built-in analytics features that allow you to both summarize and model your data in various…
Ethan Lang
Detecting Outliers in Non-Normalized Data In this tutorial, Ethan will explain how to implement the Median Absolute Deviation equation in…
The Benefits of Data Visualization for Data Scientists

At Playfair Data, we have covered dozens of ways to visualize data, and shared our tips, tricks and best practices,…