Tableau Prep Builder and Tableau Prep Conductor for Data Automation

With the ever growing emphasis on data visualization and analysis, it is easy to overlook the backend processes and tools. Data pipelines and ETL processes provide the data that is essential to a successful analysis. This post will take you through a high level overview of Tableau Prep Builder, Tableau Prep Conductor, and how the two work best together to create optimized data processes.
What is Tableau Prep Builder?
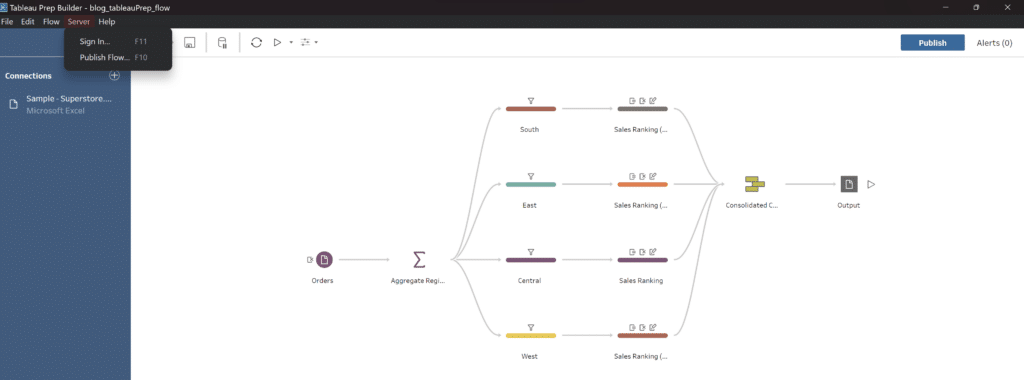
For those unfamiliar with either Tableau Prep Builder, Tableau Prep Conductor, or who are just branching into ETL solutions, Tableau Prep is a software that can be used to clean, aggregate and shape data. Through a drag and drop UI, users are able to import data from a variety of input types through the “Connections” menu. From there, users are provided with a blank canvas to arrange data connections and cleaning steps as desired. Once complete, users have the ability to write outputs locally to your computer or to Tableau Server.
Continue reading with a free account, or login.
Unlock this tutorial and hundreds of other free visual analytics resources from our expert team.
Already have an account? Sign In
By continuing, you agree to our Terms of Use and Privacy Policy.
If you are interested in learning more about Tableau Prep Builder and how to get started working with data, check out my other post where I walk through how to set up Tableau Prep:
A Quick Start Guide to Tableau Prep
How Builder fits into a data engineering pipeline
When we think of data engineering, a lot of different ideas and concepts come to mind. For this tutorial, I want to focus our attention on the concept of data pipelines, starting with what a data pipeline is and why you might want to build one.
When I think of a pipeline, I like to envision a literal pipe that we run our data through. As our data runs through this pipe, we perform different changes to it depending on our end use case for this data.
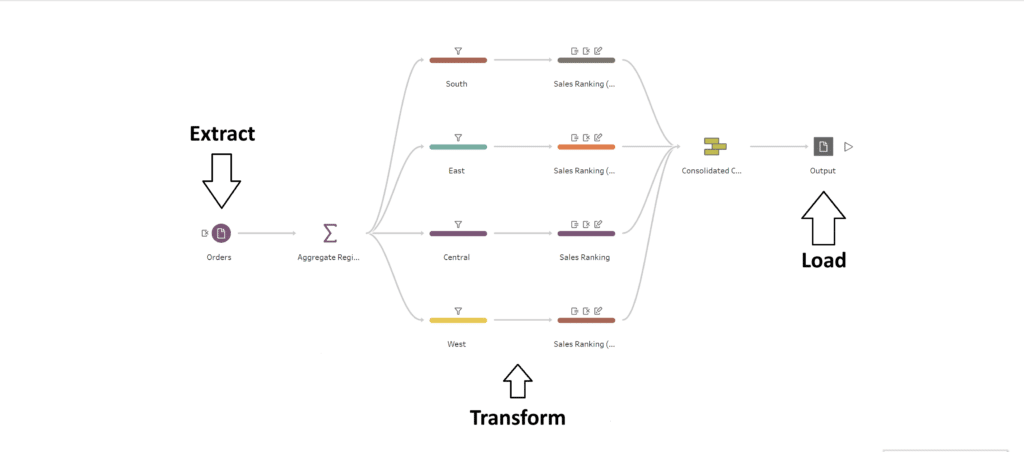
The term ETL stands for Extract, Transform and Load which is exactly what we are going to be doing from beginning to end in our pipeline. We’ll first start by extracting our data from a source, such as a local file or database. From there, we’ll transform that data into a more normalized format by cleaning out values we don’t want and arranging it into the shape we need for our analysis. Finally, once our data has been transformed into our desired output, we are at the end of our pipe and are ready to load our data to some external source, such as a .hyper to use for a Tableau dashboard, or to a database as a new table.
It is worth noting that once we have loaded our data, we should run some sort of quality check to assure that our data looks exactly the way we envisioned it would. Tableau Prep is great because it allows us to really easily build pipelines (also referred to as workflows).
Now that we’ve covered what a data pipeline looks like, let’s discuss some practical applications and reasons to build a data pipeline, as opposed to manually updating the data ourselves.
3 Tips for Data Quality Assurance (QA) in Alteryx
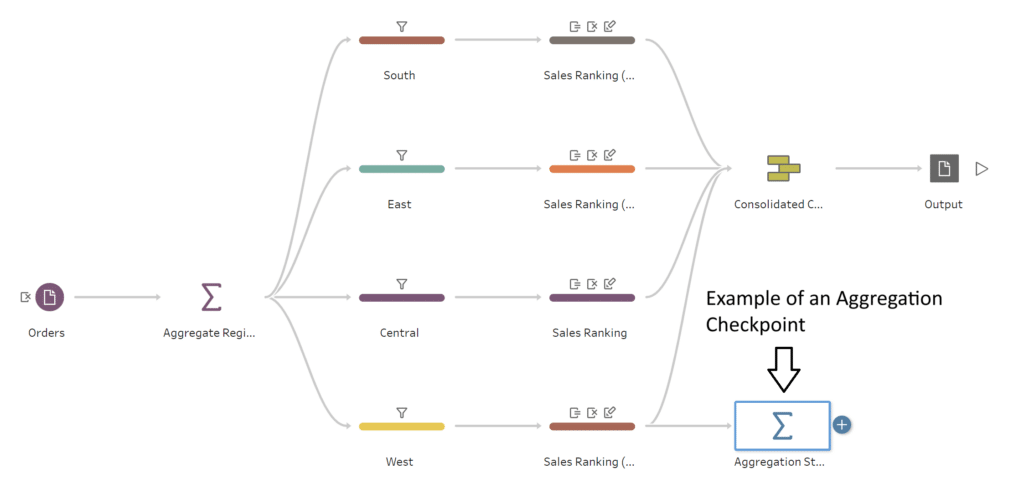
Data pipelines really shine when it comes to repeatable tasks and quality assurance. For example, let’s say you have a report that you receive weekly that needs to be scrubbed for Nulls and inconsistent values. Instead of repeatedly doing this task every time your data source is updated, you could design a pipeline that looks for the most recent file and intakes it while automatically performing the necessary transformations, freeing you up to focus on other tasks. The other aspect that I find really helpful is the ability to create quality checkpoints at different stages in your pipeline.
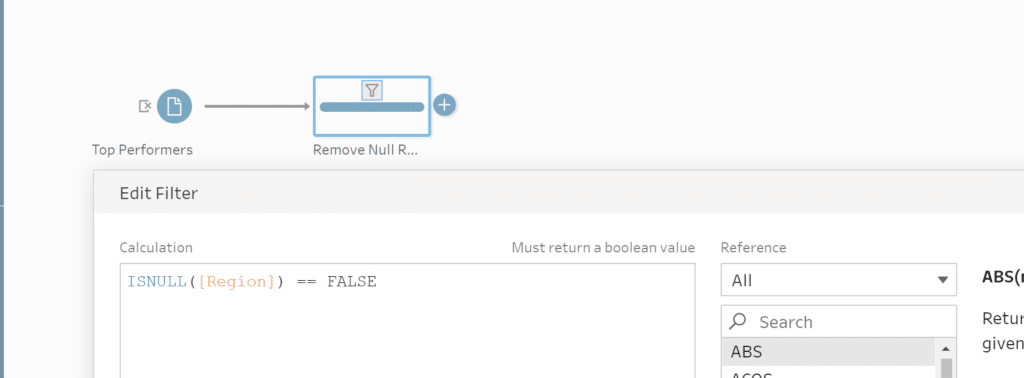
We discussed how our transformation stage could be used to clean and shape our data, but another useful aspect is the QA functions that we can build into there too. Let’s say we are working with sales data that we want to aggregate from the city level to the county level. We could implement different checkpoints where we aggregate our total sales to make sure that everything stays consistent and does not accidentally get duplicated or reduced throughout our transformation process.
While this was a basic review of these concepts, I hope it will give you some ideas as to how you might be able to make the pipelines you build more robust.
What is Tableau Prep Conductor?
Concepts of Orchestration and Automation
Let’s take the idea of a data pipeline a step further by exploring automation and orchestration. Seeing as a data pipeline is just a series of steps combined into a process, it makes sense that the next natural step would be to find a way for that process to run autonomously without the need for manual intervention. With data pipelines, we can achieve this level of autonomy by using a server of some sorts.
In the example of Tableau Prep, we can publish a completed flow to Tableau Cloud or Tableau Server that we have access to by using the menu here:
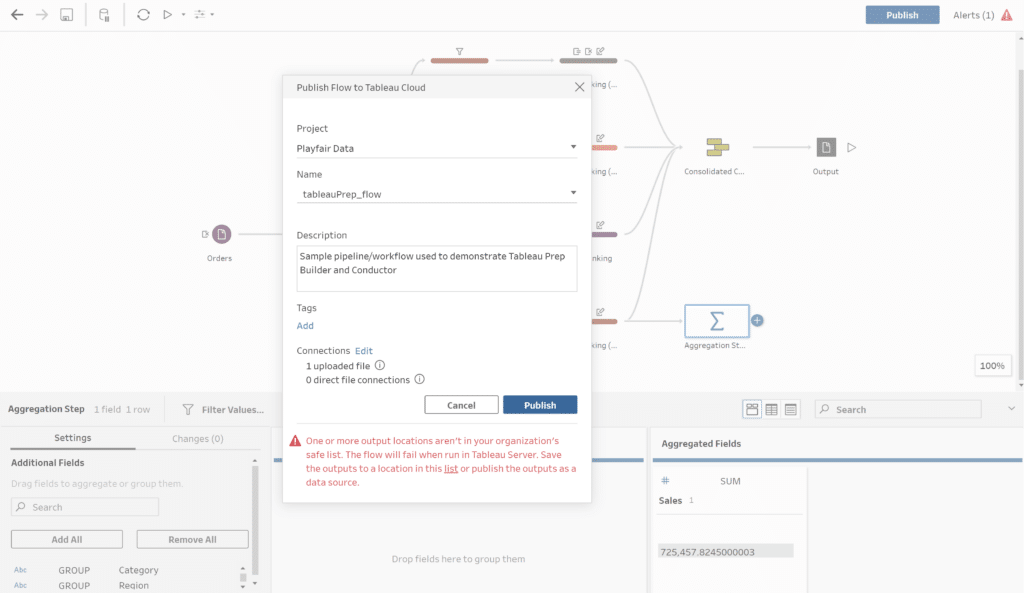
Once we have published our flow, we can configure an automated cadence for this flow to run on without needing to intervene at all.
Orchestration takes this one step further. Picture a symphony all coming together to play a song where at the front of the group you have the conductor signaling and arranging all of the sounds so that they work together to produce the desired sound; data orchestration can be thought of exactly like this. With orchestration we can essentially manage dependent pipelines or processes to run in a way that is most beneficial.
How Conductor fits into a data engineering pipeline
We discussed Tableau Prep Builder when it came to building data pipelines, now let’s take a look at Tableau Prep Conductor and how it fits into automating and orchestrating our pipelines.
As a data engineer, whenever I build out a new pipeline or process, my end goal is always centered around automation. Automating our pipelines allows us the freedom to move onto new tasks or objectives without getting caught in a cycle of time-consuming repeatable tasks. Tableau Prep Conductor enables us to automate our flows in an easy and user-friendly way.
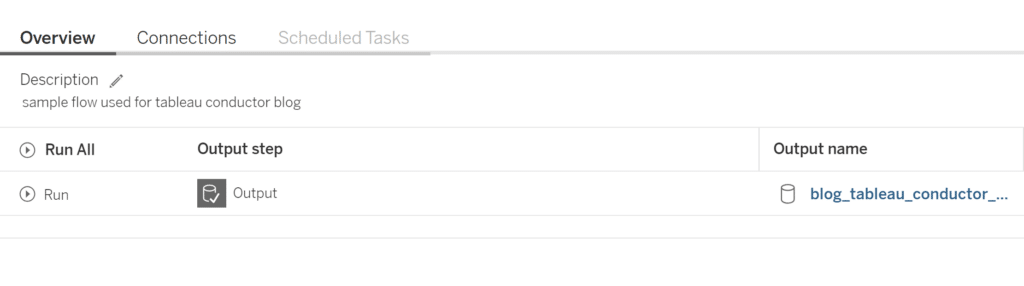
Once a flow has been published to Tableau Server, we can schedule a time and cadence for this pipeline to be run by navigating to the published flow and clicking on the ‘Scheduled Tasks’ tab. (Note: Tableau Prep Conductor does require that you have the Data Management Add-on for your Tableau Server).
Now that we have our Prep workflow scheduled, let’s talk about orchestration. Let’s say that we have a few different local Excel files from different groups that we want to standardize and combine so that we can load them into a database table.
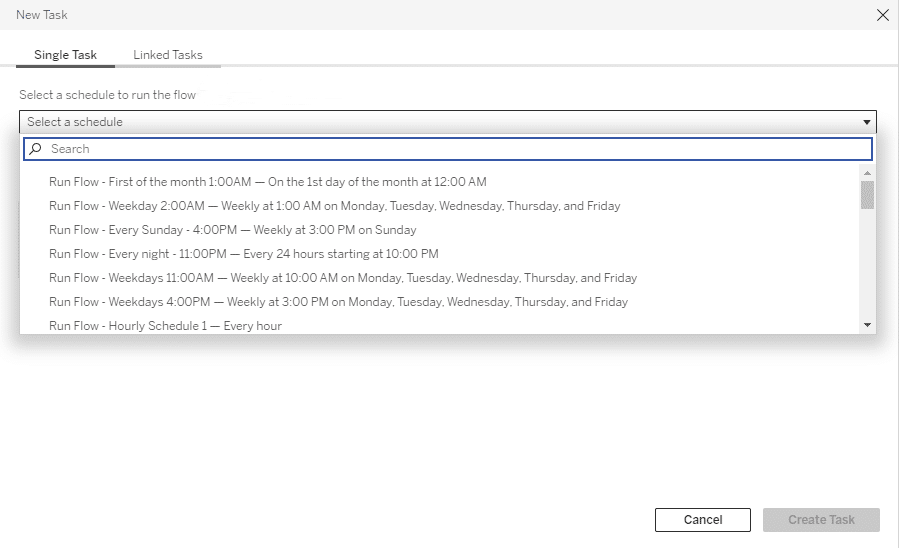
From a high-level, to tackle this challenge, we might want to first start by building out pipelines to handle each of our input files and a final one to consolidate each of the outputs into one dataset that then writes to our database table. From there we would publish each of these pipelines to Tableau Server and use Tableau Prep Conductor to both automate each workflow and create links between them so that our pipeline that updates our database table does not run until our previous pipelines have successfully extracted our input files into a usable format. You can find the setting to do this by going back to ‘Scheduled Tasks’ then to ‘New Task’ and finally clicking on the ‘Linked Tasks’ tab of the menu that pops up.
Combining Builder and Conductor
We have now explored both Tableau Prep Builder and Tableau Prep Conductor. Let’s take a final review of how they cooperate and how we can best maximize these tools together. To do this, I’d like to explore a hypothetical use case and walk through how Prep Builder and Prep Conductor fit into the solution. In this scenario, we have a dashboard for a stakeholder that looks to analyze profit, sales and cost data from the North American, European and Asian markets.
The datasets for each of these regions come from a separate team and are not consistent in formatting. The end goal is to have each of these datasets consolidated so that we can build a reporting dashboard that updates every month when new input files for the regions are sent out. We can accomplish this goal using both Tableau Prep Builder and Tableau Prep Conductor in tandem. First, we start by building out pipelines to clean each of the respective regional inputs using Prep Builder and store the outputs on Tableau Cloud.
Next, we make an additional flow that uses the cleaned files as inputs, unions them all together and pushes a final consolidated data source to Tableau Cloud. That data source can then be read by Tableau Desktop. In order to make sure our data is fresh every month, we would use the scheduling options available with Conductor to make sure all of our flows run every month and that our flow consolidating all of our inputs only runs once our first flows complete successfully.
While I always appreciate anyone taking the time to read my posts, through my experience, nothing beats hands-on experience. Don’t be afraid to get your hands dirty and play around with the settings of both Prep Builder and Prep Conductor so you can form an even better understanding of how they work together.
Thank you again for reading and look forward to catching you on the next one!
Nick

Written By
Nick Cassara

Peer Review
Ariana Cukier
Assoc. Director, Data Engineering

Peer Review
Felicia Styer
Assoc. Director, Analytics Solutions
Related Content
A Quick Start Guide to Tableau Prep
In this tutorial, we’ll be covering the Tableau Prep tool and how we can use it to build out data…

Ryan Sleeper
Start on the right foot by properly preparing data for Tableau The single biggest barrier to Tableau adoption is properly…
9 Quick Alteryx Tips to Optimize Your Data Workflows
When beginning to develop an Alteryx workflow, sometimes I find myself asking, where should I start? What happens next? How…