Tableau Tip: How to Automatically Change Date Granularity Based on Days in Range
I’ve shared before how to let your end users change the date part of a line graph in Tableau. Then this tactic was made even better with Tableau’s Parameter Actions Extension, which allowed the user to change the date part using a button. These are both useful techniques for quickly making line graphs more and less granular in Tableau. By the way, parameter actions are a standard feature in Tableau Desktop 2019.2 (coming soon) so you will no longer need to download and install the extension. Well, let’s make this tactic better once again by automatically changing the date granularity to the most appropriate date part based on the number of days in the selected date range. This post shows you how to change the date part of a line graph from day, to week, to month, based on if there are 30 or fewer, 90 or fewer, or more than 90 days on the view, respectively.
How to Dynamically Change Date Parts in Tableau
Introduction
This approach requires five short steps: (1) a start date parameter, (2) an end date parameter), (3) a calculated field to compute the number of days in the selected range, (4) a date filter that keeps only the selected dates on the view, and (5) a calculated field to appropriately truncate the date being used in a line graph.
![]()
If you are already using parameters to normalize your date ranges on the same axis, you will have already completed the first three steps.
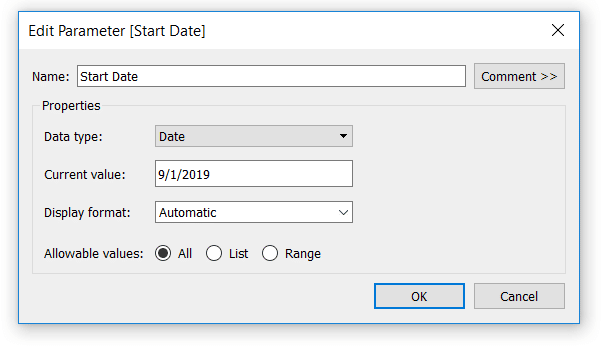
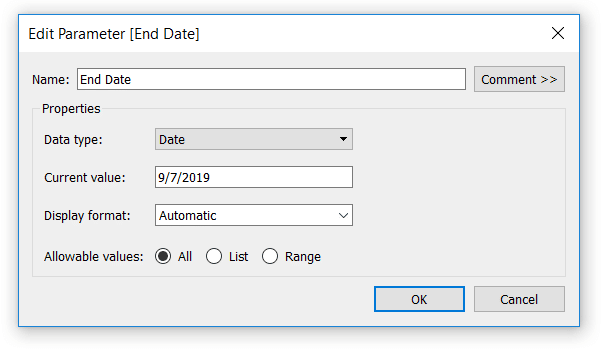
First, set up your start date and end date parameters. These are simply parameters created with a data type of Date; here’s how mine look with a default date range of 9/1/2019 – 9/7/2019:
- Start Date Parameter
- End Date Parameter
An Introduction to Tableau Parameters
Continue reading with a free account, or login.
Unlock this tutorial and hundreds of other free visual analytics resources from our expert team.
Already have an account? Sign In
By continuing, you agree to our Terms of Use and Privacy Policy.
Compute the days in range
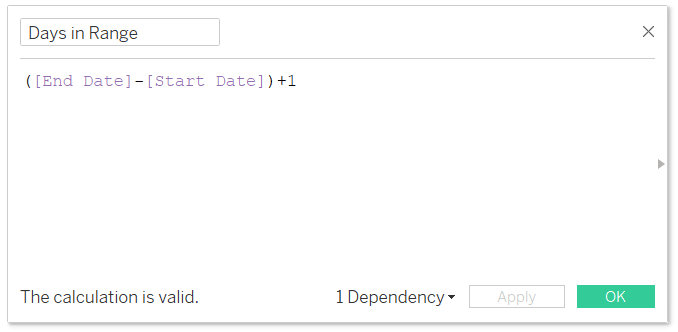
Next, create a calculated field that computes the number of days in this selected range. The formula is simply ([End Date] – [Start Date])+1. The +1 ensures we capture the current day, because if you were to set the range to just one day (i.e. 9/1/2019 – 9/1/2019) the result would be zero.
- Calculated Field that Computes the Number of Days in the Range
Create the date filter
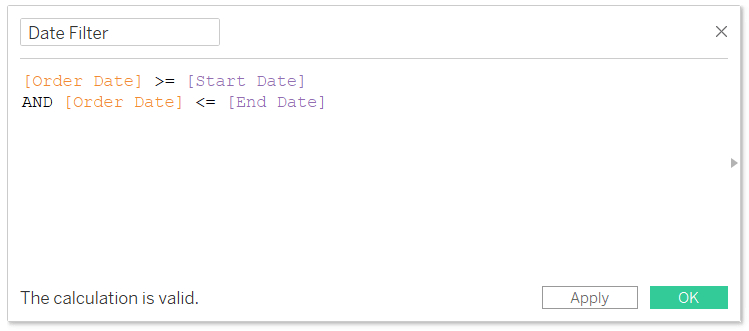
When you use parameters to filter date ranges, you don’t add a traditional discrete or continuous date filter to the Filters Shelf. Therefore, to keep only the selected dates on the view, we need a calculated field that will act as our date filter. This is the Boolean formula:
[Order Date] >= [Start Date] AND [Order Date] <= [End Date]
I’m using the Sample – Superstore dataset so my date field is called “Order Date”, but you would replace that field with your own date field. The Start Date and End Date fields in this formula are the parameters from the first two steps above.
- Calculated Field that Filters Dates to the Selected Range
The key calculated field for date granularity
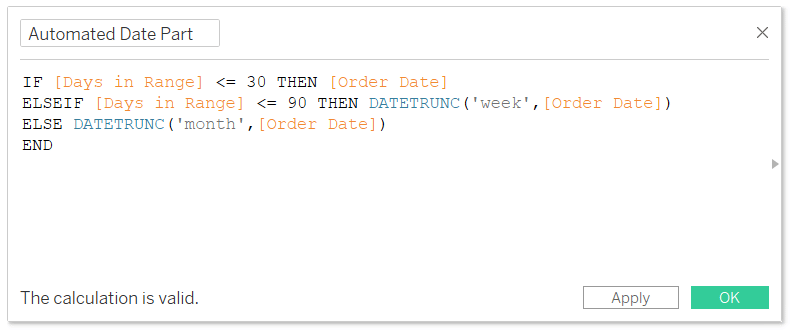
The final calculated field needed is where the magic happens. This will look at the number of days in the range (computed in step 3), and based on that number, will truncate the date field at the most appropriate level. For this example, let’s say that when there are: (1) fewer than 31 days in the range, we’ll look at days, (2) more than 30 days and fewer than 91 days in the range, we’ll look at weeks, and (3) more than 90 days in the range, we’ll look at months.
The calculation is:
IF [Days in Range] <= 30 THEN [Order Date]
ELSEIF [Days in Range] <= 90 THEN DATETRUNC(‘week’,[Order Date])
ELSE DATETRUNC(‘month’,[Order Date])
END
Of course, you can replace the quantitative thresholds in this calculation with whatever works best for your business.
- Calculated Field that Automatically Truncates Dates
Now we’re ready to create the view. Here’s how a line graph looks with Sales on the Rows Shelf, my Automated Date Part calculated field on the Columns Shelf, and my Date Filter calculated field on the Filters Shelf. I’ve also shown both the Start Date and End Date parameter controls.
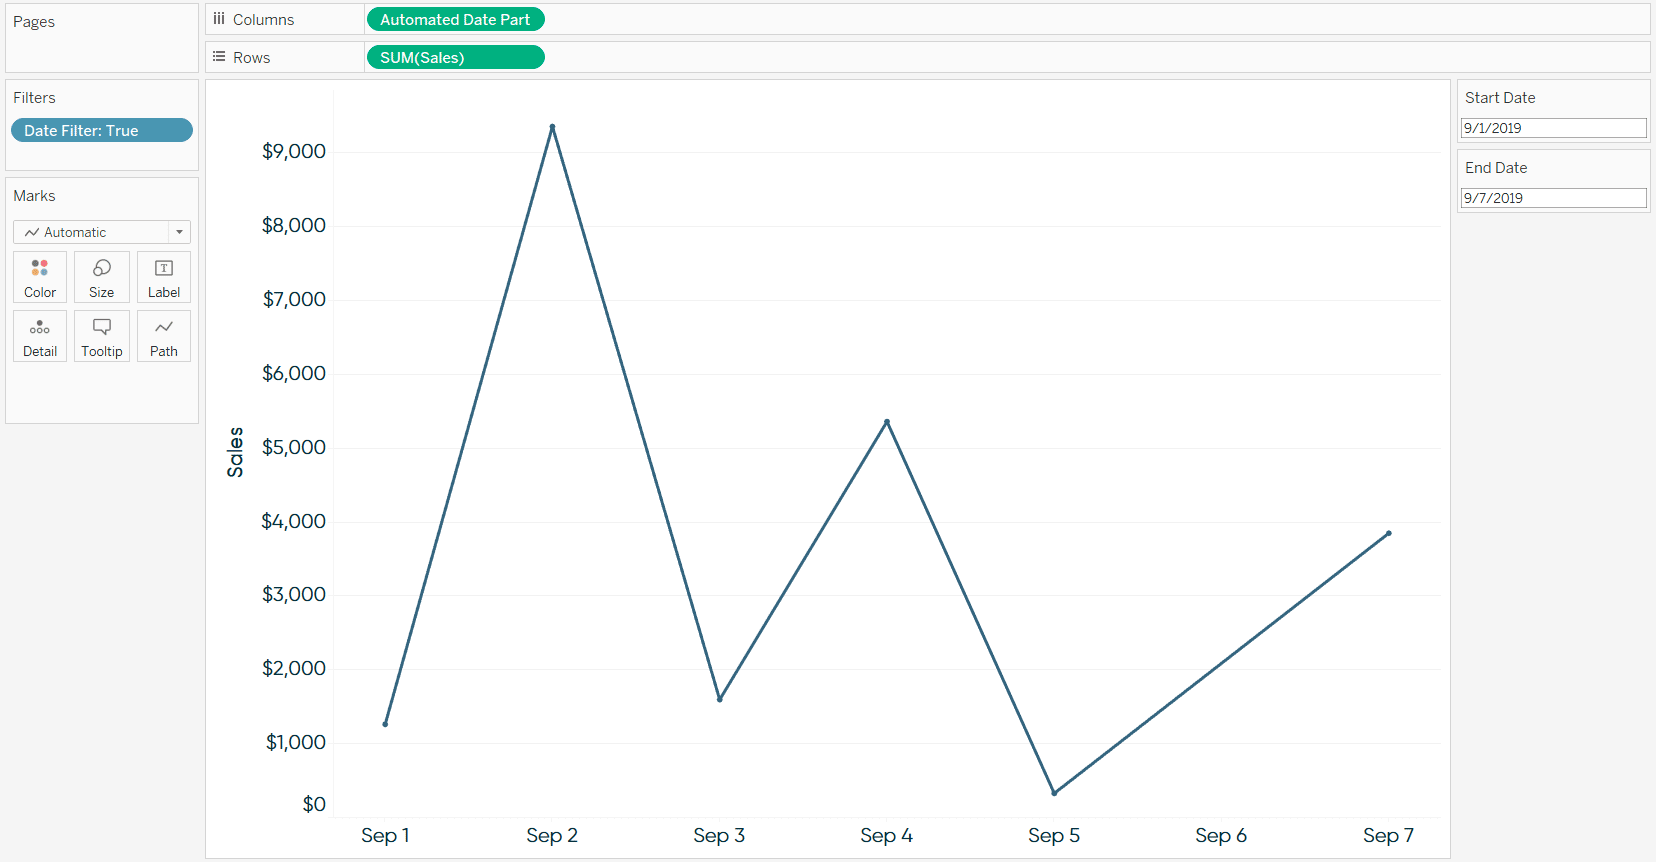
Note that the Date Filter is set to True, keeping only the days that match the parameter control selections.
Also, note that the Automated Date Part field is set to Continuous Exact Date. We don’t want to choose a specific date part because that will now be automatically controlled by the calculated field from step 5, based on the number of days in the selected range.
![]()
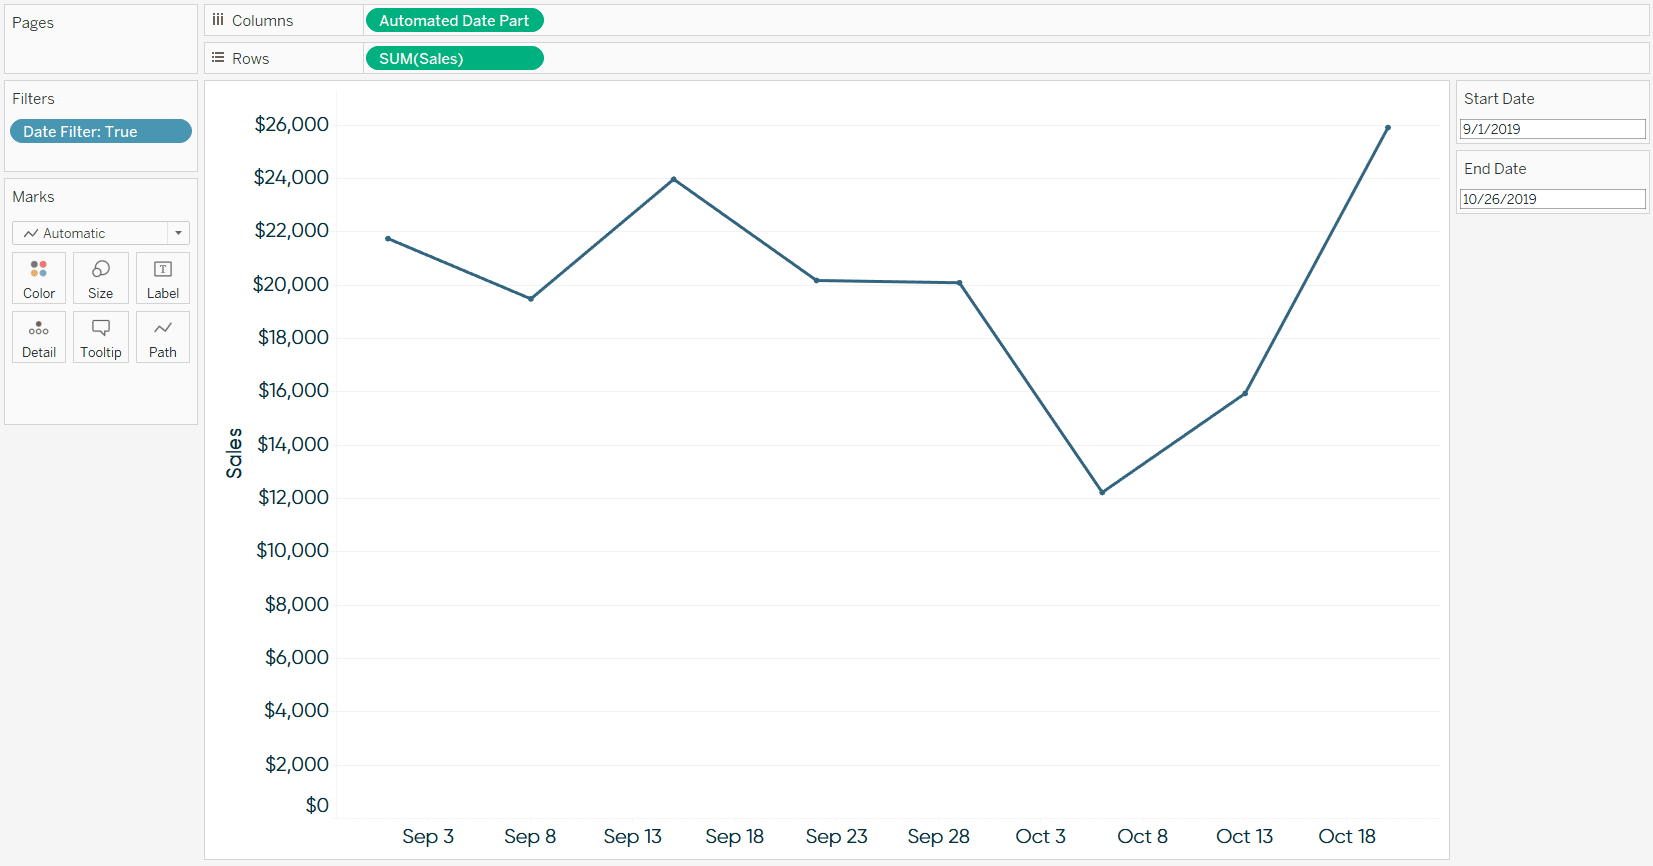
Now if I choose a date range greater than 30 days but fewer than 90 days – say 9/1/2019 through 10/26/2019 – the line graph will automatically update to look at weeks:
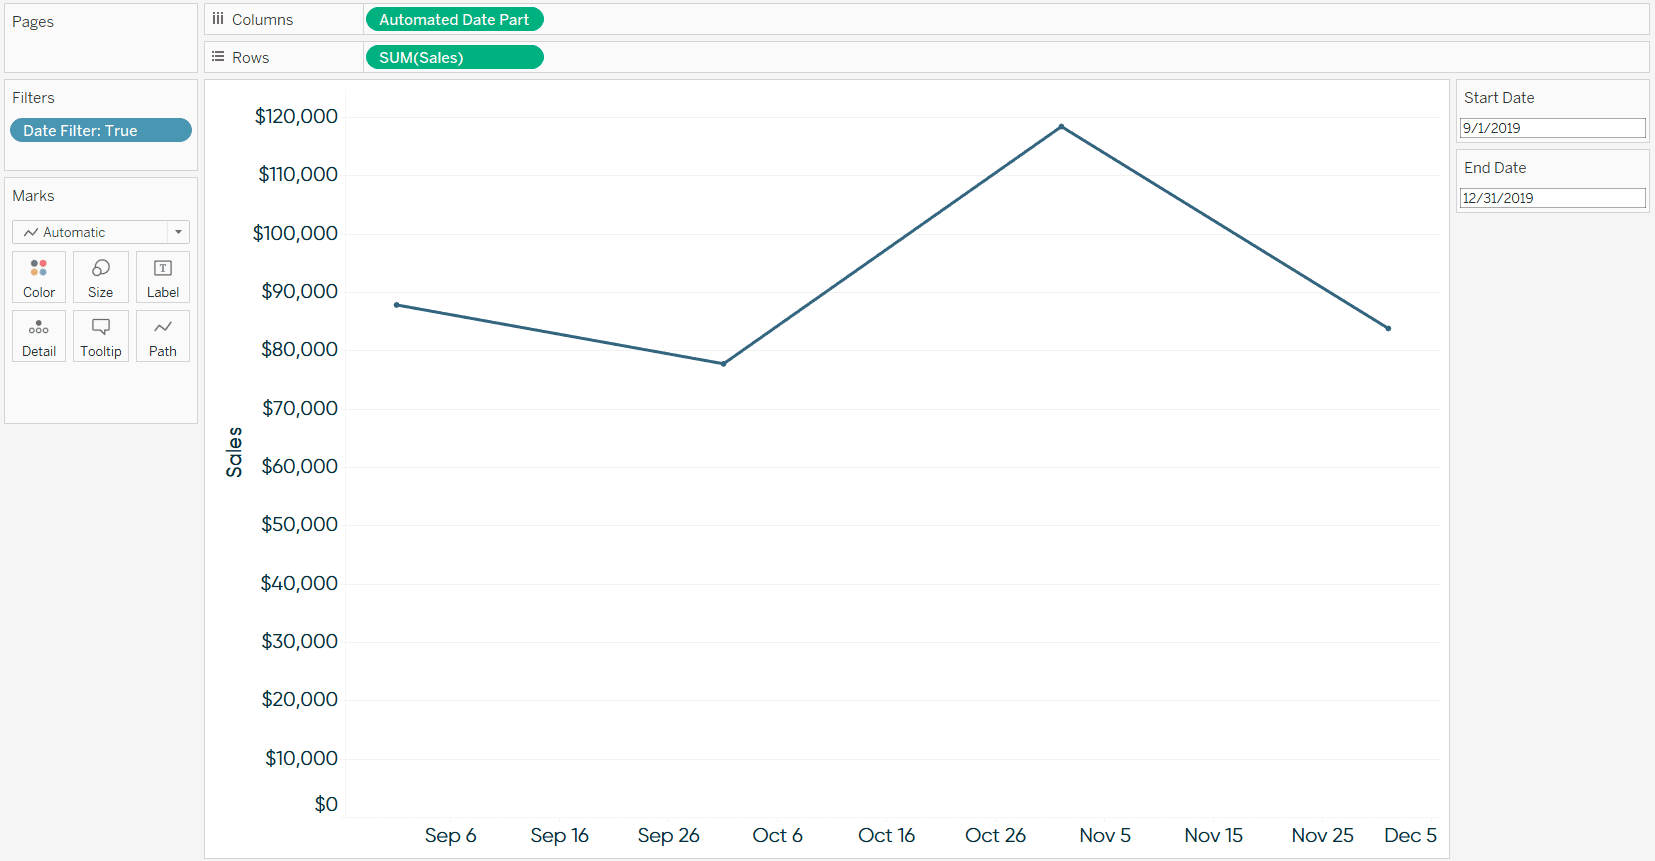
If I choose a range greater than 90 days – say 9/1/2019 through 12/31/2019 – the line graphs will automatically update to look at months:
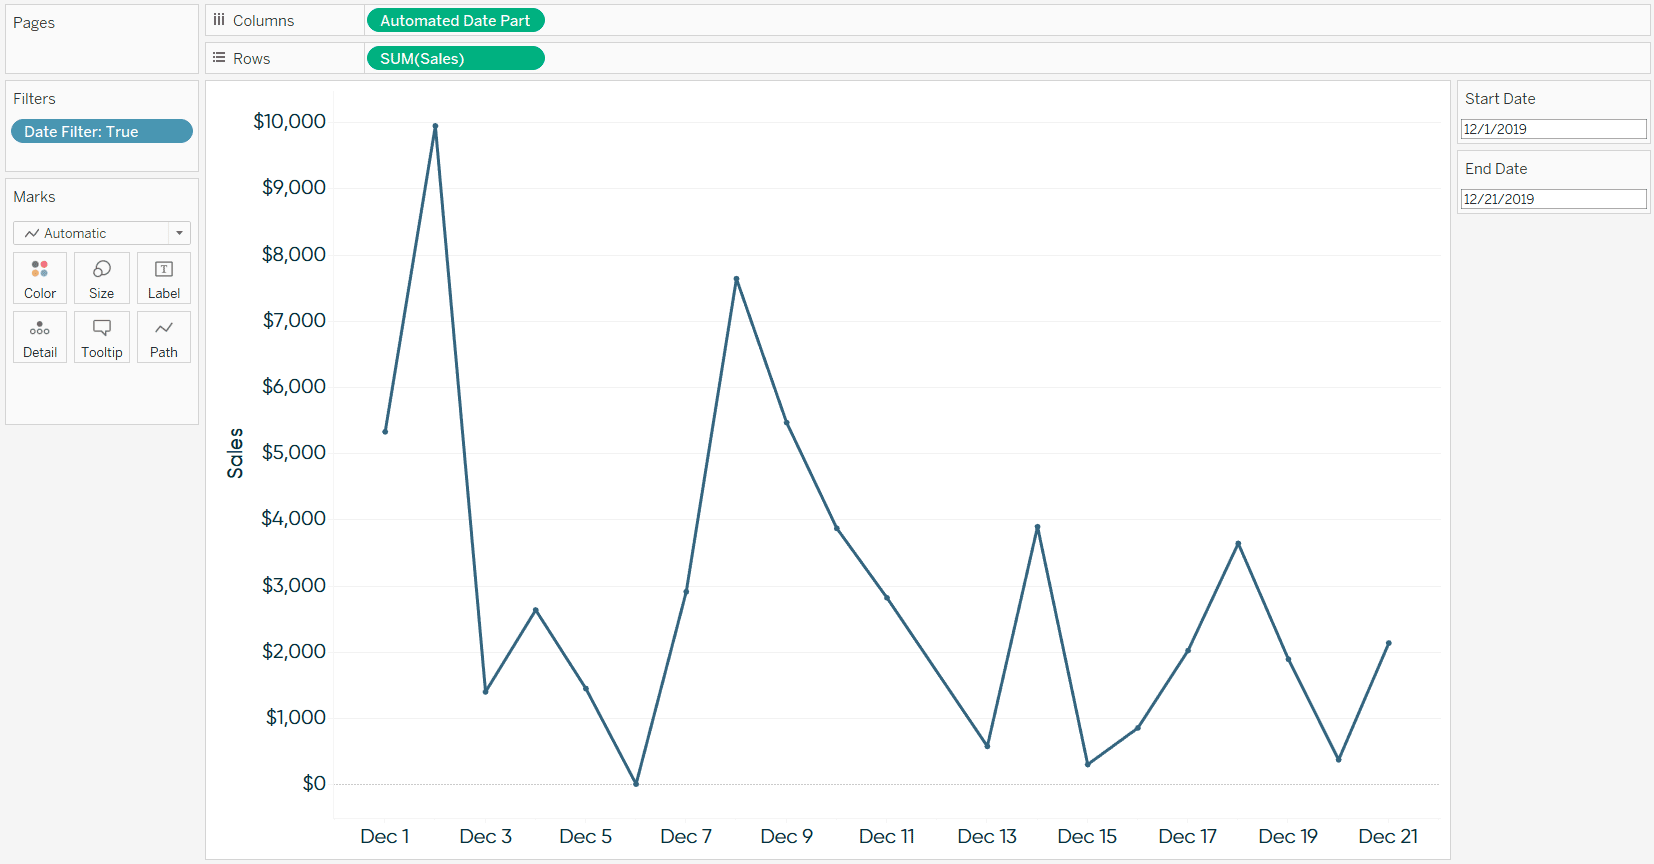
If I choose a date range containing fewer than 30 days – say 12/1/2019 through 12/21/2019 – the line graph will automatically update to look at days:
Thanks for reading,
– Ryan


Written By
Ryan Sleeper
Related Content
How to Automatically Compare Date Periods in Tableau

In this post you will learn how to parameterize the ‘date part’ in calculated fields and dynamically compare date periods…

Ryan Sleeper
Conveniently change line graphs between days / weeks / months Make your line graphs more useful by allowing your audience…
How to Normalize Current and Prior Dates on the Same Axis in Tableau
Dates can be tricky to work with in Tableau. It’s no wonder there are six different chapters in Practical Tableau…