The Fundamentals of Data Engineering
The fundamentals of data engineering are centered around, well, data. With data becoming one of the hottest topics in the business world, we’ve seen rise to new careers such as data analysts, data scientists and the specialty we are going to focus our attention on, data engineers.
To understand the basic concepts of data engineering, we must first discuss data as a whole and familiarize ourselves with the way data is classified on a business scale.
Where data is stored
Big Data
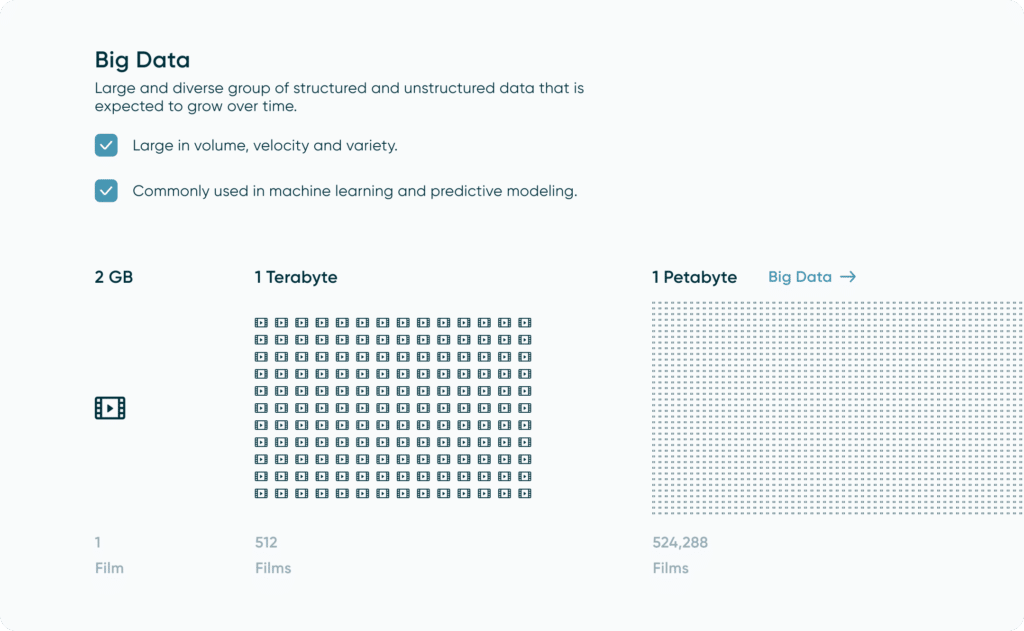
We hear the term “big data” thrown around a lot. Companies want to store big data or need big data solutions, but what actually is big data and what does it even mean? While the definition of ‘big data’ is subjective, we define big data as any data that makes up at least one petabyte (1024 terabytes) or larger. Now to the average consumer, this is an unfathomable amount of data that requires many systems contributing to it. Think about an average movie being about 2GB worth of storage space, it would take about 512 movies to occupy one terabyte, meaning that in order to occupy just one single petabyte, we would need to download 524,288 movies.
![]()
To take this comparison a step further, if each movie we downloaded was two hours long, that would give us 1,048,576 hours of content. That many hours would take us a little over 120 years if we watched nonstop! This truly puts the big in big data. Since big data is so large, it is typically hosted in an external server or in the cloud that a data engineer can access using different processes (which we will cover later).
Continue reading with a free account, or login.
Unlock this tutorial and hundreds of other free visual analytics resources from our expert team.
Already have an account? Sign In
By continuing, you agree to our Terms of Use and Privacy Policy.
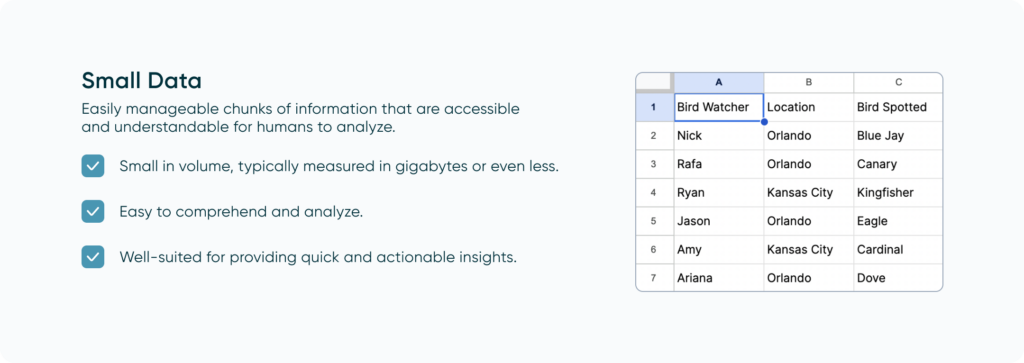
Small Data
Small data is data that we’re more innately familiar with. Small data falls more in the realm of data that we can analyze very quickly. This can be done using resources from a laptop but can also be hosted in an external server or a cloud environment. A good example of this is an Excel spreadsheet, which is something we can review ourselves and make conclusions about, but contains a limit of 1,048,576 rows.
If you want to learn more about the different data storage types (i.e. data lakes, data warehouses), Playfair’s Associate Director of Data Engineering, Ariana Cukier, just recently wrote a post on the key aspects of each and their potential uses cases. This overview ties in nicely to the fundamentals of data engineering that we are going to cover.
Data Lake vs Data Warehouse: What’s the Difference?
How you access data
Now that we’ve covered sizes of data and their storage solutions, let’s shift our focus to the next big fundamental topic, practically accessing that data and how we approach designing a robust and dynamic solution.
APIs
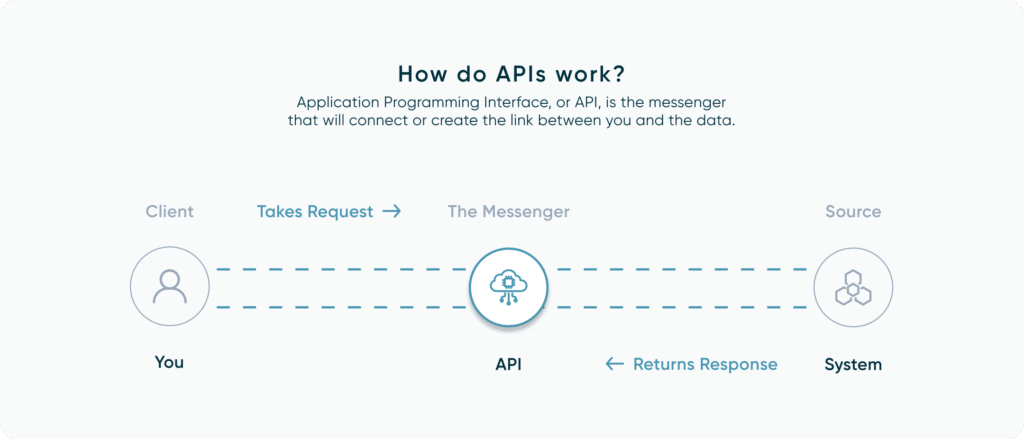
Application programming interfaces, or APIs, are something we see very frequently and help move data from valuable sources that we can then recycle into any use case we can think of, or store with our other data. An example of this might be using the Spotify API to pull your song history to see what music trends you’ve been having recently. You can think of using an API as a menu for a restaurant where you provide your order from the options available and the data is brought to you as soon as it is ready. Although, it’s more like ordering and making your food since you traditionally needed to prepare some sort of script first to interact with the API. Fortunately, quite a few tools exist today like FiveTran and Snowflake that have built-in connectors allowing you to seamlessly interact with various APIs. APIs are a core piece in understanding the fundamentals of data engineering and how we interact with data from external sources.
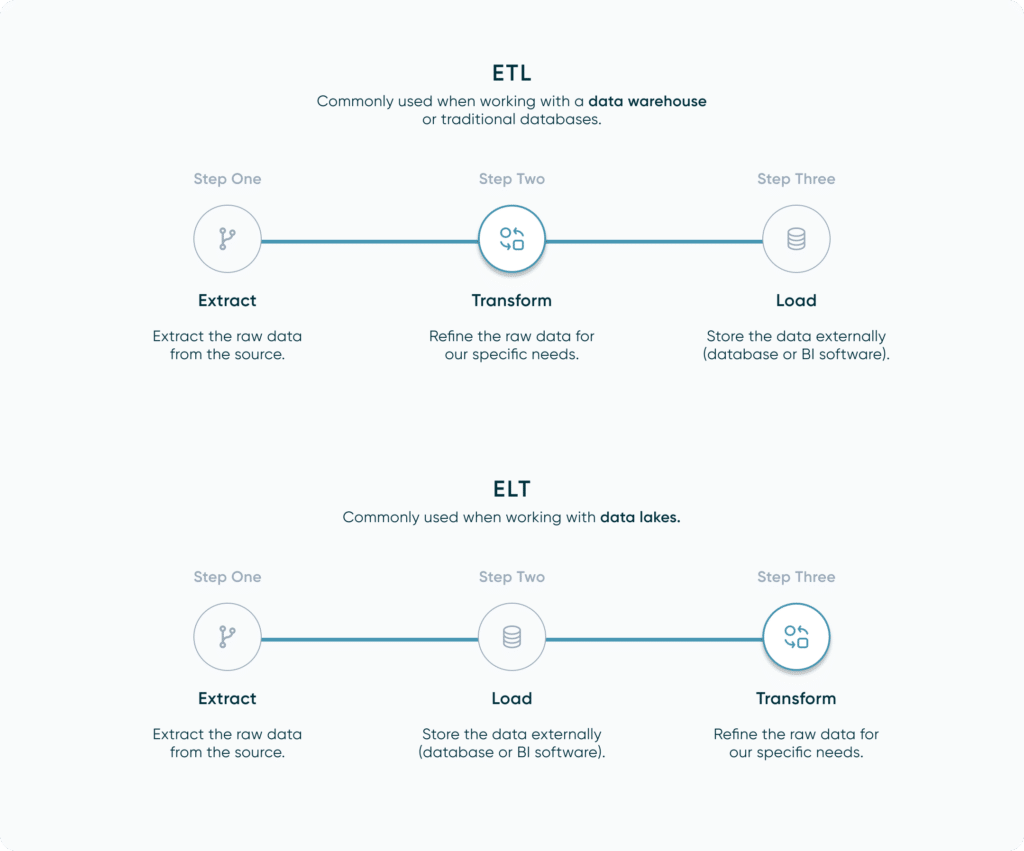
ETL & ELT
Before we dive right into how to pull data, let’s first talk about the process and its classifications/steps. The terminology you might frequently see surrounding data extraction are ETL/ELT. ETL stands for ‘Extract’, ‘Transform’ and ‘Load’. This means we first extract our raw data from a source, we then transform that raw data into a format that is more intuitive for our use case such as removing null values or cleaning up column names. Finally, we load it to an external location, like a database, or as an output file for a visualization tool like Tableau or Power BI. ELT is extremely similar, but instead of transforming our data before we load it, we instead load the raw data and perform our transformation afterwards. The ELT process is commonly used when working with data lakes. The data is loaded into the lake as raw data, and instead of being cleaned and structured prior, it is classified with metadata tags (which is really useful for machine learning). The transformation and cleaning only happens after a user wants to pull some data out.
The Toolkit
Now that we’ve covered both ETL and ELT as abstract concepts, let’s discuss how we might actually carry those out in regards to data extraction. Before I get too far into tools to use, I think it’s important to note that while some systems might require certain tools, at the end of the day there is no right or wrong way to carry out the ETL or ELT process. As long as your design is reliable, efficient and documented, then mission accomplished. Now, with that out of the way, let’s talk about some tools you can use. If you’re aiming at a low to no-code solution, then there are ETL tools such as Alteryx and Tableau Prep that allow you to connect to both files and external databases/lakes using pre-configured menu options. From there you are provided with a blank canvas and user friendly tools that allow you to create a visual workflow that is easily documentable.
The benefit to using an ETL tool for this process is that you get the user interface to easily see and monitor data changes as they happen step by step. While this is a big benefit, programming languages do provide more in-terms of functionality and customization. Another common way would be to use a programming language such as Python to communicate with an endpoint and extract data from there to export. At the end of the day it comes down to the infrastructure of your data pipeline.
Tableau Prep Builder Essentials
Fundamentals of Data Engineering: Data Glossary
Up to this point, we’ve covered the constraints of big and small data, as well as the process of accessing that data and what tools you can use to extract it. We’re on our way to covering most of the fundamentals of data engineering, but I’d now like to focus on what you’ll see after you’ve extracted your data from the source, specifically the metadata and structuring.
Data types
Like with a car, where we can get a sedan, an SUV, a truck, or a van, data can also come in different formats which we classify as types. Here is a rundown of the six different data types you can use as a reference point whenever you need it:
- Strings – these represent words, sentences and other text based values. Note you may see a data type call ‘Char’ which represents single letter strings.
- Integers – these represent whole numbers.
- Floats/Doubles – these represent numbers with decimals.
- Boolean – These represent ‘True’ and ‘False’ values.
- Date – These represent dates.
- DateTime – These represent dates with timestamps.
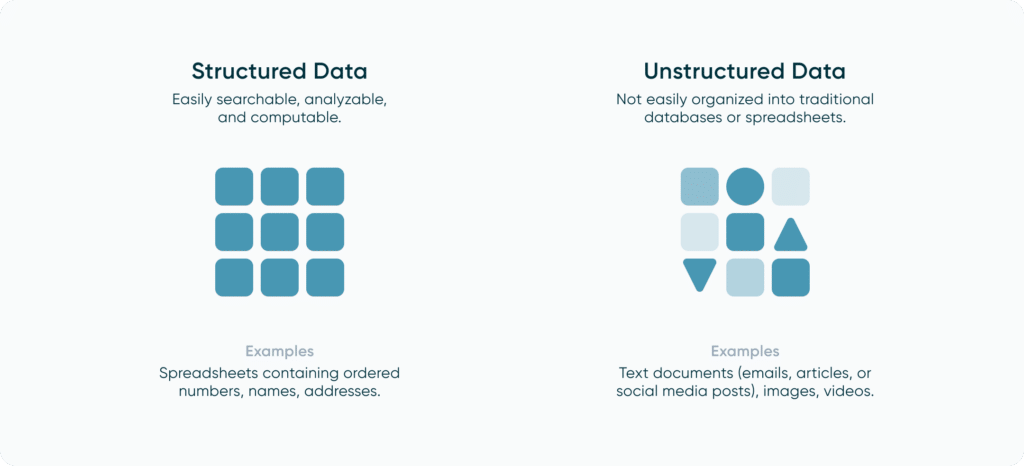
Structured vs Unstructured Data
Now that we’ve covered the types of data you can encounter, the next topic for us to review is how that data is organized. When working with data, you may encounter both structured and unstructured data.
![]()
Structured data is data that has been organized into a standardized and consistent format with a defined schema. By organizing our data, it becomes easier to access and allows us to store it into structured data housing like relational databases. We can also assign markers like primary keys that we can use to filter our data down to a specific row, allowing us to quickly find anything we need. Unstructured data is data that cannot be organized in a consistent manner. An example of this would be photos or video as these can come in various formats with no consistent way to organize and arrange them.

Fundamentals of data engineering: What to do with your data
We’ve now discussed where our data lives, how we get to our data, and what condition our data can be found in. Let’s now cover the last piece of this process, what we can actually do once we have what we need.
Joins & Unions
Before we’re ready to generate a final output, we may encounter a scenario where the data we have is in separate tables or sources. If this is the case, then we may want to consider joining or unioning our tables together. Joining data sources involves connecting them horizontally based on one or more columns that have values in common, which we usually refer to as keys (i.e. Primary, secondary, foreign). To understand joins, it helps to picture a Venn diagram, with the middle intersection representing our primary key. This graphic below provides a visual representation of a join:
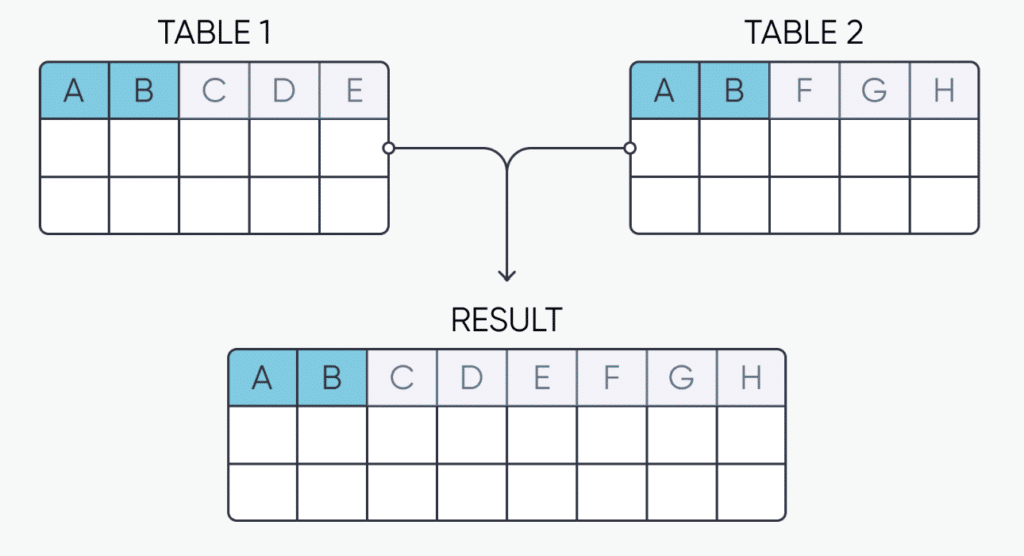
When working with joins, we have four main types that we can use:
- Inner Join – This join creates a final data source that includes all the values from both tables where there was a shared primary key value.
- Right Join – If you look at a join relationship like a Venn diagram, you can picture one table as the right circle and the other table as the left. In this instance, you would bring over all the values you would get in an inner join as well as every value from the right-hand table that did not have a match.
- Left Join – This is the opposite of a right join and brings in the shared values as well as all of the unmatched values from the left-hand table
- Full Outer Join – This join brings in the values with a shared primary key, as well as all of the unmatched values from both the left and right sides of the Venn diagram.
Unions, like joins, can be used to consolidate data sources, but they connect them vertically as opposed to horizontally. Here is a graphic to help illustrate:
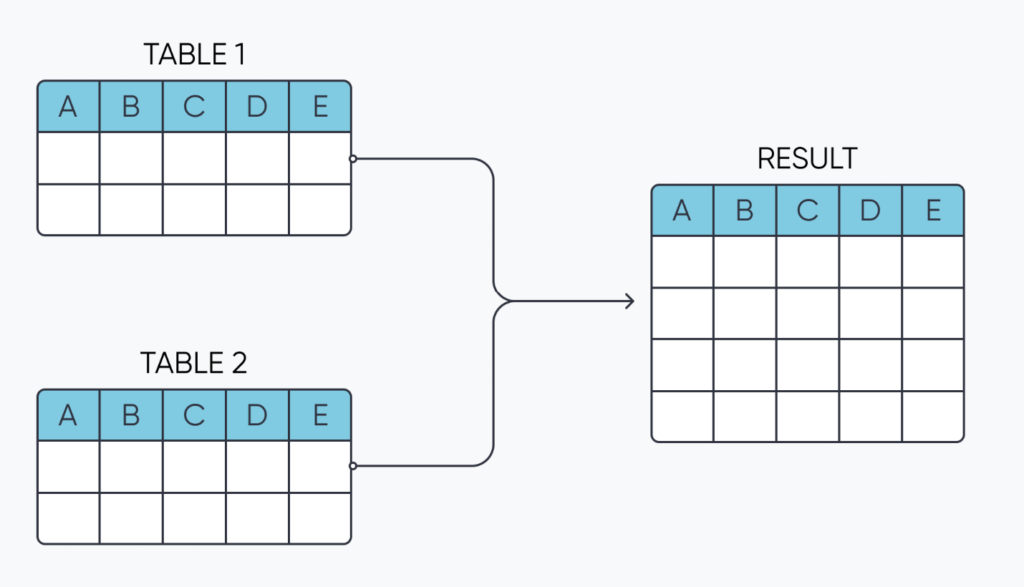
With unions, there is only one type and the most important thing to note is that when you union multiple data sources together, they should all have the same schema (column names). If you union data sources with different schemas together, whichever columns don’t exist in either dataset will be replaced with NULL values that could require additional data cleaning and preparation later on.
Outputs
We’ll first want to make sure we tailor our output to match our task at hand. If we just want to sift through and analyze some of the data in a standard format, then we might use an Excel spreadsheet as our output of choice. If I wanted to make my data accessible to a team of users to all be able to pull from, then I might create a table in a database. Here at Playfair Data, we specialize in data visualization and work primarily with dashboards to help discover insights from data. If I was supporting a project that had the goal of creating a dashboard in Tableau, for example, then I would probably choose to export my data into a .hyper format (a proprietary format optimized for Tableau) or publish to Tableau Cloud. The main thing to consider when pushing a data set is your end product and ensuring that it will be sustainable and efficient.
Wrap Up
We have now covered the broad fundamentals of data engineering. While there is much more to cover, I hope that this overview helps teach you something new or serves as a jumping off point as you dive deeper into the subject of data engineering as a whole. As always, thank you for reading and stay tuned for more content like this making its way to Playfair+
Best of luck!
Nick

Written By
Nick Cassara

Peer Review
Ariana Cukier
Assoc. Director, Data Engineering

Graphic Design
Rafael Simancas
Sr. Manager, Brand Strategy
Related Content
Tableau Prep Builder and Tableau Prep Conductor for Data Automation
With the ever growing emphasis on data visualization and analysis, it is easy to overlook the backend processes and tools.…

Nick Cassara
A guide to using Tableau Prep Builder to explore data This video will cover using basic techniques in Tableau Prep…
Bringing Tables Together: Tableau Relationships

This is part two in a series on combining data tables together for analysis in Tableau. Other posts in this…