Bringing Tables Together: Tableau Relationships

This is part two in a series on combining data tables together for analysis in Tableau.
Other posts in this series
Part 1 – Joins and the Physical Layer
Part 3 – Blending Data Sources
Part 4 – Working Across Independent Data Sources
Part 5 – Multi-fact Relationships
This post is all about Tableau relationships and the logical layer. This data connection type is specific to Tableau. It resembles a join, but is more dynamic. Tableau automatically sets the join type, excludes irrelevant rows, and de-duplicates measures based on the fields used in the view. This is incredibly powerful, but can cause problems if you don’t know when Tableau is excluding rows for you!
Glossary
Cross Joins, or Cartesian Products, are joins where each row of the left table is matched to each row of the right table, resulting in a table with each possible combination of input rows. These join conditions can use helper fields containing a single value, or can be set with join calculations like 1 = 1 or A = A.
Foreign Keys and Lookup Tables are used as go-betweens when joining two tables with incompatible keys. In Scenario 3, we want to join Events to Checkouts, but the Events table stores the Branch Name, and Author Name, while the Checkouts uses Branch ID and Book ID. Here the Books table is used as a Lookup Table to apply a foreign key (Book ID) to the Events data. Similarly, the Branch Details table and Branch ID value from that table are a second lookup table and foreign key used to connect Events to Checkouts.
Building Tableau relationships on the logical layer
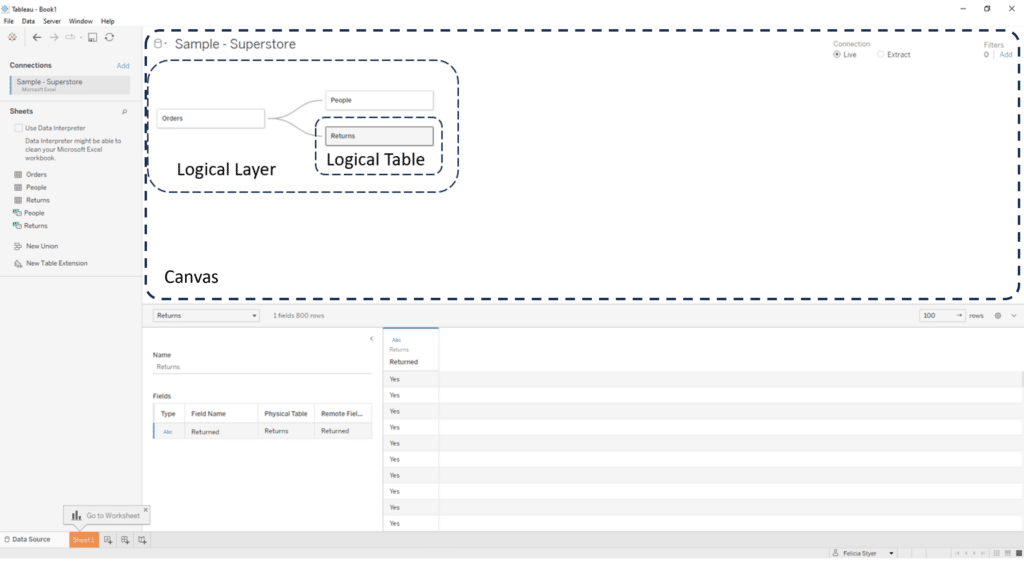
Tableau Relationships exist in the logical layer. To access the logical layer, navigate to the Data Source page. For file and database connections, you’ll see something similar to this window.
Continue reading with a free account, or login.
Unlock this tutorial and hundreds of other free visual analytics resources from our expert team.
Already have an account? Sign In
By continuing, you agree to our Terms of Use and Privacy Policy.
Note – direct connections including Tableau Cloud, Google Analytics, and others might not include logical and physical layers. For these connection types, you may need to work across data sources, which will be covered in the third part of this series.
The area below the data source name is referred to as the canvas. By default, the canvas shows the logical layer, an area where the user can drag and drop tables or sheets and create relationships. The rectangles on the logical layer represent logical tables, each of which contains a unique physical layer.
Bringing Tables Together: Tableau’s Physical Layer
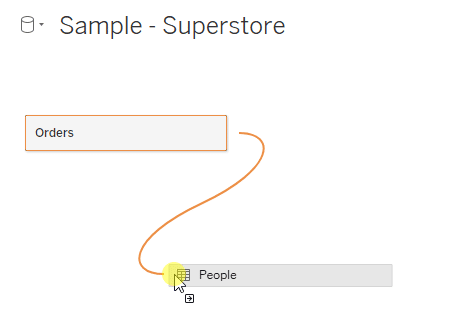
To create a Tableau relationship, bring a table into the logical layer. Then drag a second table into the layer and drop it when you see the noodle appear.
After bringing a new table into the relationship, set your relationship conditions. When a noodle is selected, which you can do by clicking on the connecting line between the tables, two dropdowns will appear. Use these to select the field or fields that your tables have in common.
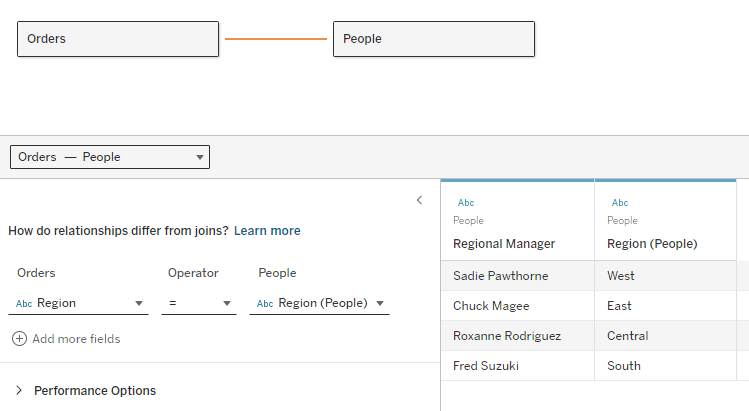
If your table has multiple keys (e.g. Client ID + Date) you can enter both, and the relationship will only match records when all keys have matching values. If your data set is missing some values that you expected to see, try creating a crosstab with the joining keys from each table along with a measure from each table. This should reveal any mismatched or unpaired values!
![]()
At the bottom of the field list there’s an Edit Calculation option. Use this if your connecting field needs to be constructed from existing fields. For example, if the IDs in one table are stored as strings, while the other table has Integers, you could use INT([ID]) as a relationship calculation.
Decision-Ready Dashboard Framework: Data
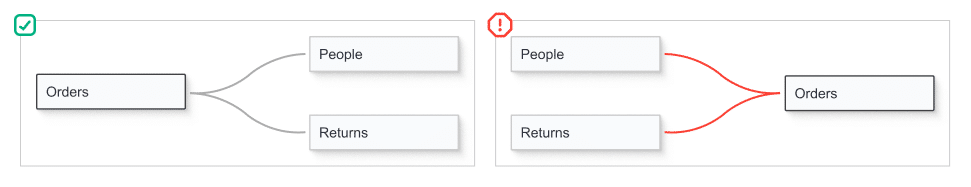
A relationship can include more than two tables. To add an additional table to the relationship, simply drag the new table into the relationship. Drop it to the right of the existing table you’d like to use in the join condition.
A new table can only connect to one upstream table, unless you are using a Multi-fact Relationship model with multiple base tables. To learn more about this, check out part 5 of this series: Multi-fact Relationships.
This can cause complications when working with data models that include lookup tables or foreign keys. Let’s run through a few scenarios where this might limit you, and how to work around it.
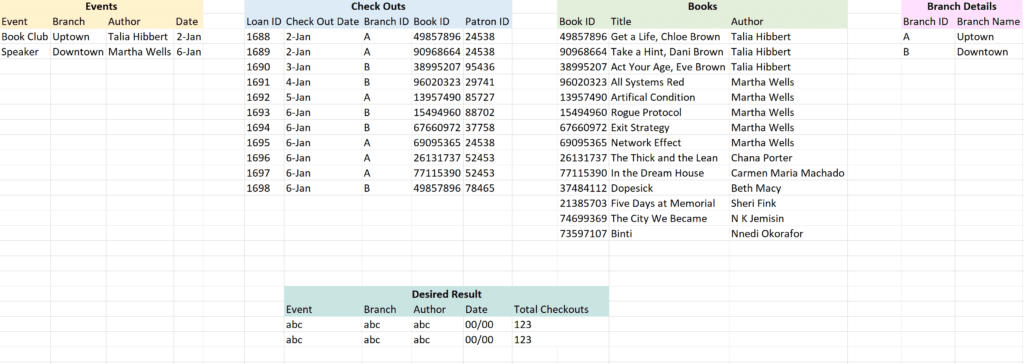
Each of these scenarios will use the same mock Library dataset. I created this dataset to illustrate inner vs outer joins, working across granularities, and foreign keys. This data represents a very small library system. Tables include Check Outs, Check Ins, Book Details, Branch Details, and Events.
Scenario 1: Check the roots
Check Ins and Check Outs by Book should be a simple dataset, right?
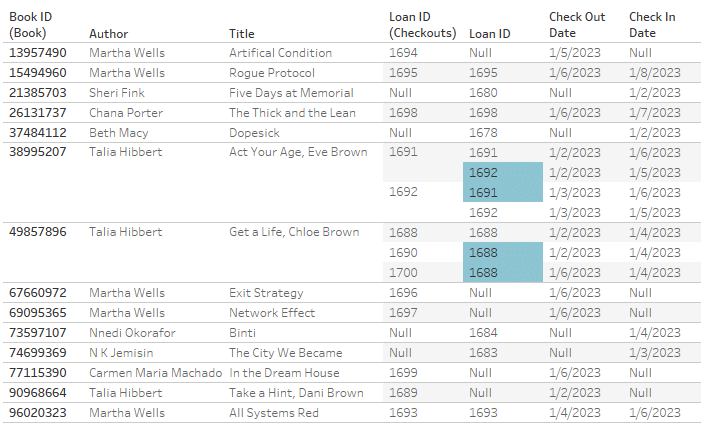
Our goal is to take the Check Outs, Check Ins, and Book Details tables and create a dataset with Loan ID, Check Out Date, Check In Date, and Book Title.
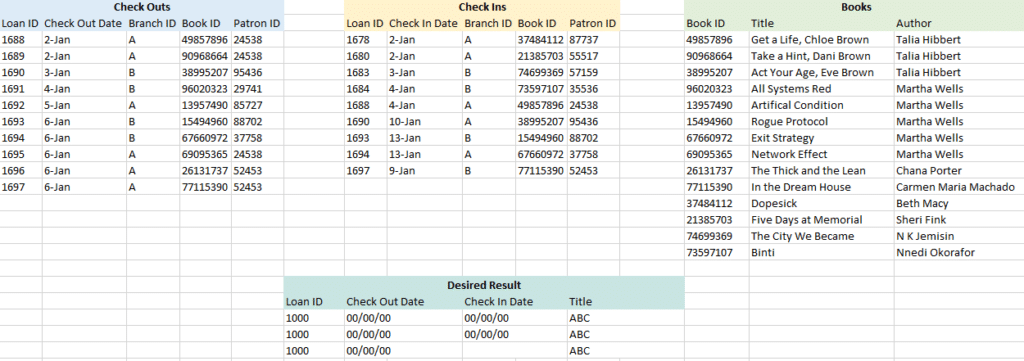
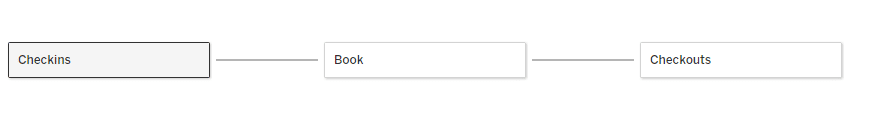
It feels natural to start with Check Outs, adding Check Ins with Loan ID, and then add Book Details. This leaves us with two options – relate Book Details to Check Outs on Book ID, or to relate it to Check Ins. We can’t tie it to both Check Ins and Check Outs because each new logical table can only relate to one existing table.
If the Book table is related to just Check Ins or Check Outs, this results in Null Book Names. This happens because the Check Ins and Check Outs tables both have unmatched Loan IDs that do not appear in the other table.
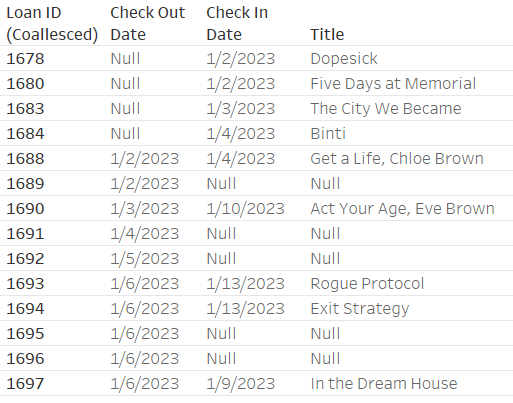
Instead, we can make Book Details the root of the data model. Then we relate Check Ins and Check Outs to Book Details on Book ID. Because Book Details is upstream, it can be connected to two tables to the right.
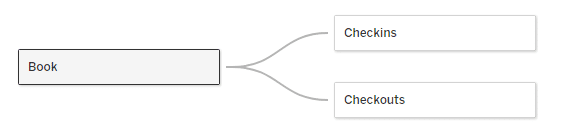
Putting Book Details into the center position in the relationship has the same result!
Our resulting book table has values for all of the book titles! However, because there’s no way to relate the Loan IDs from Check Outs to Check Ins, the loans for each book are cross joined. Each Check In record is related to each Check Out record.
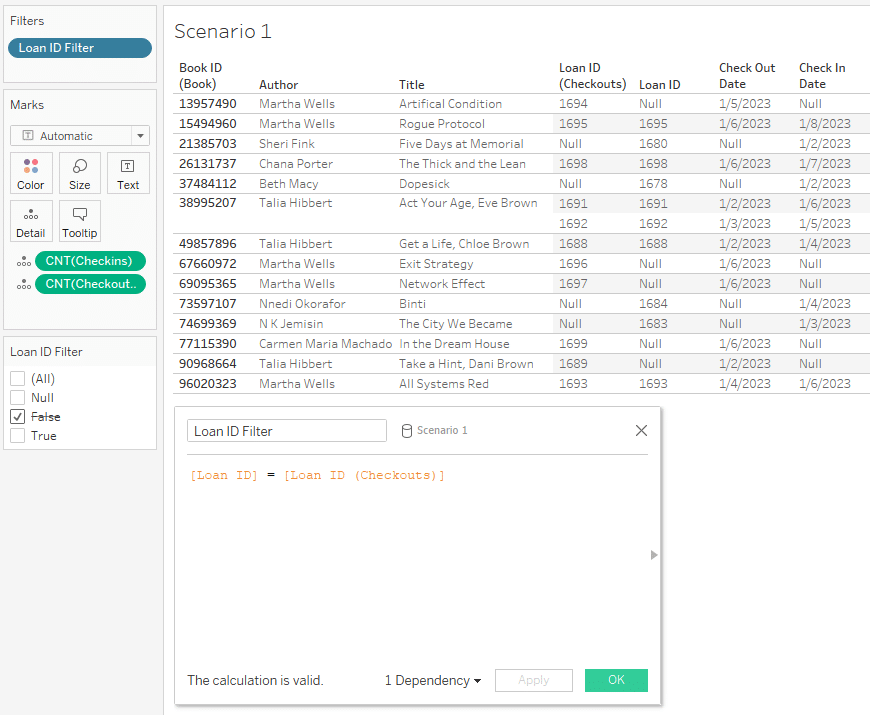
Cross joining has major negative implications on performance because it highly inflates the number of records. Mismatched records can be removed with filters, but this can also affect unmatched records. See loans 1690 and 1700 both disappear when the Loan ID filter is applied.
It’s important to choose a root table carefully, but this alone won’t solve all of our Tableau relationship setup challenges. The key to creating our desired table is using two copies of the lookup table. We’ll cover that in the next section.
Scenario 2: Two is better than one
Once again, our goal is to take the Check Outs, Check Ins, and Book Details tables and create a dataset with Loan ID, Check Out Date, Check In Date, and Book Title.
We start by adding Check Outs and Check Ins to the Logical Layer, and relate them by Loan ID. Then we add two copies of Books to the data model – one related to Check Outs, and the second related to Check Ins. Both are related using Book ID.
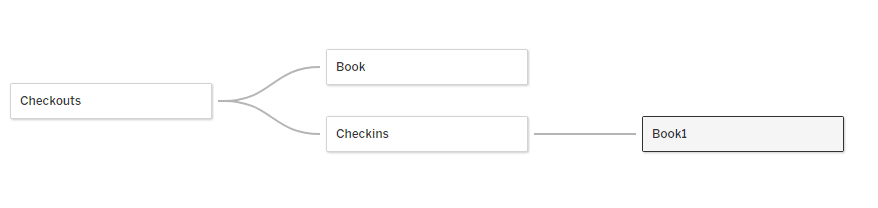
This results in two separate title fields, one from each copy of the table. The field from the table joined to Check Outs has null values for loans that only have Check Ins, and vice versa.
We can use a calculated field to combine these columns into a single title field with no nulls.
IFNULL([Title], [Title (Book1)])
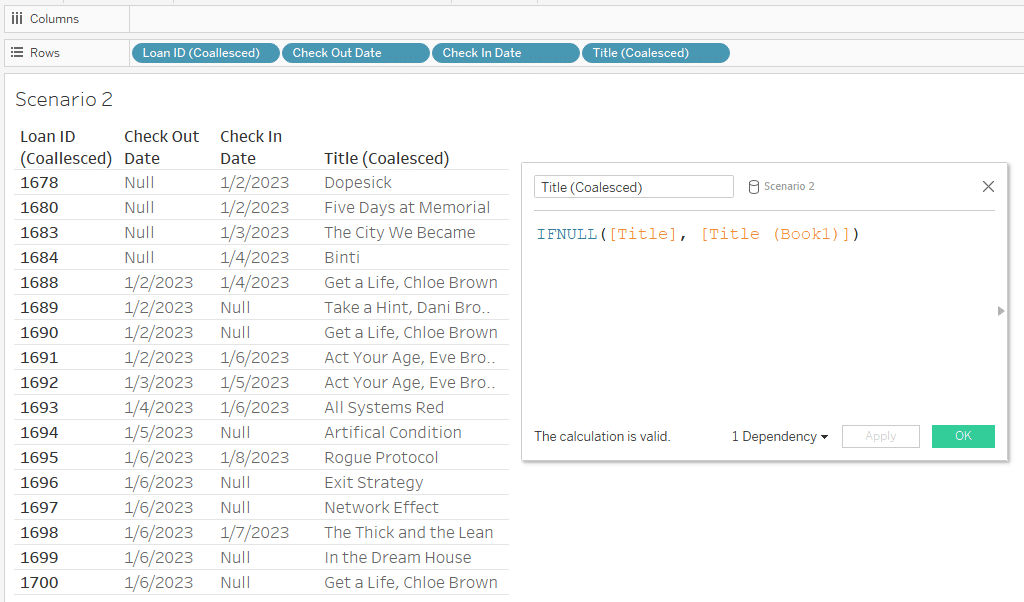
By using two copies of the lookup table, our Tableau relationship populates the titles for both Check Ins and Check Outs.
Scenario 3: Circular data models
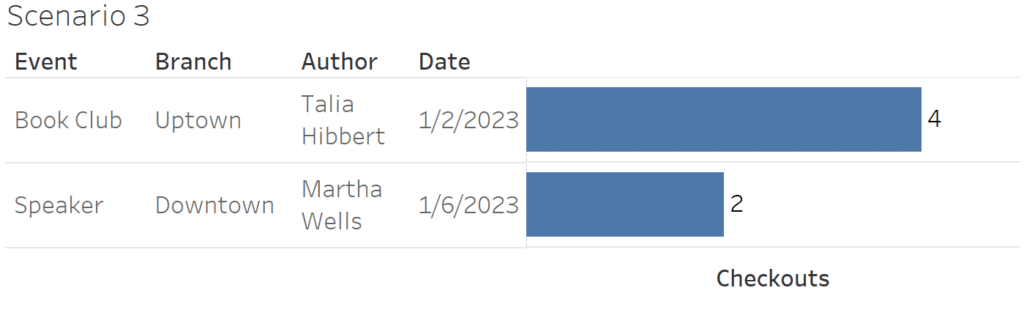
For this scenario, a librarian wants to know how many checkouts resulted from their events. We can match events to checkouts based on the date, location, and author. However, the events and checkouts tables store these values differently. We’ll need to use lookup tables to link Author to Book ID, and Branch Name to Branch ID.
Ideally the Tableau relationship would link Events to Checkouts on Date, then link both tables to Books and Branch Details. Creating a data model like this using just the logical layer would require a multi-fact relationship model. That is the only way one table can have multiple upstream connections. To see the solution with multi-fact relationships, look at part 5 of this series: Multi-fact Relationships.
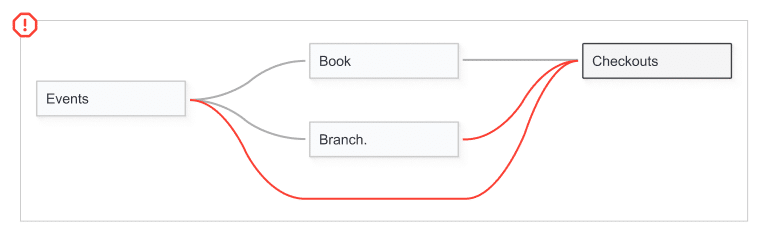
Adding two copies of the Book and Branch tables won’t fix this issue. In Scenario 2, Book was acting as a lookup table, but here it’s acting as a foreign key – connecting the Author from Events to Book ID in Checkouts. We need to use this table to make sure the right rows are matched up!
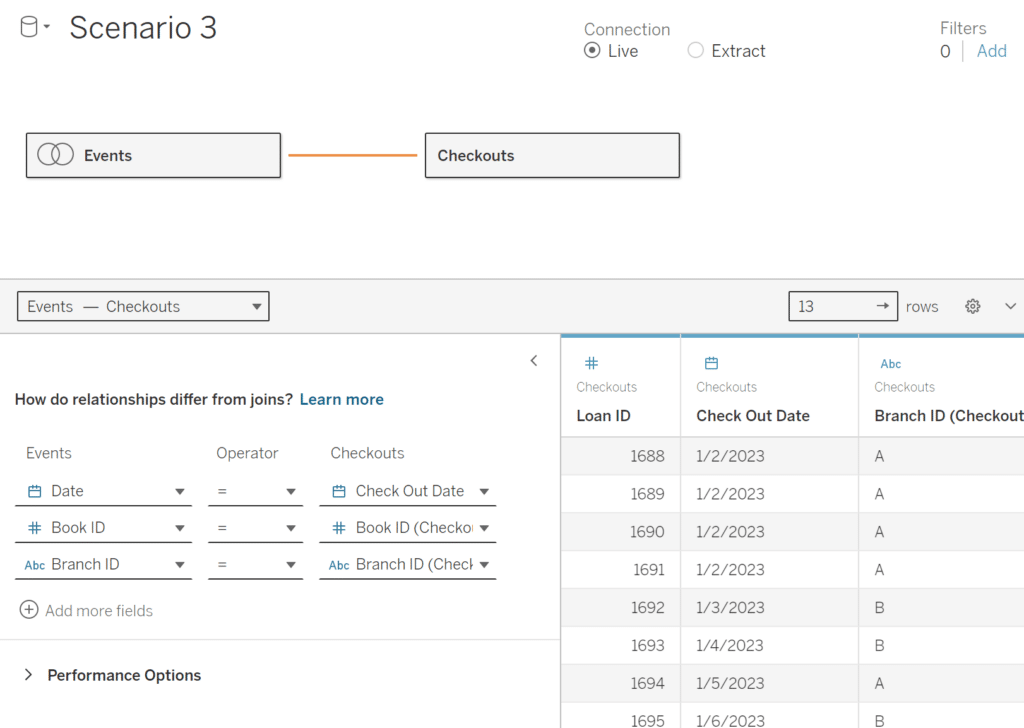
We can get around this using the physical layer. To do this, we double click Events to open the Events Logical Table and bring the Book and Branch tables into its physical layer, joining them to Events.
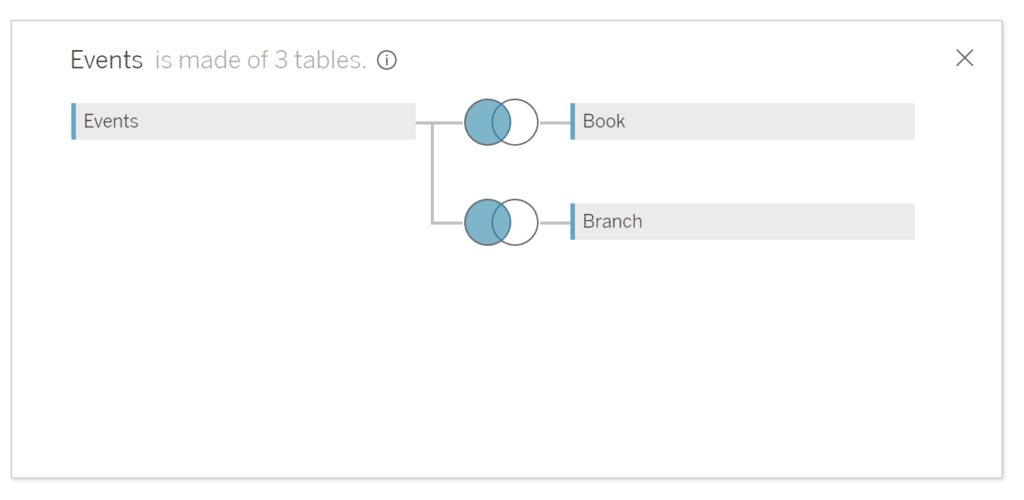
Now Book ID and Branch ID are available in the Events Logical Table and we can link it to the Checkouts Logical Table on all three conditions.
Now we can use this data source to create the desired table!
- For more information on Data Models in Tableau: https://help.tableau.com/current/pro/desktop/en-us/datasource_datamodel.htm
- This post doesn’t get into Performance settings, but here’s the documentation if you’d like to learn about them: https://help.tableau.com/current/pro/desktop/en-us/datasource_relationships_perfoptions.htm
Using Tableau relationships to create visualizations
Creating the data source is just the first step of your analysis. Tableau relationships behave differently from joins when you build worksheets. Tableau will automatically modify the rows included and deduplicate aggregated values based on the fields you include. These generally make analysis easier, but it’s important to understand how Tableau is subtly modifying your results.
Navigating the Data pane
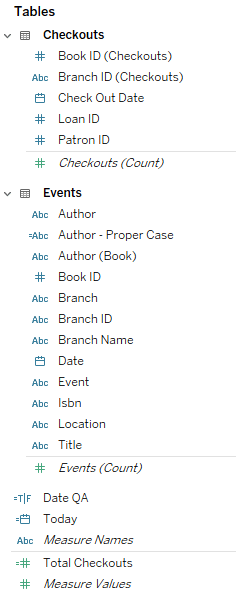
This is what the Data pane looks like for a Tableau relationship-based data source. For our sample data, we can see that the fields from the Checkouts table and Events tables appear separately, grouped by their logical tables. Calculations that reference dimensions from a single table, like Author – Proper Case, appear with the fields from that logical table. Aggregations, cross table calculations, and table independent calculations appear outside the logical tables, at the bottom of the Data pane. Field names that appear in multiple tables will have the table name appended to the field name in parentheses.
Contextual joins
Tableau relationships automatically switch between Inner, Left, Right, and Full Outer joins based on the fields included in your view. This means Tableau will filter out your null values without any warning!
Let’s demonstrate this in a sample worksheet. When a dimension from each table is added to the view, Tableau uses an inner join. As a measure from either table is added, it expands to capture the outer records from that table. When measures from both tables are used, Tableau uses a full outer join.
Tableau will only show null values when measures are present. Don’t assume all keys have matches just because you see no nulls! Make sure to include measures from each logical table when looking for null values.
Contextual joins can also cause two worksheets with the same dataset and filters to show different values. If one has measures and the other does not, the first may include more records than the second.
Smart aggregation
Joins resolve aggregations on the final product of the join, using all rows in the data source. Instead, Tableau relationships resolve aggregations inside of the logical tables. This prevents duplication when rows have multiple matches.
![]()
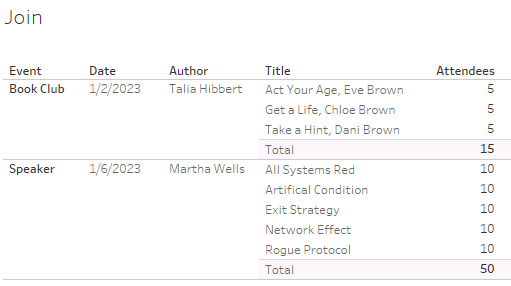
If we wanted to bring Title into the Events table, a join would create duplication in the Attendee measure while a relationship would preserve the original level of detail.
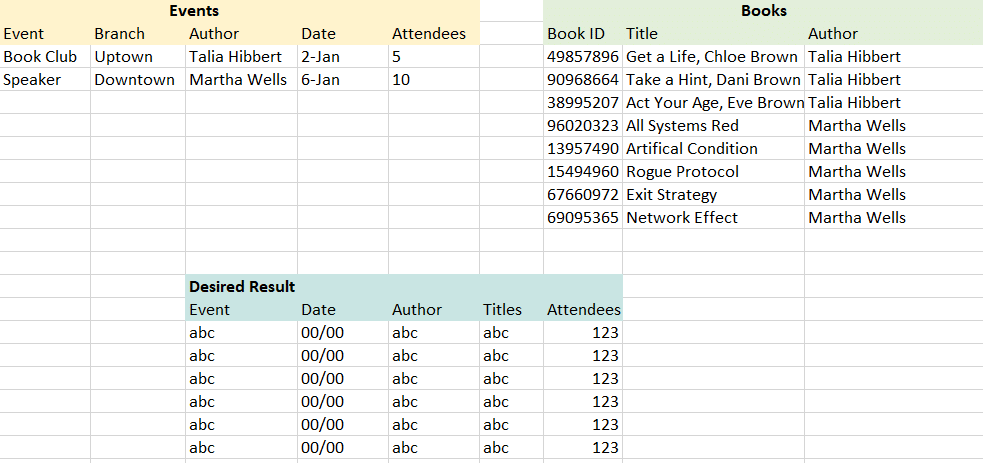
When we join Events to Books, the measure is replicated for each title, and then the aggregation takes place across all rows in the data set.
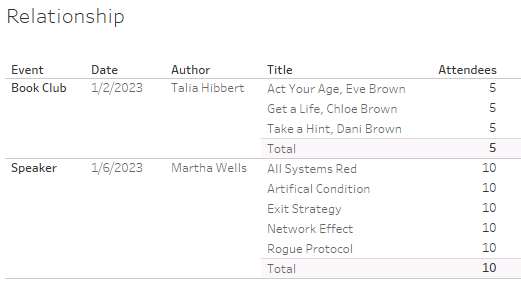
Using a relationship, the native level of detail is retained. We still see the measure for each title, but the subtotals are computed within the events table. This prevents the duplication we see in joined data.
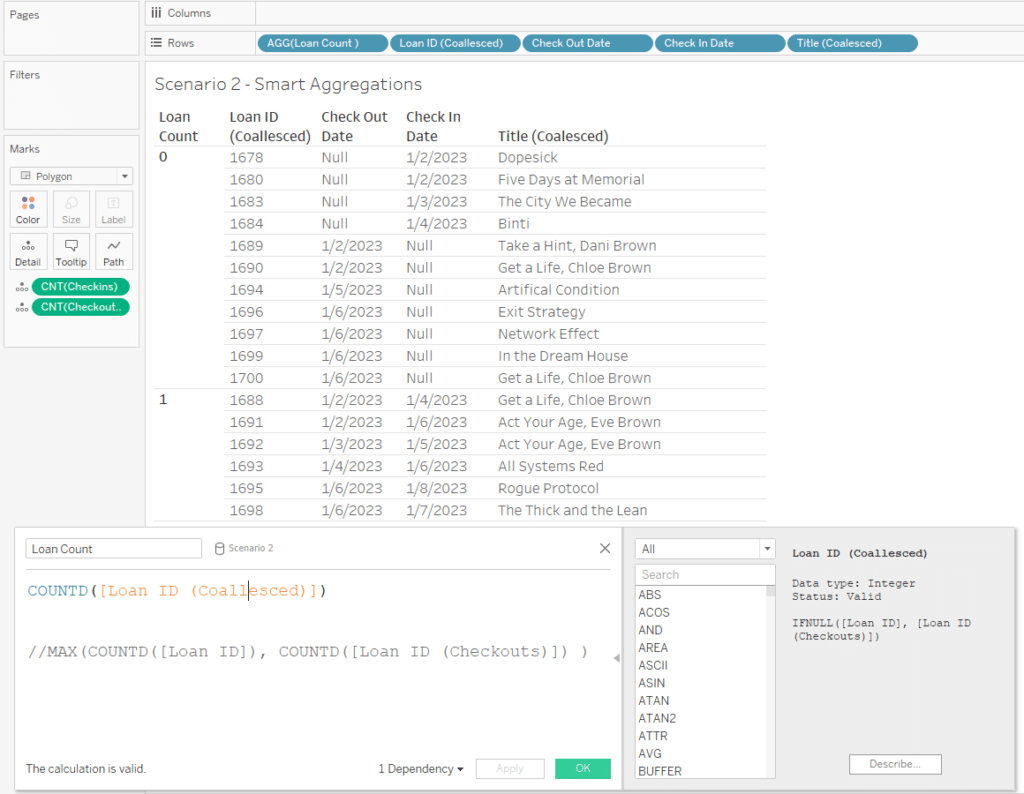
Smart aggregations are incredibly convenient when working with non-unique IDs, or across granularities. When you start to incorporate nulls or multiple logical tables, things get more complex. For example, I expected this COUNTD function to return a 1 for each row, but it only did this for the loans that appeared in both logical tables. Any records with just a Check Out or Check In returned 0. Instead, I needed to perform the aggregation on each logical table independently, and then aggregate those results.
For tips on building more complex aggregations and working with nulls in relationships, check out this three-part series by Bethany Lyons:
- https://www.tableau.com/blog/relationships-tableau-data-model
- https://www.tableau.com/blog/relationships-part-2-tips-and-tricks
- https://www.tableau.com/blog/relationships-asking-questions-across-multiple-related-tables
Use-cases for Tableau relationships
- Joins with non-unique keys
- Joins across granularities
- Combining large tables
- NOT ‘count the nulls’ situations
- NOT relating two published data sources directly
Tableau relationships are ideal for general use cases. They handle basic aggregations incredibly well, especially when you’re working with non-unique keys. Because data is stored as logical tables, relationships are more performant than joins when dealing with non-unique keys. Just remember to do a little extra sense checking on your views when using relationships.
Joins will be easier to work with when the analysis focuses on nulls, or the Outer section of the outer join. Depending on the situation, you may also want to use joins when using tables to reshape your data, e.g. filling in missing data with a scaffold, or intentionally duplicating rows by joining to a helper table.
Finally, some data connection types simply won’t allow relationships or joins. For example, published data sources can be used as base tables in Multi-fact Relationships, but two published data sources cannot be directly related using relationships. We’ll cover working across data sources in part 3 of this series: Blending Data Sources!
Thanks for reading!
Felicia

Written By
Felicia Styer

Peer Review
Megan Spengler
Manager, Decision Intelligence

Peer Review
Matt Snively
Sr. Manager, Analytics Engineering
Related Content
Bringing Tables Together: Tableau’s Physical Layer
Welcome to our series on bringing tables together! This first article is all about the physical layer in Tableau, including…

Ryan Sleeper
Start on the right foot by properly preparing data for Tableau The single biggest barrier to Tableau adoption is properly…
A Quick Start Guide to Tableau Prep

In this tutorial, we’ll be covering the Tableau Prep tool and how we can use it to build out data…