Bringing Tables Together: Blending Data Sources
Welcome to the third part of our series on bringing tables together! This article covers using blends to work with multiple related data sources. Blending is a Tableau-specific technique that allows you to construct charts from multiple data sources on the fly. Its flexibility is helpful when you want to experiment with data models or combine data sources from connection types that can’t include secondary data connections.
Other posts in this series:
Part 1 – Joins and the Physical Layer
Part 2 – Relationships and the Logical Layer
Part 4 – Working Across Independent Data Sources
Part 5 – Multi-fact Relationships
Data blends in Tableau Desktop
Blends in Tableau are a unique way to combine data, similar to Relationships. Blends behave like a limited left join, allowing you to use fields from secondary data sources alongside the primary data source. However, unlike a left join, the secondary data source cannot add any new rows to the view. The blended data is limited to the granularity of the primary table.
Blends are also more flexible than joins and relationships because their conditions are controlled at the worksheet level, allowing multiple configurations within the same workbook.
Continue reading with a free account, or login.
Unlock this tutorial and hundreds of other free visual analytics resources from our expert team.
Already have an account? Sign In
By continuing, you agree to our Terms of Use and Privacy Policy.
How to define blend relationships
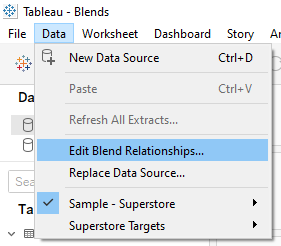
The core of a blend is the blend relationship. Tableau will automatically generate blend relationships based on field names (i.e. it will assume they are related if spelled the exact same way), but you may need to override the automatic setup. To customize blend relationships, go to Data > Edit Blend Relationships.
This will open the Blend Relationships window.
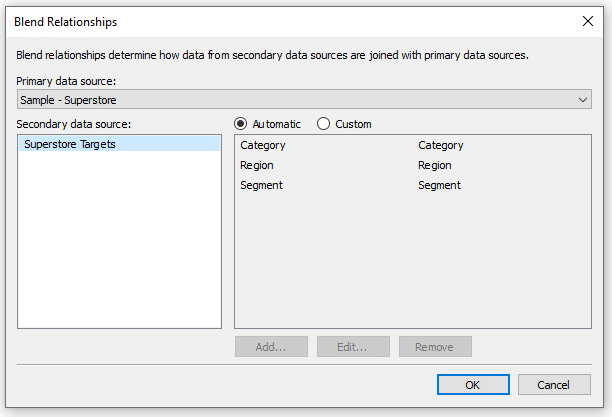
From here, select the relevant primary and secondary data sources. Note that for the relationship settings, it doesn’t matter which is primary. Review Tableau’s automatic selection, and if necessary, switch from Automatic to Custom, then modify the relationships as needed. For example, adding a relationship between two date fields, or adding relationships between joining keys with different names. Keep in mind that relationships aren’t automatically active – you’ll need to configure them in the worksheet data pane.
How are Tableau blends different from joins?
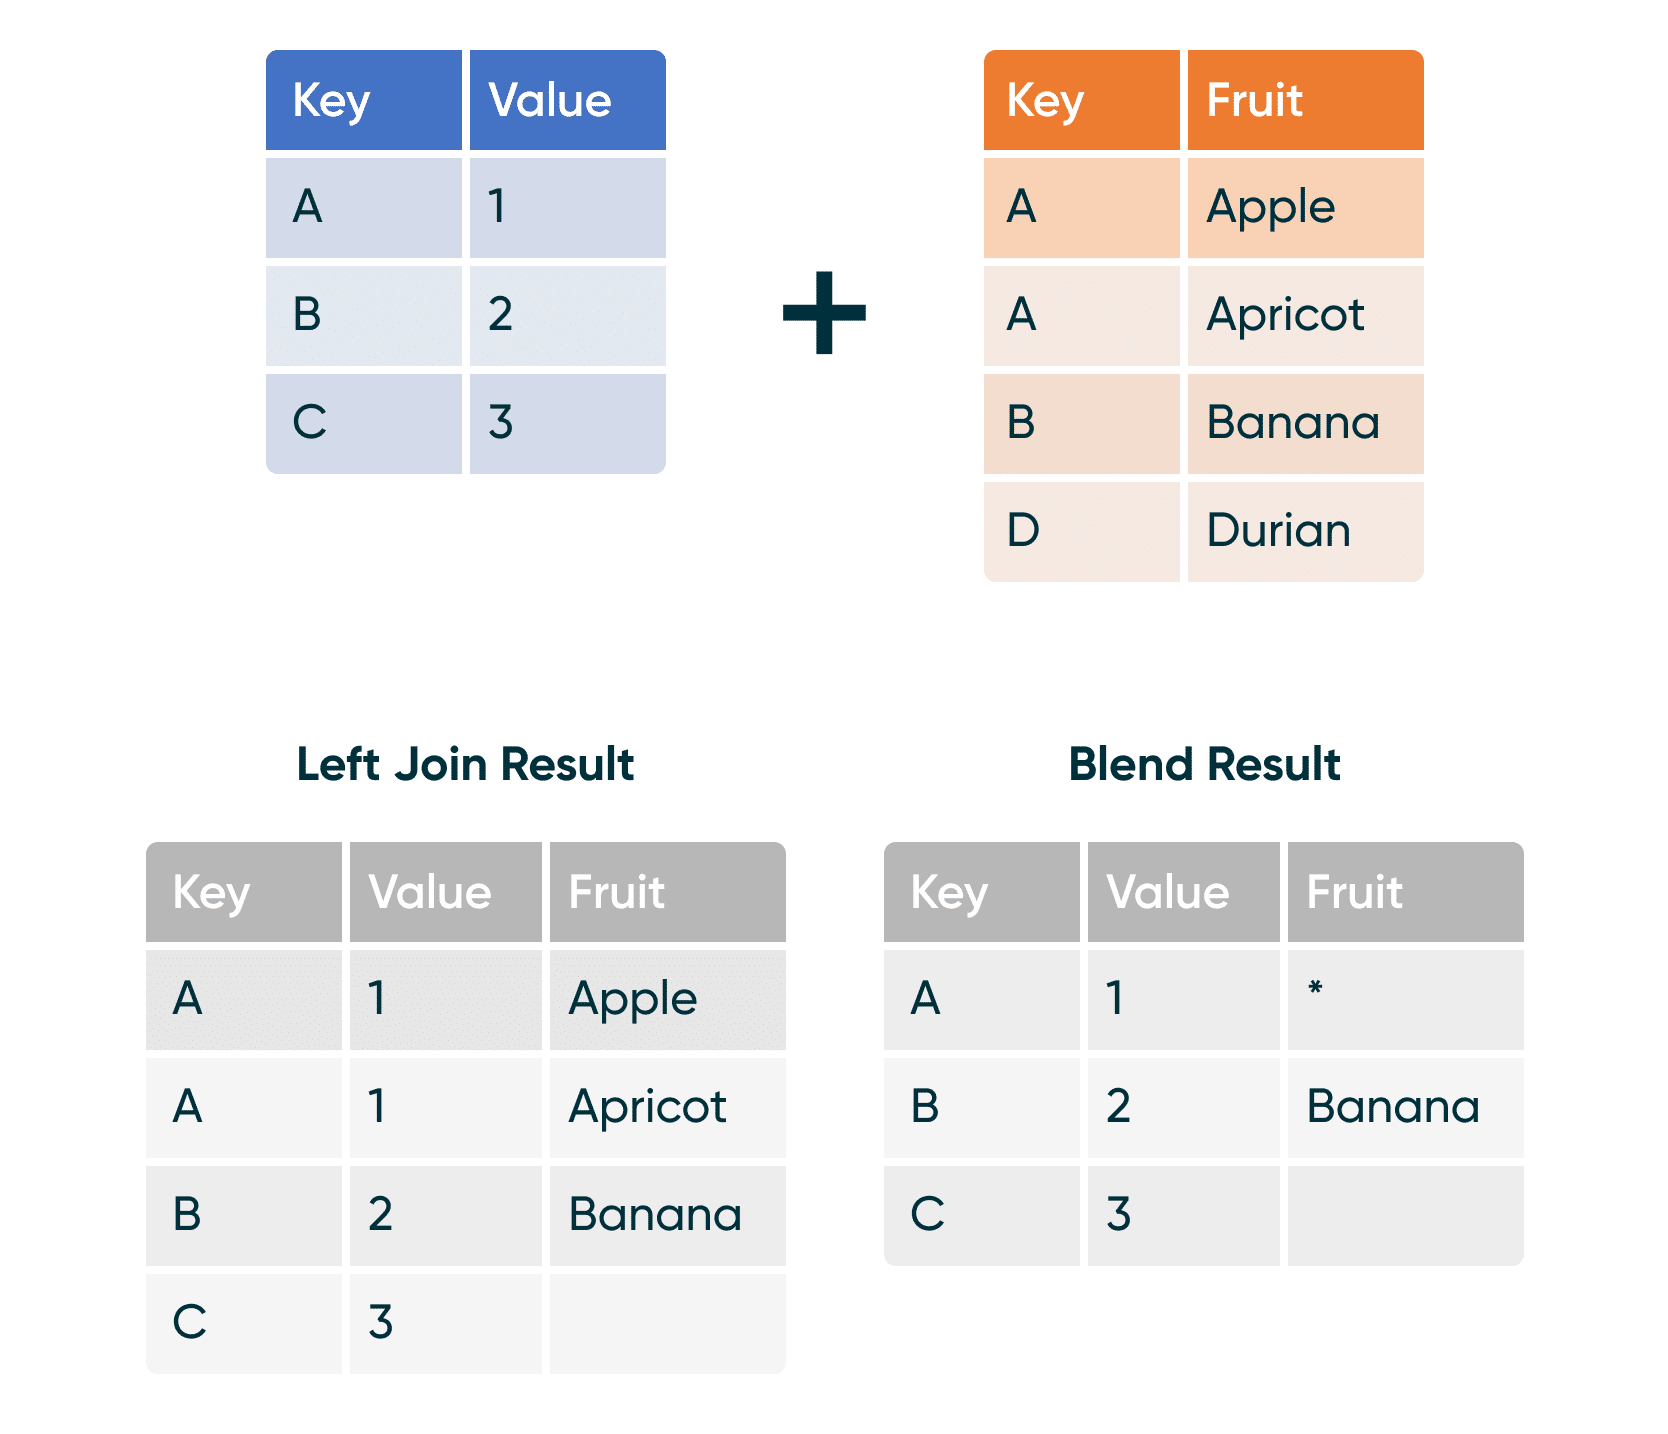
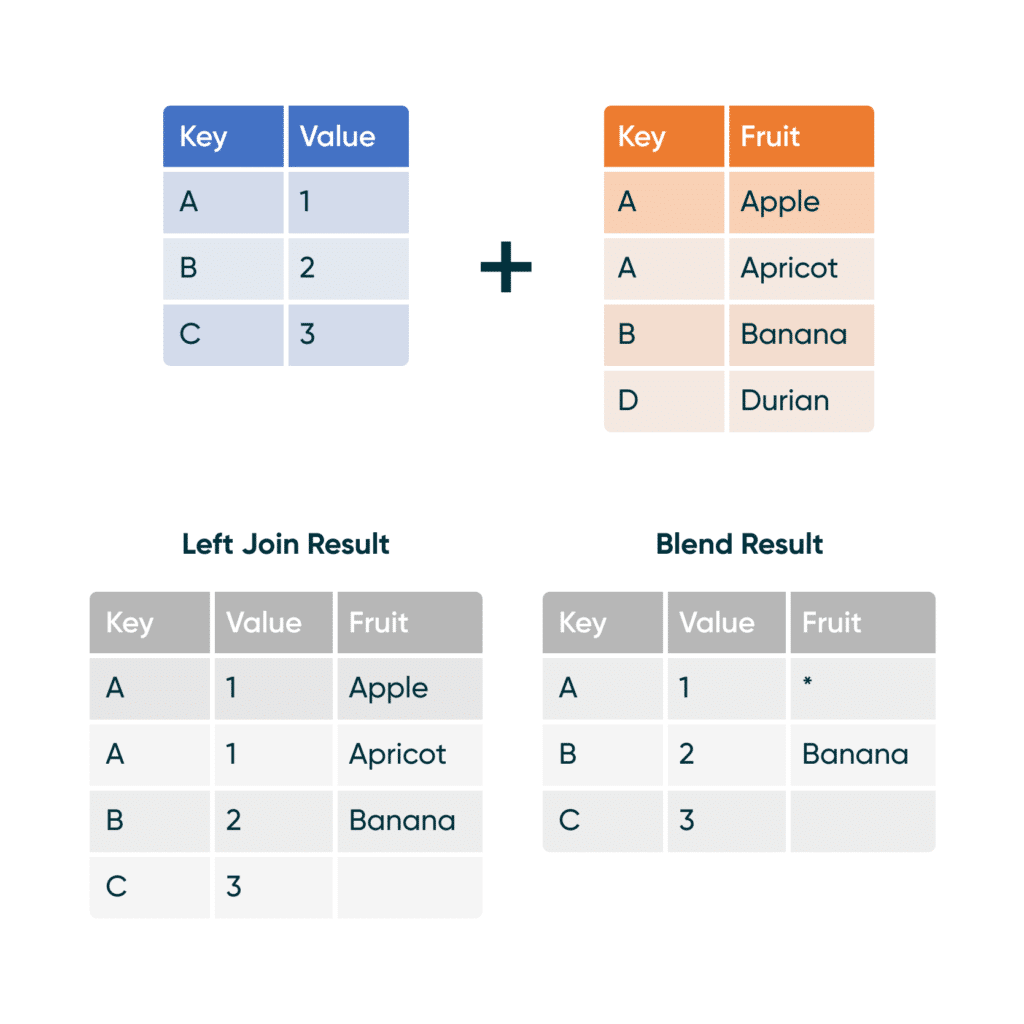
Blends work similarly to a left join, where your primary data source acts as the ‘left’ table, while the secondary data source is the ‘right’ table.

The key difference is that the secondary data source cannot create any new rows! For rows with multiple matching records, blends use an asterisk (*) to display a multi-value error instead of creating new rows.
Blends are also impacted by the dimensions in the view. Adding more granular dimensions can break a multi value error (*) into the individual values. The multi-value error appears when one mark is associated with two (or more) dimension values from the secondary table. If a more detailed dimension is added to the view, it may split the rows in the original mark into multiple new marks, creating an opportunity to resolve the error.
How to configure blend relationships
Start building your view by adding fields from the primary data source. Pick your primary data source carefully! You’ll be limited to the granularity of that data source, so it’s usually best to pick the one with the most detailed data. Another factor to consider – data sources with logical tables cannot add dimensions as secondary data sources.
![]()
The first field you add to the view will automatically become the primary data source. Once a view is built, you cannot change the primary data source. If you want to switch, you’ll need to completely clear the worksheet and add a field from the new primary data source.
After selecting the secondary data source, you’ll see ‘link’ icons next to some fields in the Data pane. These show which fields are connected by the blend relationships. Each relationship you create in the Blend Relationships menu will have a link icon next to it.
Turn the blend relationships on or off by clicking on the icons. Here, the Segment relationship is off, while the other relationships are active.
Working with blends
Blends can be unintuitive. In this section, we’ll go through some scenarios to show the quirks of working with blended data. We’ll be using Sample Superstore and a mock Superstore Targets table. The mock dataset includes Region, Segment, Category, and Sales from Superstore. Year, Target, and Target Met are new fields included in the table. This is a sample of the mock table.
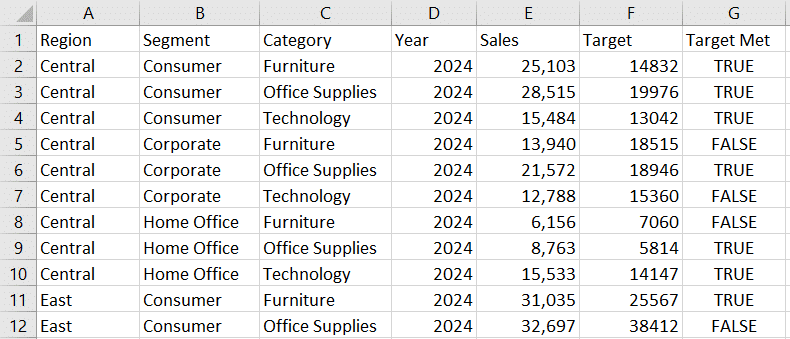
If you would like to follow along, you can use Superstore along with a mock Superstore Targets table. You can also download a completed Blends workbook that includes tables for each scenario.
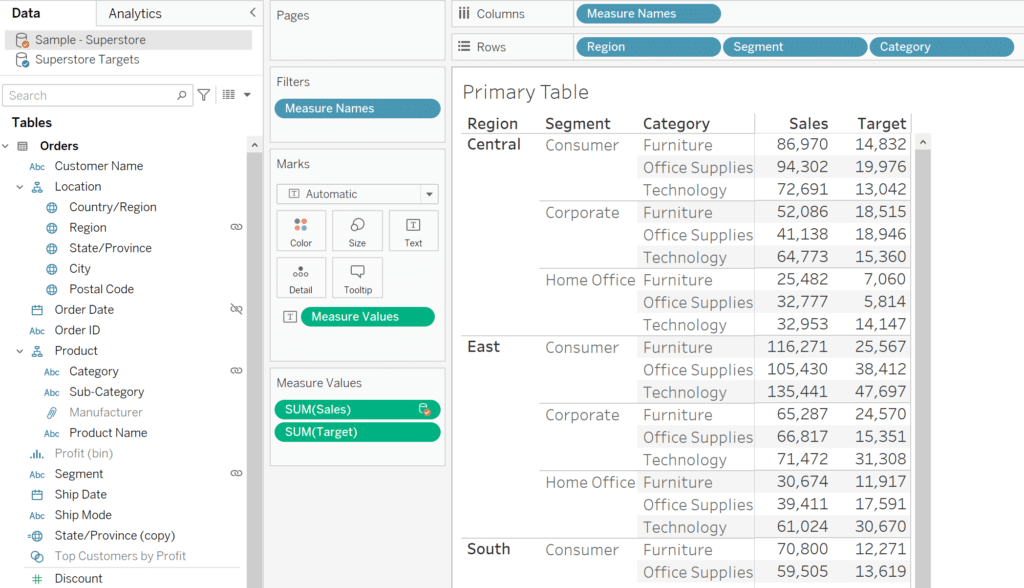
To get started, I create my Superstore Targets data source and set up the blend relationship between the ‘Year’ field and the ‘Order Date’ year. When I work with blends, I always start by building a basic crosstab with all of the blending dimensions. I add Region, Segment, and Category from Superstore to set the primary table, and then bring in the other relevant fields. This table helps me confirm that I’ve set up my blend relationships correctly.

Scenario 1: The primary data source matters
What happens when we use Superstore Targets as the primary table and Superstore as the secondary table? Here, I started recreating the test table starting with Superstore Targets instead of Superstore.
I was able to add SUM(Sales) from Superstore without any errors, but as soon as I add a dimension, activate the Order Date relationship, or filter the Order Date year, an error occurs.
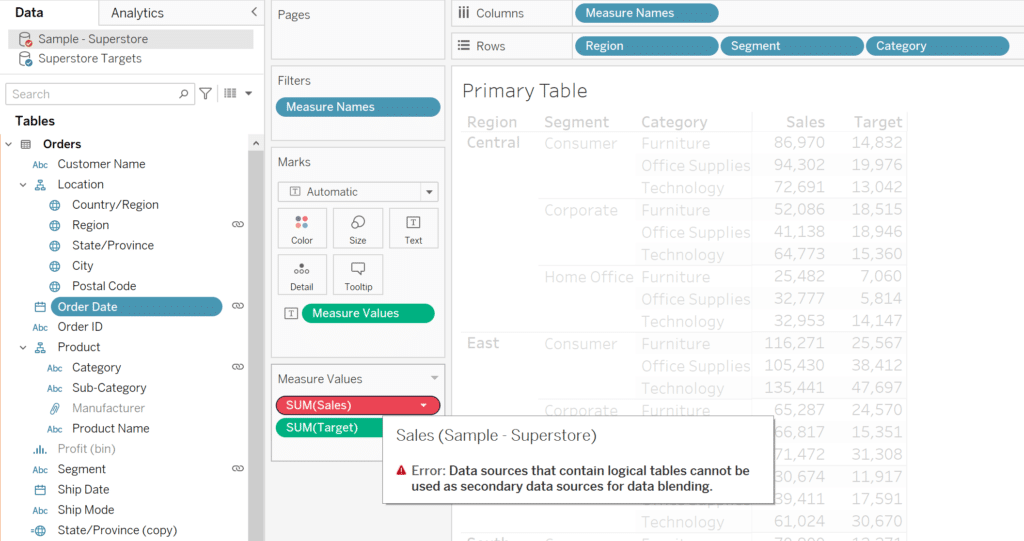
Because Superstore has logical tables, which means it uses a relationship data model, it cannot be used as a secondary data source in a blend. To fix it, let’s remove the relationship from Superstore and keep just the Orders table. Once we do that, we can set up the blend relationship with the ‘Order Date’ and start adding fields from Superstore to the view.

Because Superstore Targets is the primary data source, and it only contains 2024 data, the view is automatically filtered to 2024 when the Order Date relationship is activated. This means no other years will show up in the view. When Sub-Category is added, we don’t see any values, only asterisks. The asterisks mean that there are multiple values, but a blend cannot create new rows to show each value.
If we build the exact same table with Superstore as the primary table, we get a very different result!
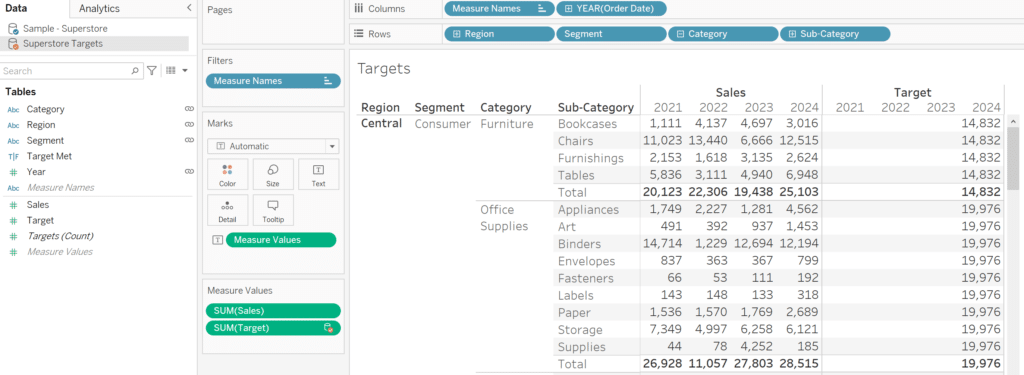
Now, the table shows all years, leaving space for the years not in Superstore Targets. We also see a row for each Sub-Category value instead of stars. When one target record is associated with multiple rows the value repeats, appearing in each row. When a total or subtotal is applied, we see the true unduplicated value.
Scenario 2: Blend configurations affect measure aggregation
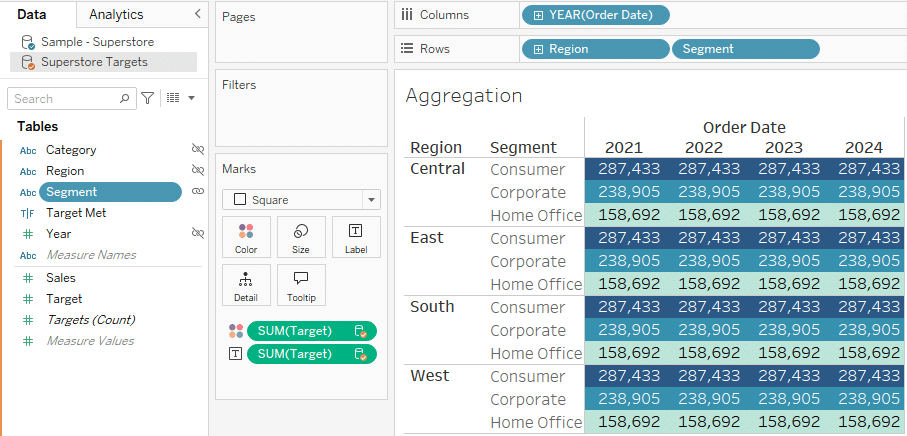
How are our measure values impacted by the blend configuration? Let’s look at how a basic table including Year, Region, and Segment changes with different blend configurations. 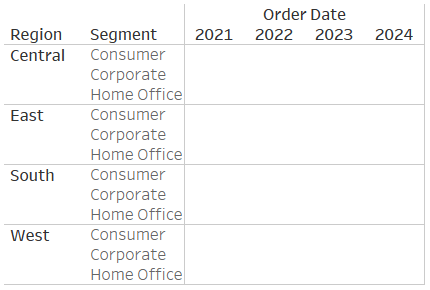
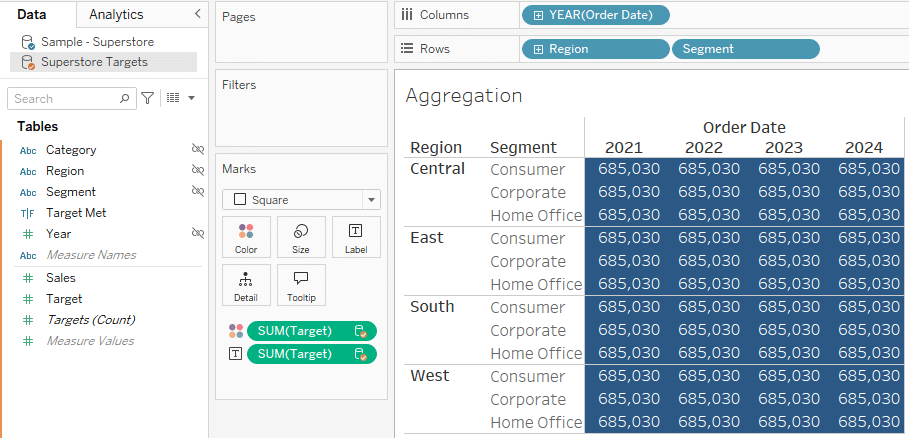
When all blend relationships are turned off, each cell shows the same Target value – the total value of all values in the dataset.
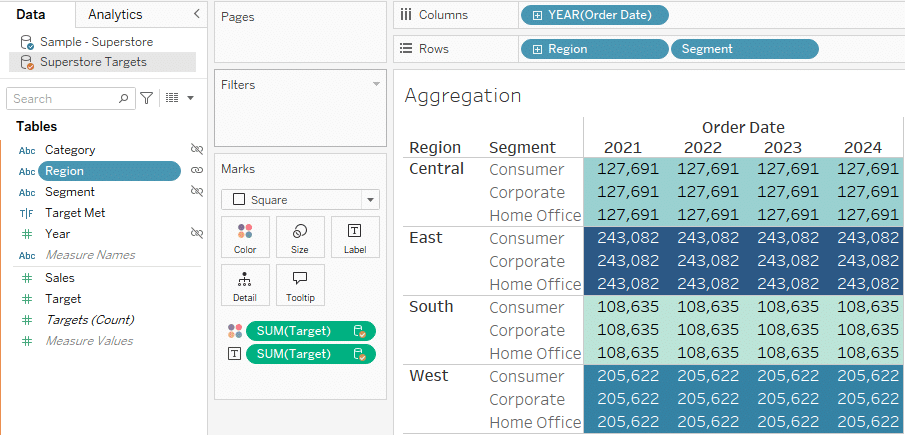
When the Region blend relationship is active, the cells in each region show the total for that region.
Similarly, switching on just the Segment blend relationship makes the cells for each segment show the segment total.
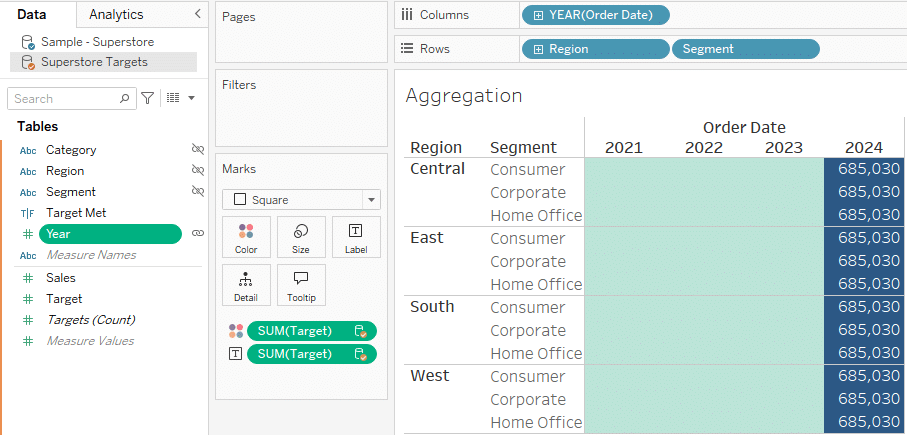
Activating just the Year blend relationship acts a bit differently. Since the Target data source only has data for 2024, when we blend by Year, the values for other years will show as ‘null’ (empty). The Region and Segment fields still divide the target values by year, but other years will have no data.
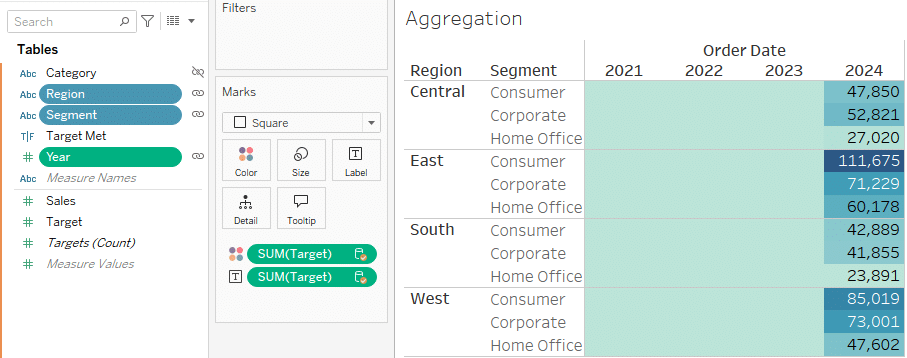
When Year, Segment, and Region are all active, then each cell in the 2024 column has a different value. The target values displayed are different for each combination of those dimension values.
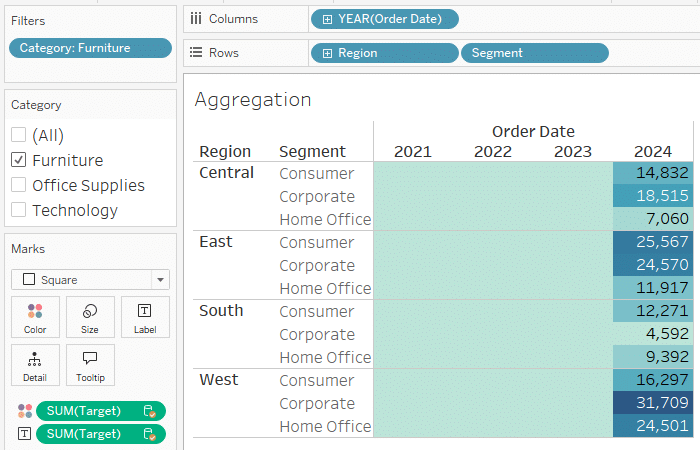
What about the Category relationship? Right now, Category isn’t included in the worksheet, so activating the Category relationship doesn’t change anything. But when we add Category to the worksheet, even as a filter, then the Category relationship will start to affect the view. For example, when Category is added as a filter, and the relationship is active, the target values will reflect the filter settings.
Scenario 3: Why workbooks might use multiple blend configurations
This table compares total Sales vs Target for 2024, breaking Sales out by Region and Segment. Right now both the Region and Segment blend relationships are active. This means that each target value is broken out by Region and Segment as well.
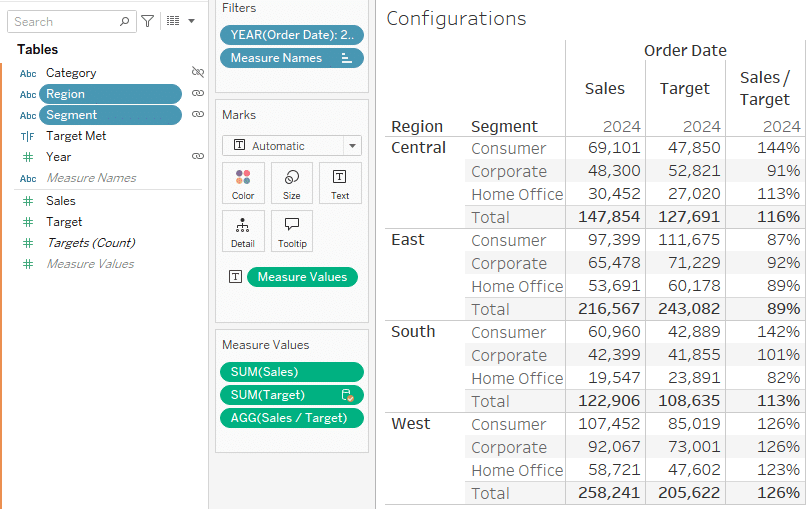
Let’s say we are interested in the Central > Consumer row, which we just saw outperformed their sales target by 44%. Can we claim that they achieved over 50% of the Central target on their own? By deactivating the Segment blend relationships, the Target values will show the total Region targets. Then we can compare the Central Consumer sales to the total Central target.

In situations where you want to use both the granular values and the overall totals from the secondary data source, blending can allow you to move easily from one level of detail to another without any LODs or Table Calculations.
Tips for troubleshooting blends
When I’m working with blended data, I spend extra time validating the results. I always start with a simple table and add the relationship fields from both the primary and secondary table first. Then I add the other necessary dimensions and measures to the table. If I’m seeing accurate results, then I’ll duplicate the worksheet and use it as a starting point for my visualization. I save this table as a source of truth to compare to the final view.
![]()
If you are seeing unexpected nulls, start by checking the relationship fields. Do they share the same data type? Do the values match between tables?
If you are seeing unexpected asterisk (*) errors, try making the view more detailed, adding IDs or other dimensions so that the secondary table values match just one row. If you can’t get to a low enough granularity, your secondary table might be more detailed than your primary. You may need to rebuild the view starting with the other table to swap the primary and secondary roles.
Filter related data sources
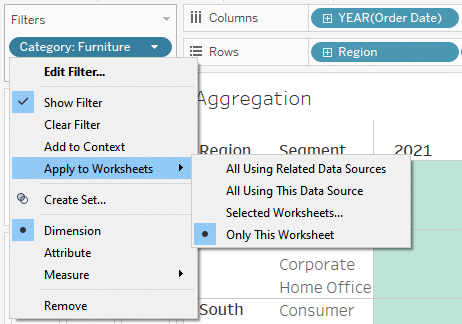
Filters can be applied across related data sources. To do this, create a filter. Click on it, select Apply to Worksheets, and select either All Using Related Data Sources or Selected Worksheets.
For worksheets set up with the filtering field in the primary data source, this will act as a basic filter. For worksheets with a different primary data source, the filter will come from a secondary data source.
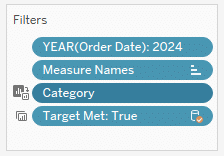
When a filter is applied across worksheets with different primary data sources, you’ll see an indicator to the left of the filter that includes two icons with an arrow between them. When a filter is being applied from a secondary data source, you’ll see an orange secondary data source indicator on the filter.
These worksheets need to have a blend relationship set up with the filter’s origin data source. Fields directly referenced by the blend relationship can be shared between worksheets with different primary data sources. Other fields can only be shared between worksheets with the same primary data source.
Filters applied from a secondary data source will only affect the view if the relationship is active. For example, if we create a filter on Segment using the secondary data source, and then deactivate the Segment blend relationship, all segments will be visible regardless of the filter setting.

Because blends can be unpredictable, it’s always best practice to test that the filter is performing like you expect it to!
Use cases for data blends in Tableau
Blends work best for situations where each view primarily uses just one data source, and the workbook has minimal interaction between data sources. They can be the only option in situations where Joins or Relationships aren’t available because of data connection type. Blends excel in the rare situation when you need to join two tables using different conditions in different views.
If you’re looking for more tips for working with multiple data sources, check out the fourth tutorial in this series: Working Across Independent Data Sources.
Thanks for reading,
Felicia

Written By
Felicia Styer

Peer Review
Rafael Simancas
Sr. Manager, Brand Strategy
Related Content
3 Ways to Optimize Tableau Workbook File Size

Are you running into file size issues when you attach Tableau workbooks to emails? Has IT asked your team to…

Felicia Styer
Learn about Joins, Unions, and Tableau’s Physical Layer This video demonstrates how to access Tableau’s Physical Layer and combine tables…
Why It’s Important to Understand the Granularity of Data

When kicking off a project involving data, one of the first questions will be, “Do we have the right data…