Bringing Tables Together: Multi-fact Relationships in Tableau

Welcome to our series on bringing tables together in Tableau where this tutorial walks through a deep dive into multi-fact relationship models. This is an enhanced type of Tableau Relationship released in version 2024.2. It allows users to have multiple base tables, each of which can be connected to the downstream tables. If you aren’t familiar with the basics of Tableau Relationships, check out Relationships and the Logical Layer tutorial before reading this one.
Other posts in this series
Part 1 – Joins and the Physical Layer
Part 2 – Relationships and the Logical Layer
Part 3 – Blending Data Sources
Part 4 – Working Across Independent Data Sources
Building multi-fact relationships on the logical layer
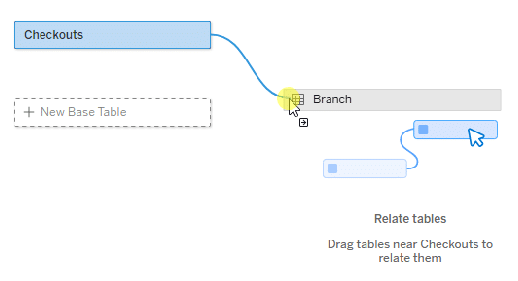
To create a Tableau relationship, bring a table into the logical layer. Then drag a related table into the layer and drop it when you see the ‘noodle’ appear.
Continue reading with a free account, or login.
Unlock this tutorial and hundreds of other free visual analytics resources from our expert team.
Already have an account? Sign In
By continuing, you agree to our Terms of Use and Privacy Policy.
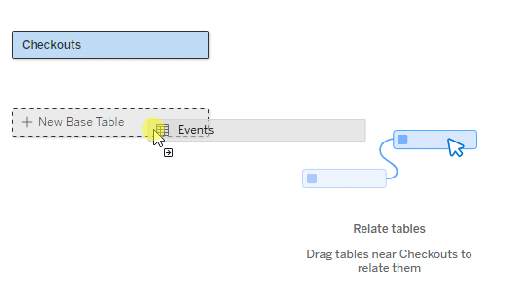
To create a second base table, drop it on top of the + New Base Table prompt.
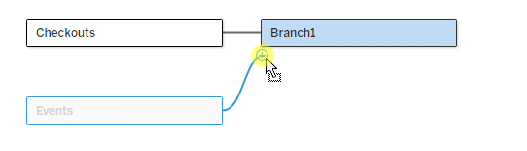
Some tables in your data model may be related to just one base table. You can add these normally. Shared tables connect to multiple base tables (sometimes indirectly). To add a second base table connection to a shared table, hover over the right side of a base table until a + appears. Then drag that connector to the desired table.
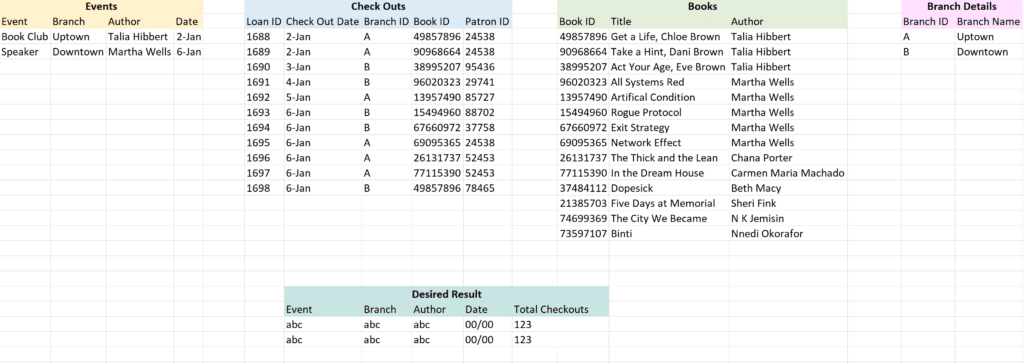
If you would like to follow along, this tutorial will use the same mock library dataset as we used in the Relationships tutorial. I created this data set to illustrate inner vs outer joins, working across granularities, and foreign keys. It represents a week of data from a very small library system and includes tables for Check Outs, Check Ins, Book Details, Branch Details, and Events.
Let’s revisit scenario 3 from the original Relationships tutorial. In this scenario, a librarian wants to know how many checkouts resulted from their events. We can match events to checkouts based on the date, location, and author. However, the events and checkouts tables store these values differently. We’ll need to use lookup tables to link Author to Book ID, and Branch Name to Branch ID.
In an ideal setup, the Tableau relationship would link Events to Checkouts using Date, and then link both tables to Books and Branch Details. This can’t be done using just the logical layer because it would require at least one table to have multiple upstream connections.
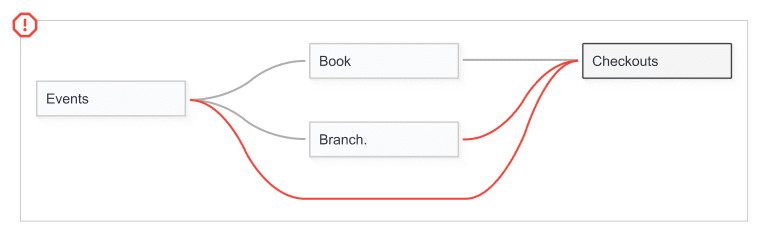
Instead, we can designate Checkouts as a base table along with Events, and connect both base tables to the Book and Branch tables.
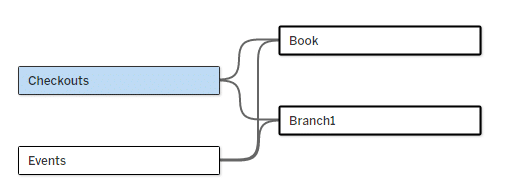
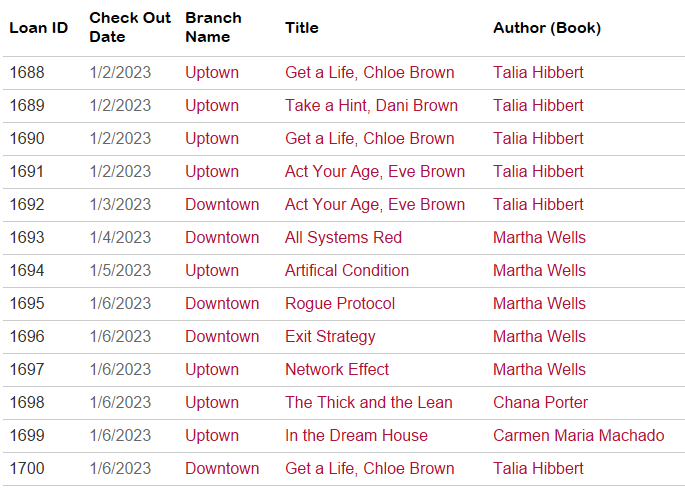
Now we have a data source where we can easily create a table of Checkouts or Events with Book and Branch details. Here, the Branch Name, Title, and Author have been added to the Loan Details table using the shared tables.
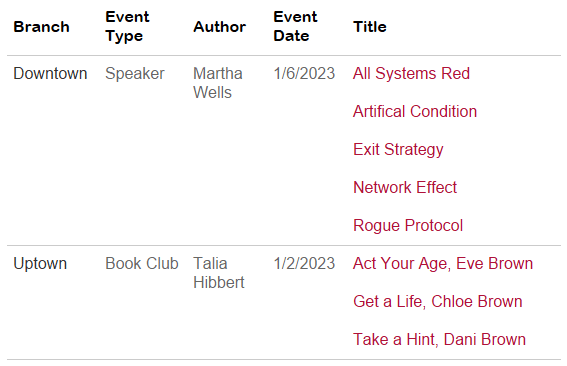
We can use a similar approach to bring a list of relevant books into this table of events.
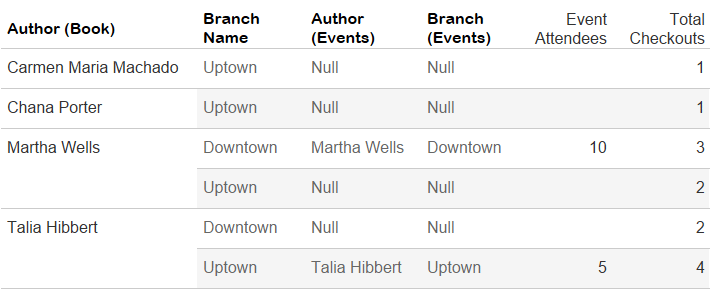
It gets more complicated when we use fields from separate base tables in the same view. We can put two measures from separate base tables into the same crosstab. It’s important to use dimensions from the shared tables instead of the base tables when possible. Using dimensions from the base tables may result in nulls or trigger relevancy filters.
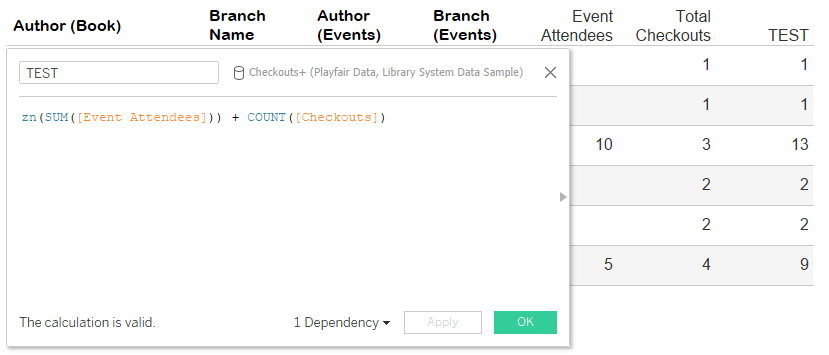
We can even use measures from two separate base tables in the same calculation – just make sure to use ZN() to avoid unexpected nulls! For example, this calculation might not be meaningful, but it does not throw any errors!
zn(SUM([Event Attendees])) + COUNT([Checkouts])
Our main limitation with multi-fact relationships is that row level calculations can not reference two fields with different upstream base tables. In our data mode, this means that we can’t create a calculation that compares the Checkout Date to the Event Date.
![]()
Let’s go back to the original question and figure out how many checkouts share the same author, location, and date with an Event.
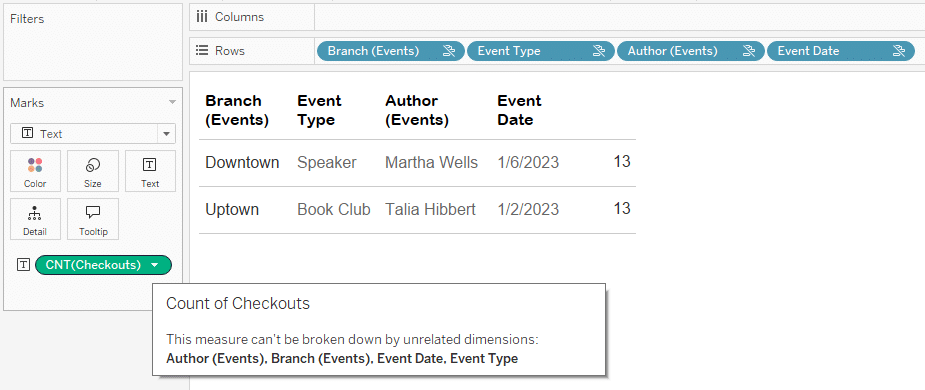
To start, let’s look at a simple table of event details with the Checkouts measure added. Using the dimensions from the Events table, the Checkouts measure gives us the total checkouts in the data source. When you hover over the measure, you’ll see an alert that it can’t be broken down by the dimensions from the Event table.
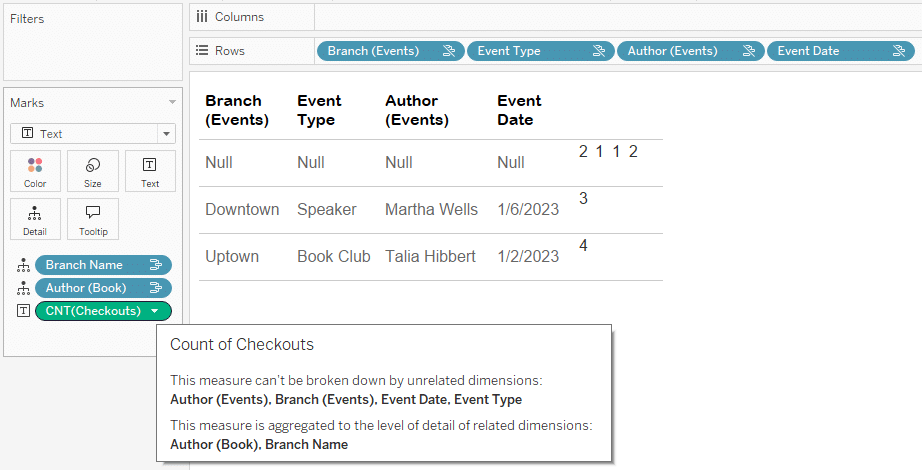
To link the data sources, let’s bring in Author and Branch from the shared tables. This creates a new row for checkouts that aren’t related to the Events table. Now, our checkouts are limited by Branch and Author, but not Date. This causes the checkouts to be overcounted, as they aren’t restricted by the checkout date.
We can’t fix this issue with a traditional calculation or filter. The Event Date and the Checkout Date are completely unrelated and cannot be referenced by the same calculation. To get around this, we add a fifth table into the data model, a simple list of date values.
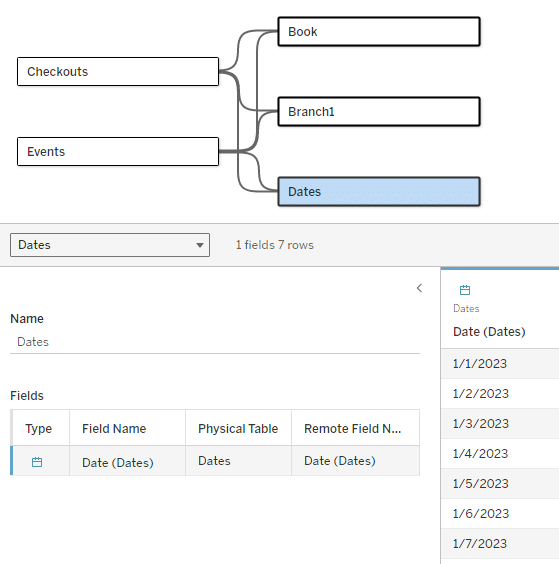
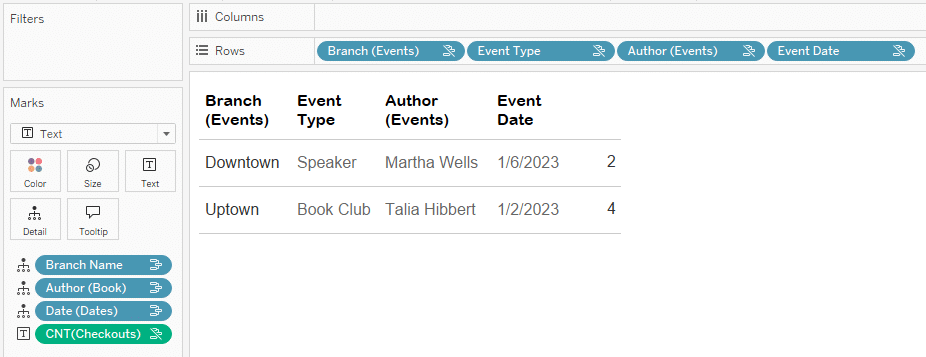
Now we can add Date from this new shared table to the Detail property of the Marks card to see the related checkout count. As a final step, we can also hide the null row to tidy the table up.
If you would like to learn more about Multi-fact Relationships and how to optimize them, read When and How to Use Multi-Fact Relationships from the Tableau dev team.
Thanks for reading!
Felicia

Written By
Felicia Styer

Peer Review
Rafael Simancas
Sr. Manager, Brand Strategy
Related Content
How to Mask Survey Results in Tableau
Anonymous survey analysis has one key challenge – how do we incorporate categorical and demographic information while protecting the participant’s…

Ryan Sleeper
Start on the right foot by properly preparing data for Tableau The single biggest barrier to Tableau adoption is properly…
How to Pivot, Unpivot, and Double Pivot Data in Tableau Prep
One of the first topics I cover during my live training events is what I view as the single biggest…