Understanding Confidence Intervals in Tableau
A soundwave chart, which gets its name for its resemblance to a soundwave (shocking, I know), is excellent for measuring volume across time, dimensions, or other discrete bins. To better understand what a soundwave chart is, let’s first think about music. Throughout the runtime a song, the volume of the song will get louder and quieter. To visualize the song’s volume, we could create a soundwave chart where the bars get larger or smaller depending on the measure of volume across time (the length of the song). In other words, there is a bar for each second of the song, and each bar gets larger when the song’s volume increases then; conversely, the bars get smaller when the song’s volume decreases, creating a wave effect. We can recreate this soundwave effect in Tableau, but instead of measuring sound, we can use our own measures to compare how volume has increased or decreased over time, across dimensions, or across other discrete bins.
In this example, we will be creating a soundwave chart using the Sample-Superstore data to analyze how many orders have occurred at different price points.

Related video tutorial:

Premier Visual Analytics eLearning with Playfair+
Section 1
A soundwave chart has a discrete X-axis and a continuous Y-axis. Because we want to know how many orders occurred at different price points, we need to create bins for Sales, which will act as our discrete X-axis.
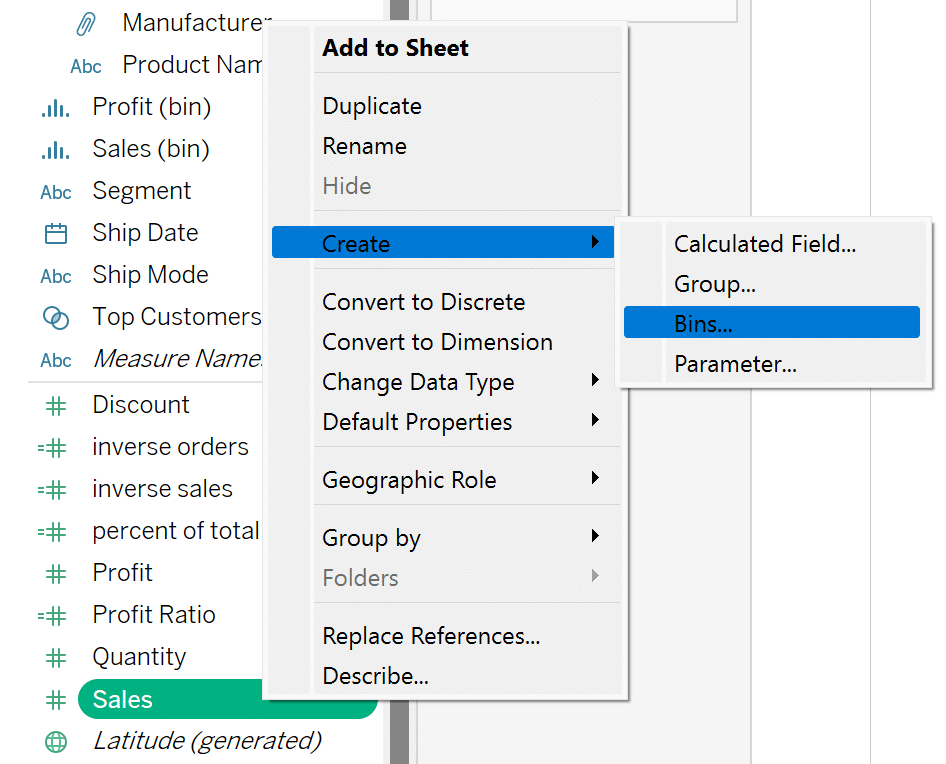
Right-click the Sales measure, select ‘Create’, then select ‘Bins…’.
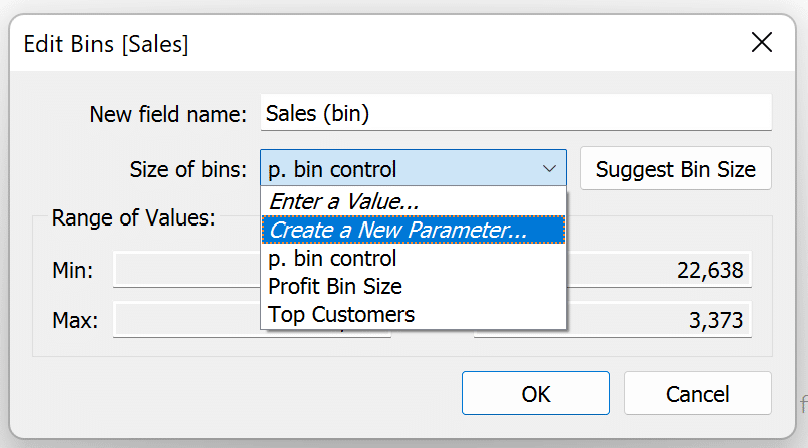
Let’s enhance the UX of this dashboard by making the bins dynamic with a parameter. Select ‘Create a New Parameter’ under the ‘Size of bins’ dropdown menu.
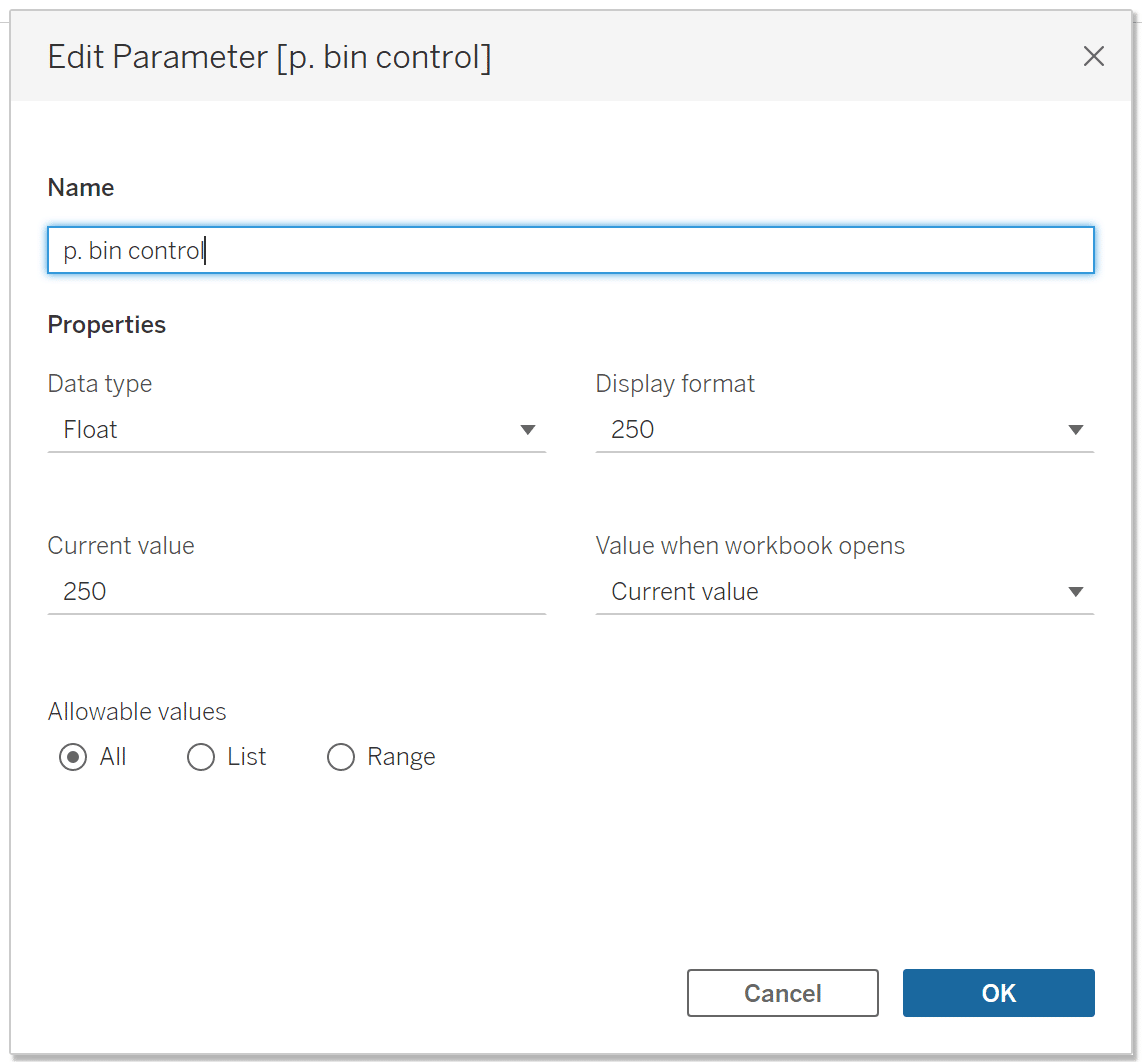
Name the parameter’ p. bin control’, keep the Data type as Float, make the Current value 100, and choose ‘All’ under Allowable values. Then choose Ok.
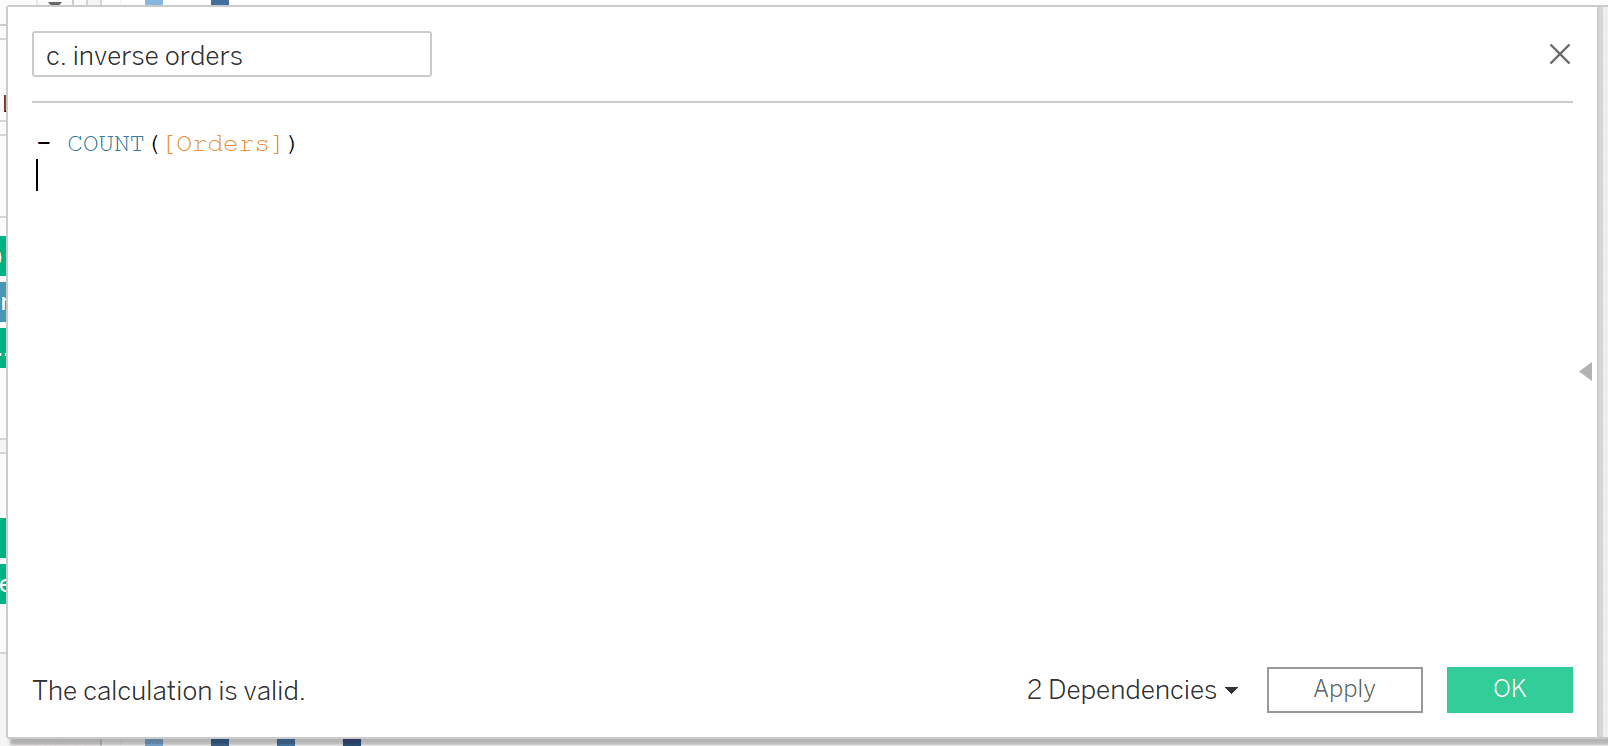
The last thing we need to create the soundwave chart is a calculation that takes the inverse of whatever continuous measure used on our Y axis (what the lines on our soundwave chart will be sized by). In our case, the count of Orders will be the Y axis. In the Data pane, select ‘Create Calculated Field…’, name the calculation ‘c. inverse orders’ and write the logic as ‘- COUNT(Orders)’. Select OK.
Section 2
Now that we have our Sales (bin), bin control parameter, and orders inverse calculation created, let’s begin assembling the view. Start by dragging the Sales (bin) parameter to the Columns shelf, then Measure Values to the Rows shelf. Remove everything from the Measure Values card except CNT(Orders) and c. inverse orders.
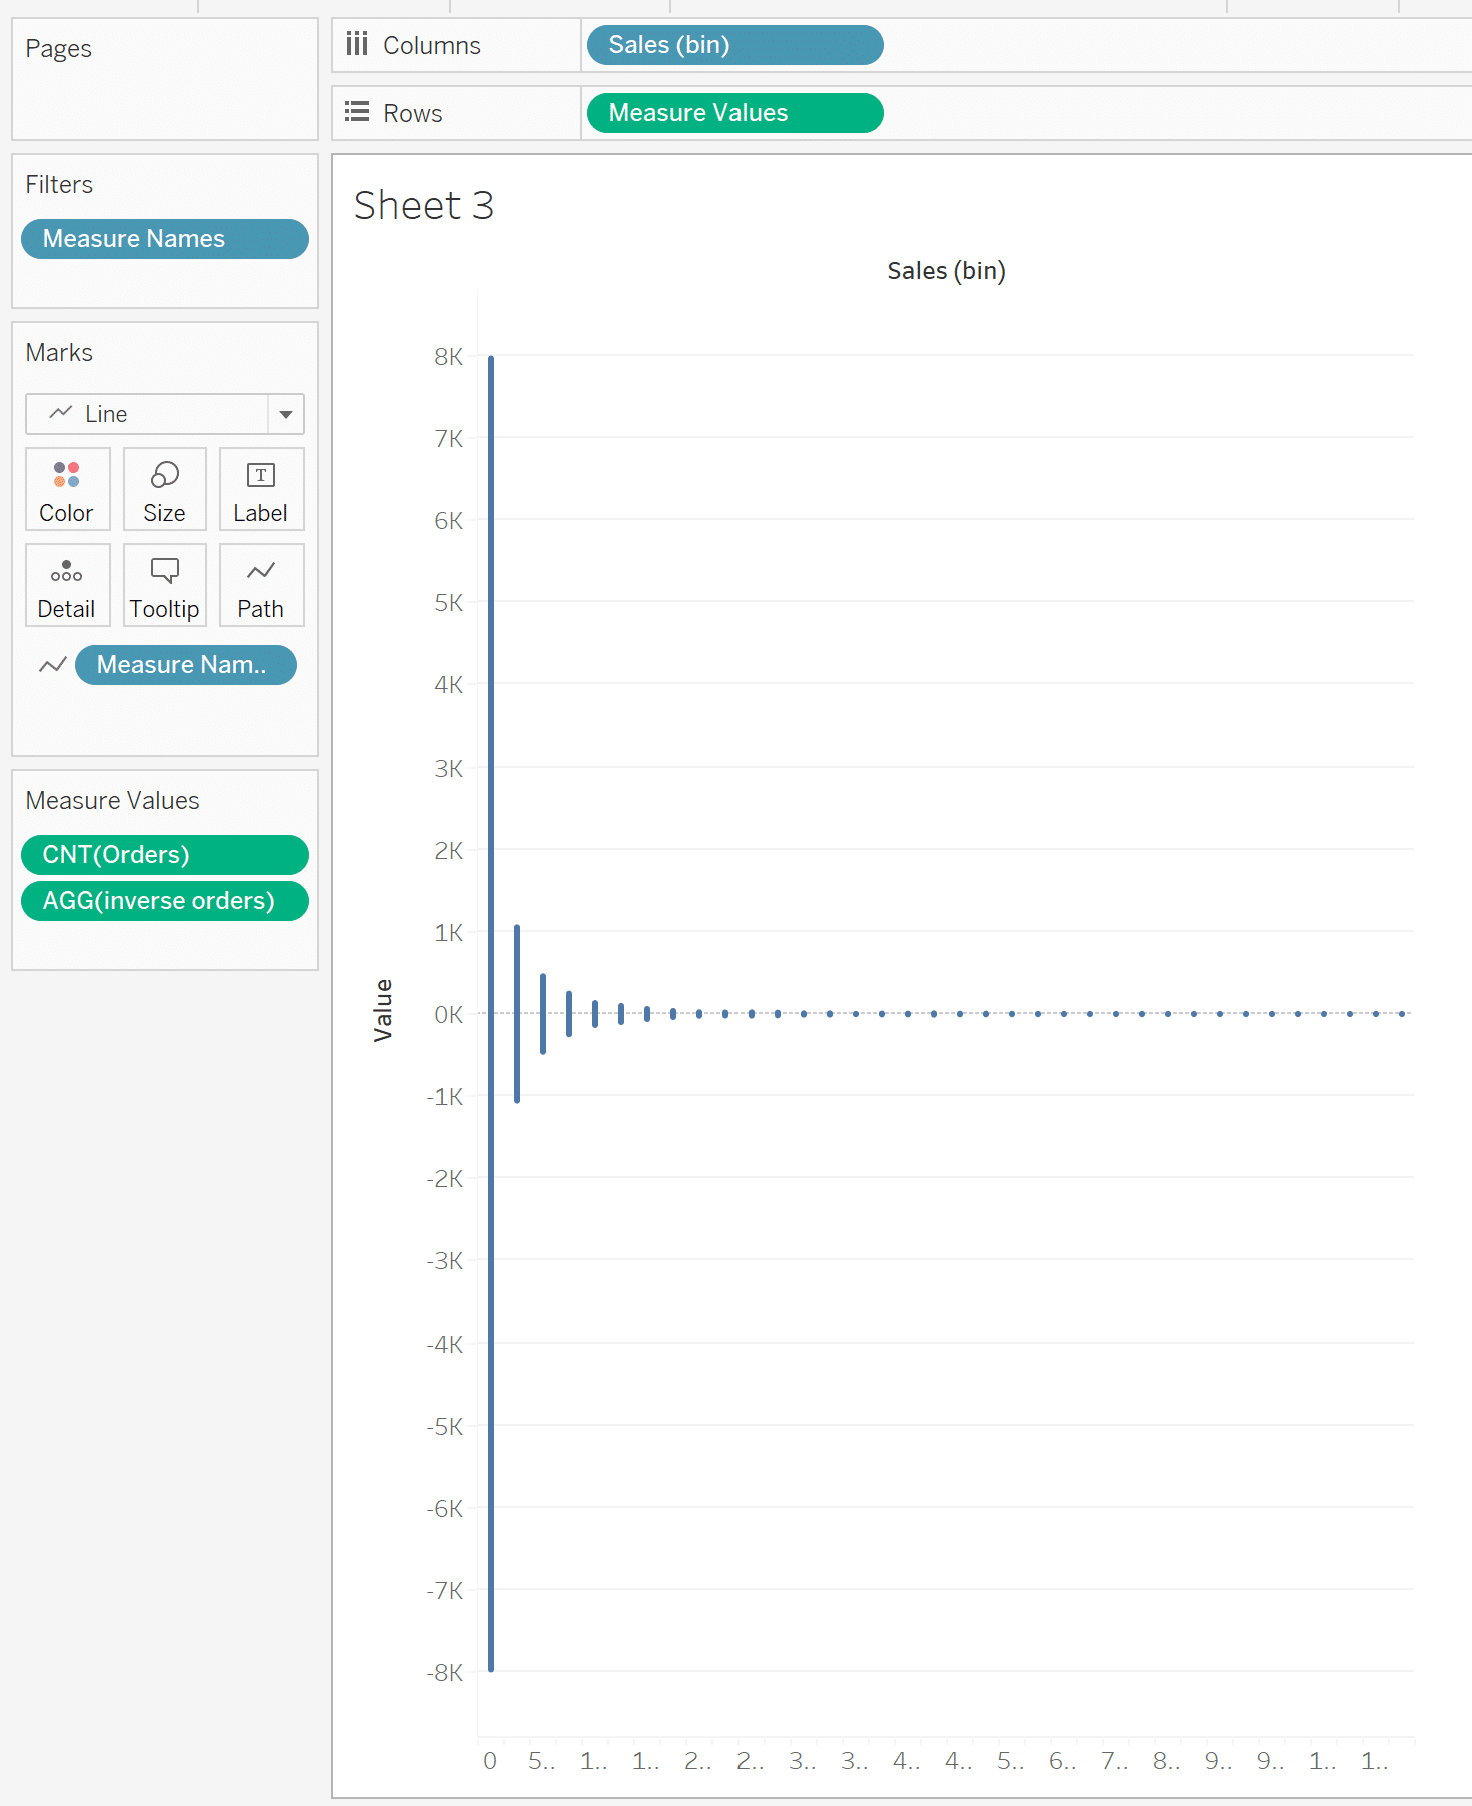
Add Category to the Filters shelf, select Technology only, and click OK. I want to know if there is a Sales bin that has a lot of orders but low Profit. So let’s add Profit to the Color property of the Marks card.
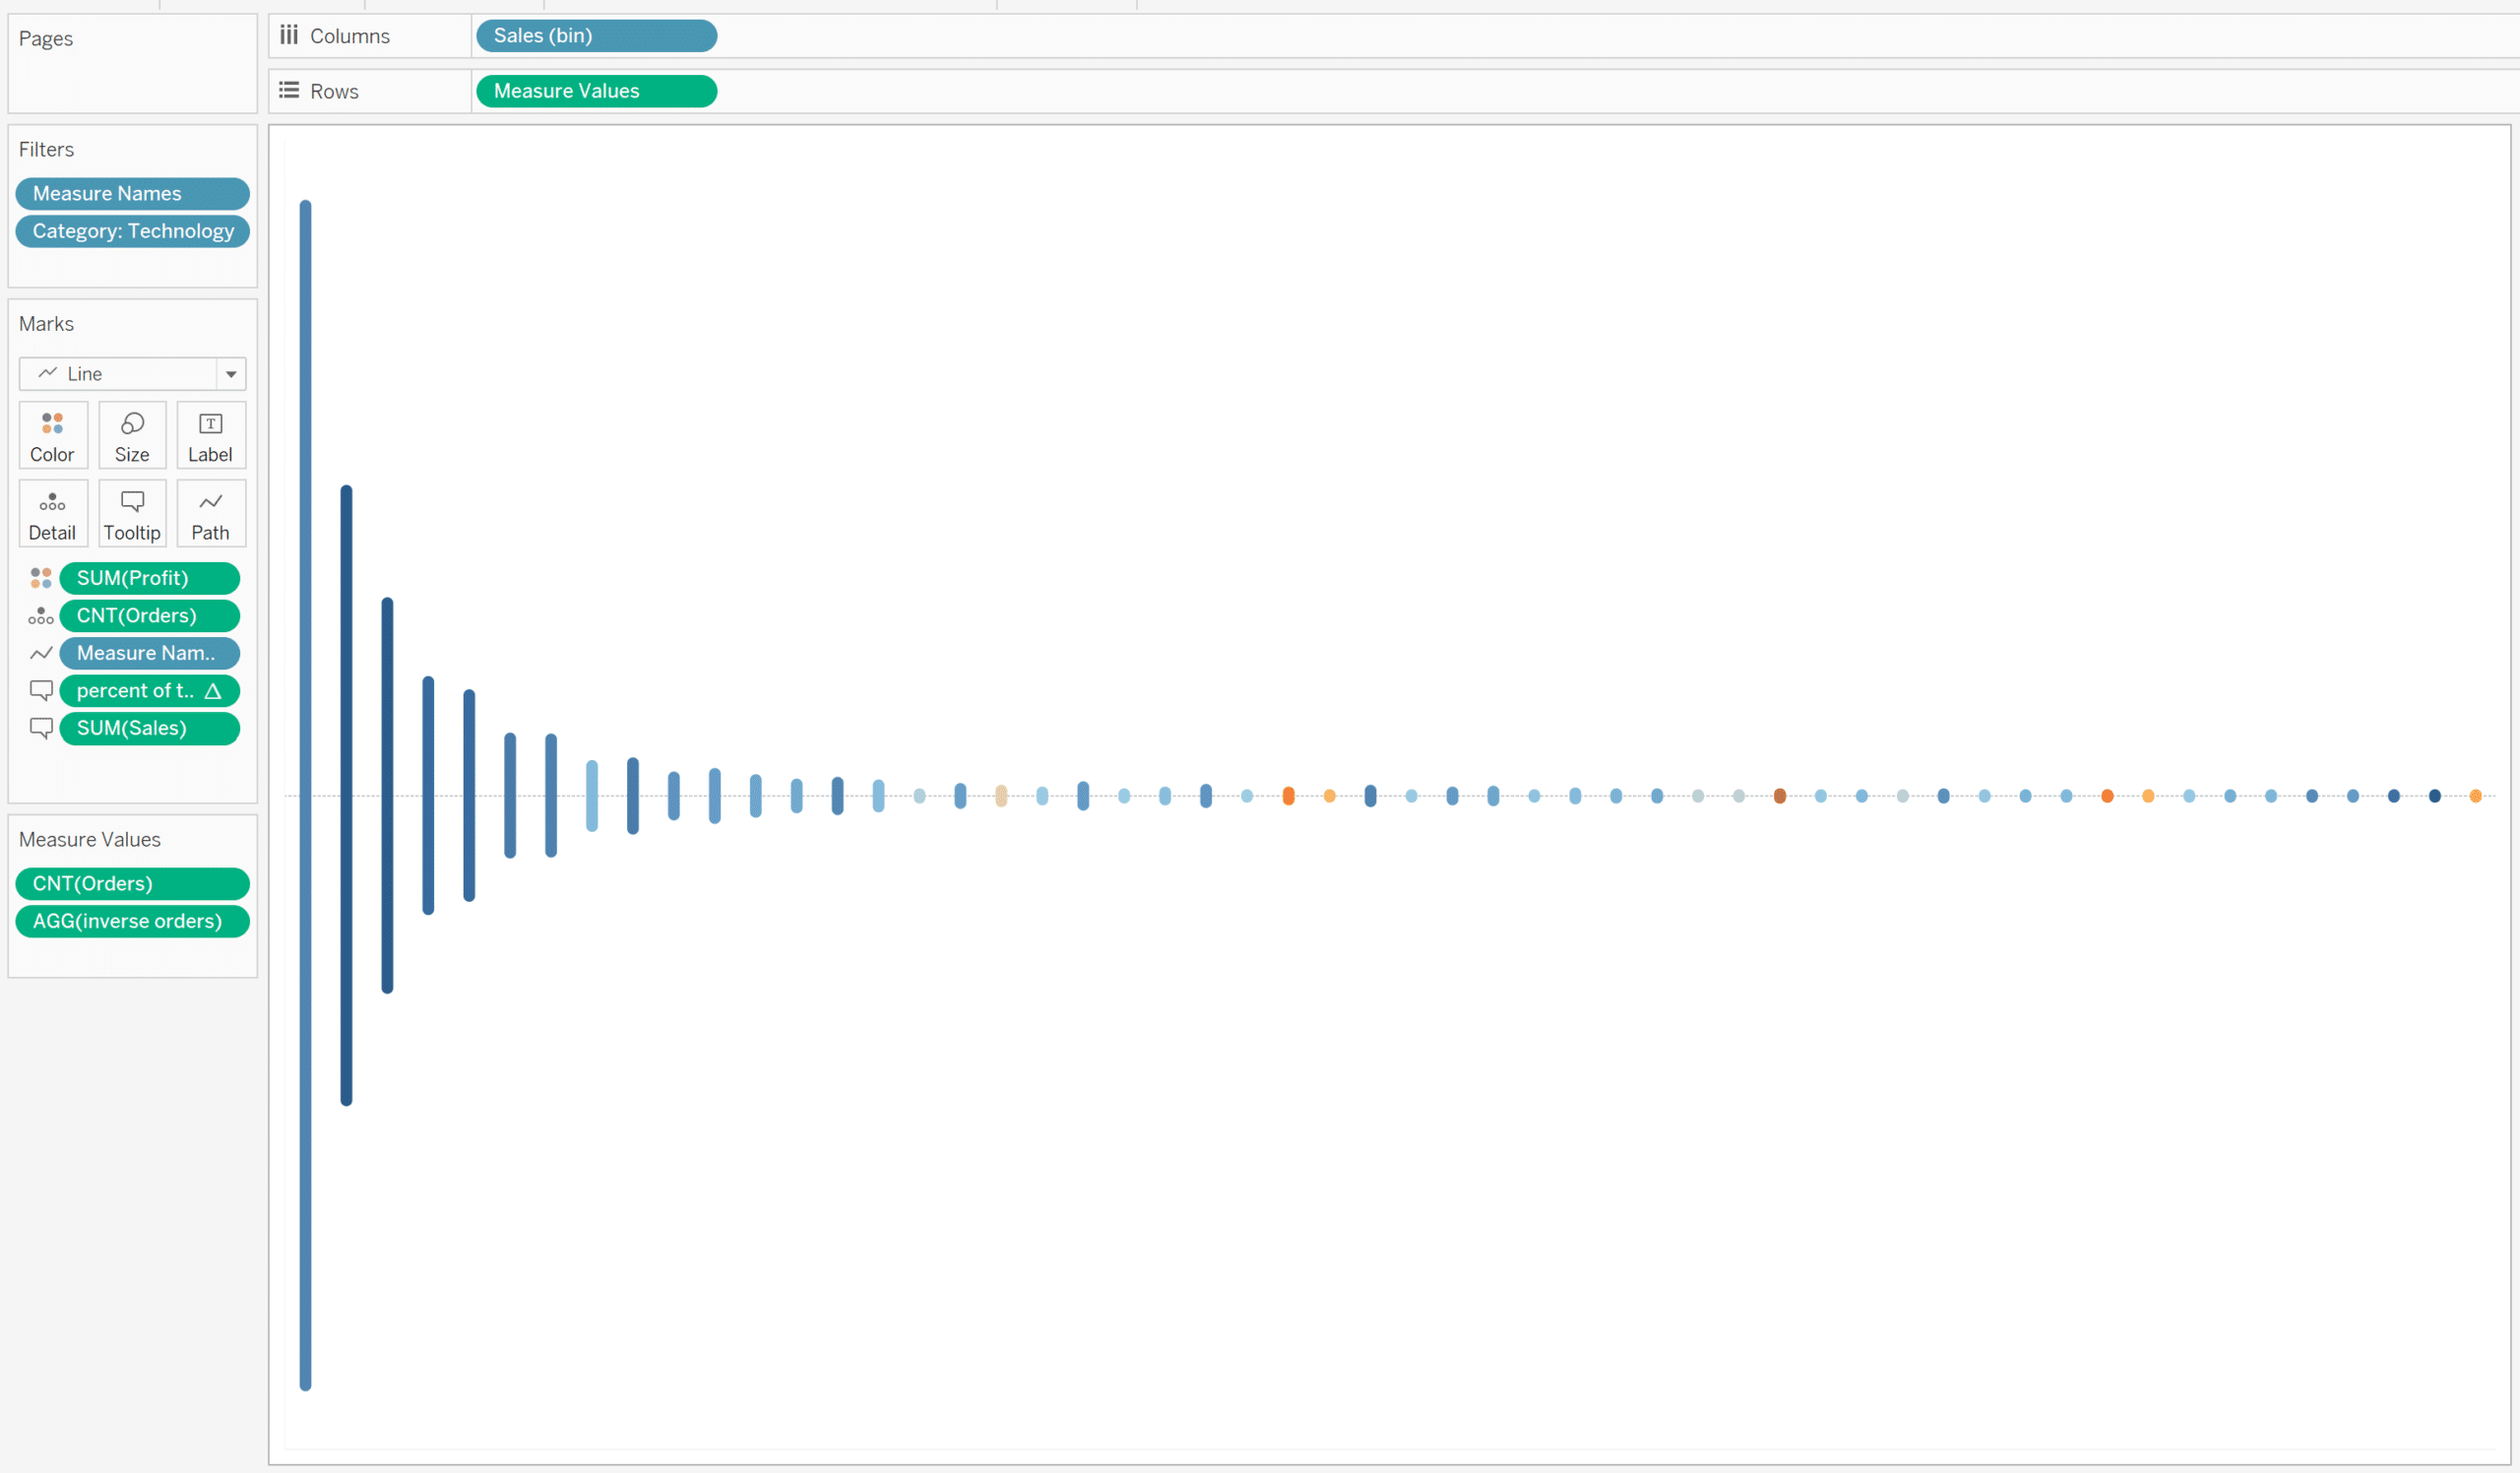
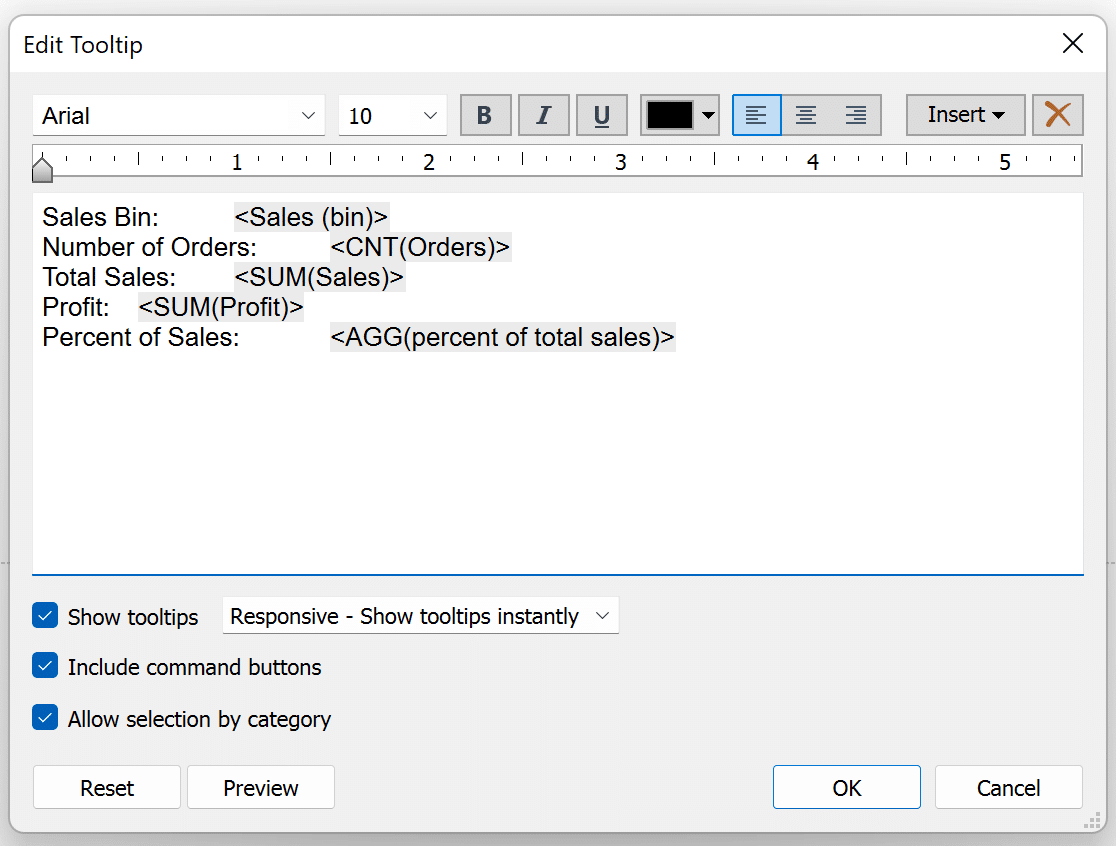
Next, we’ll format our Tooltips to show the user vital stats about each bin.
Section 3
Lastly, I think that it would be interesting to see the percentage of total sales in each bin’s tooltip.
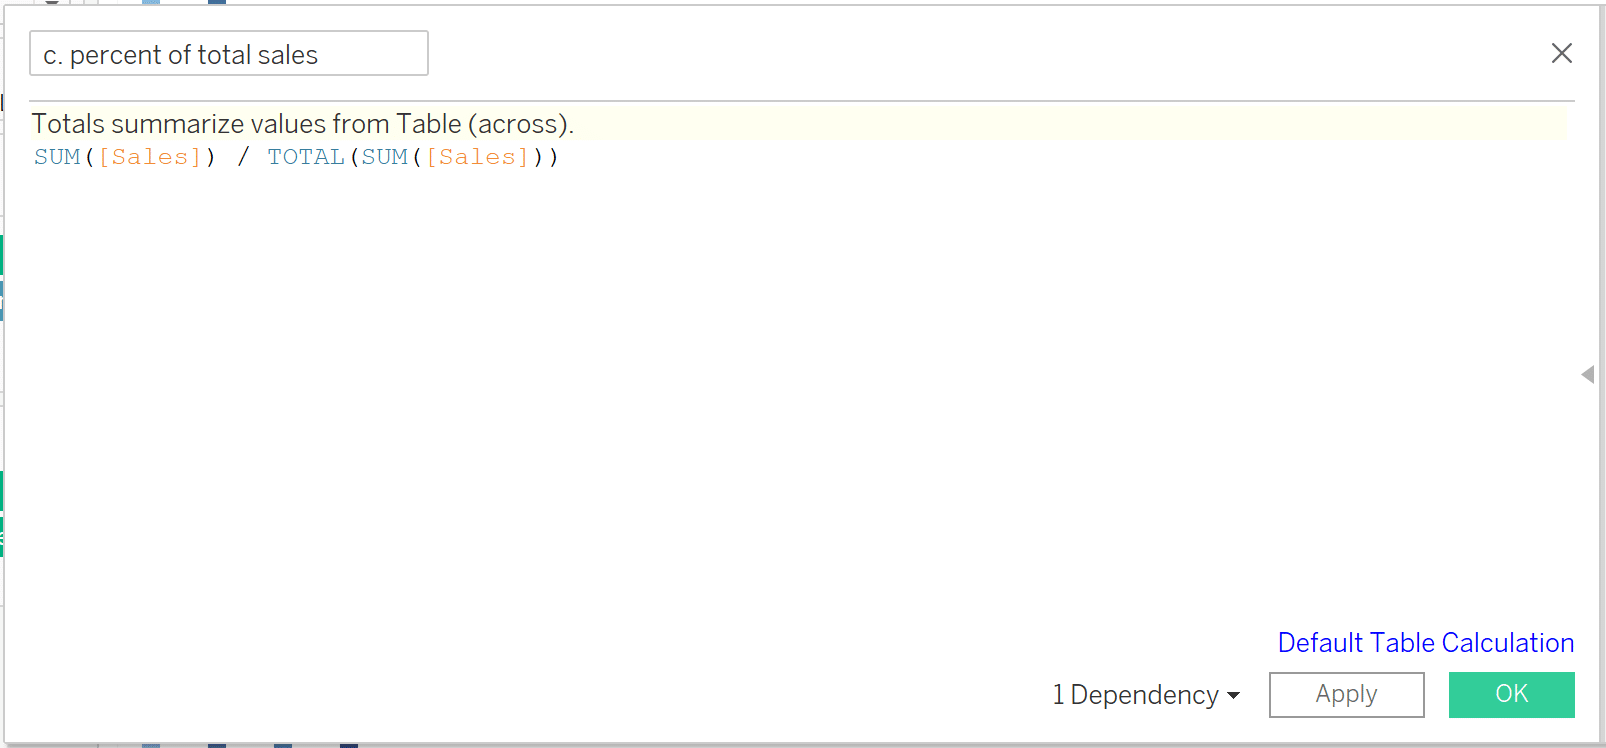
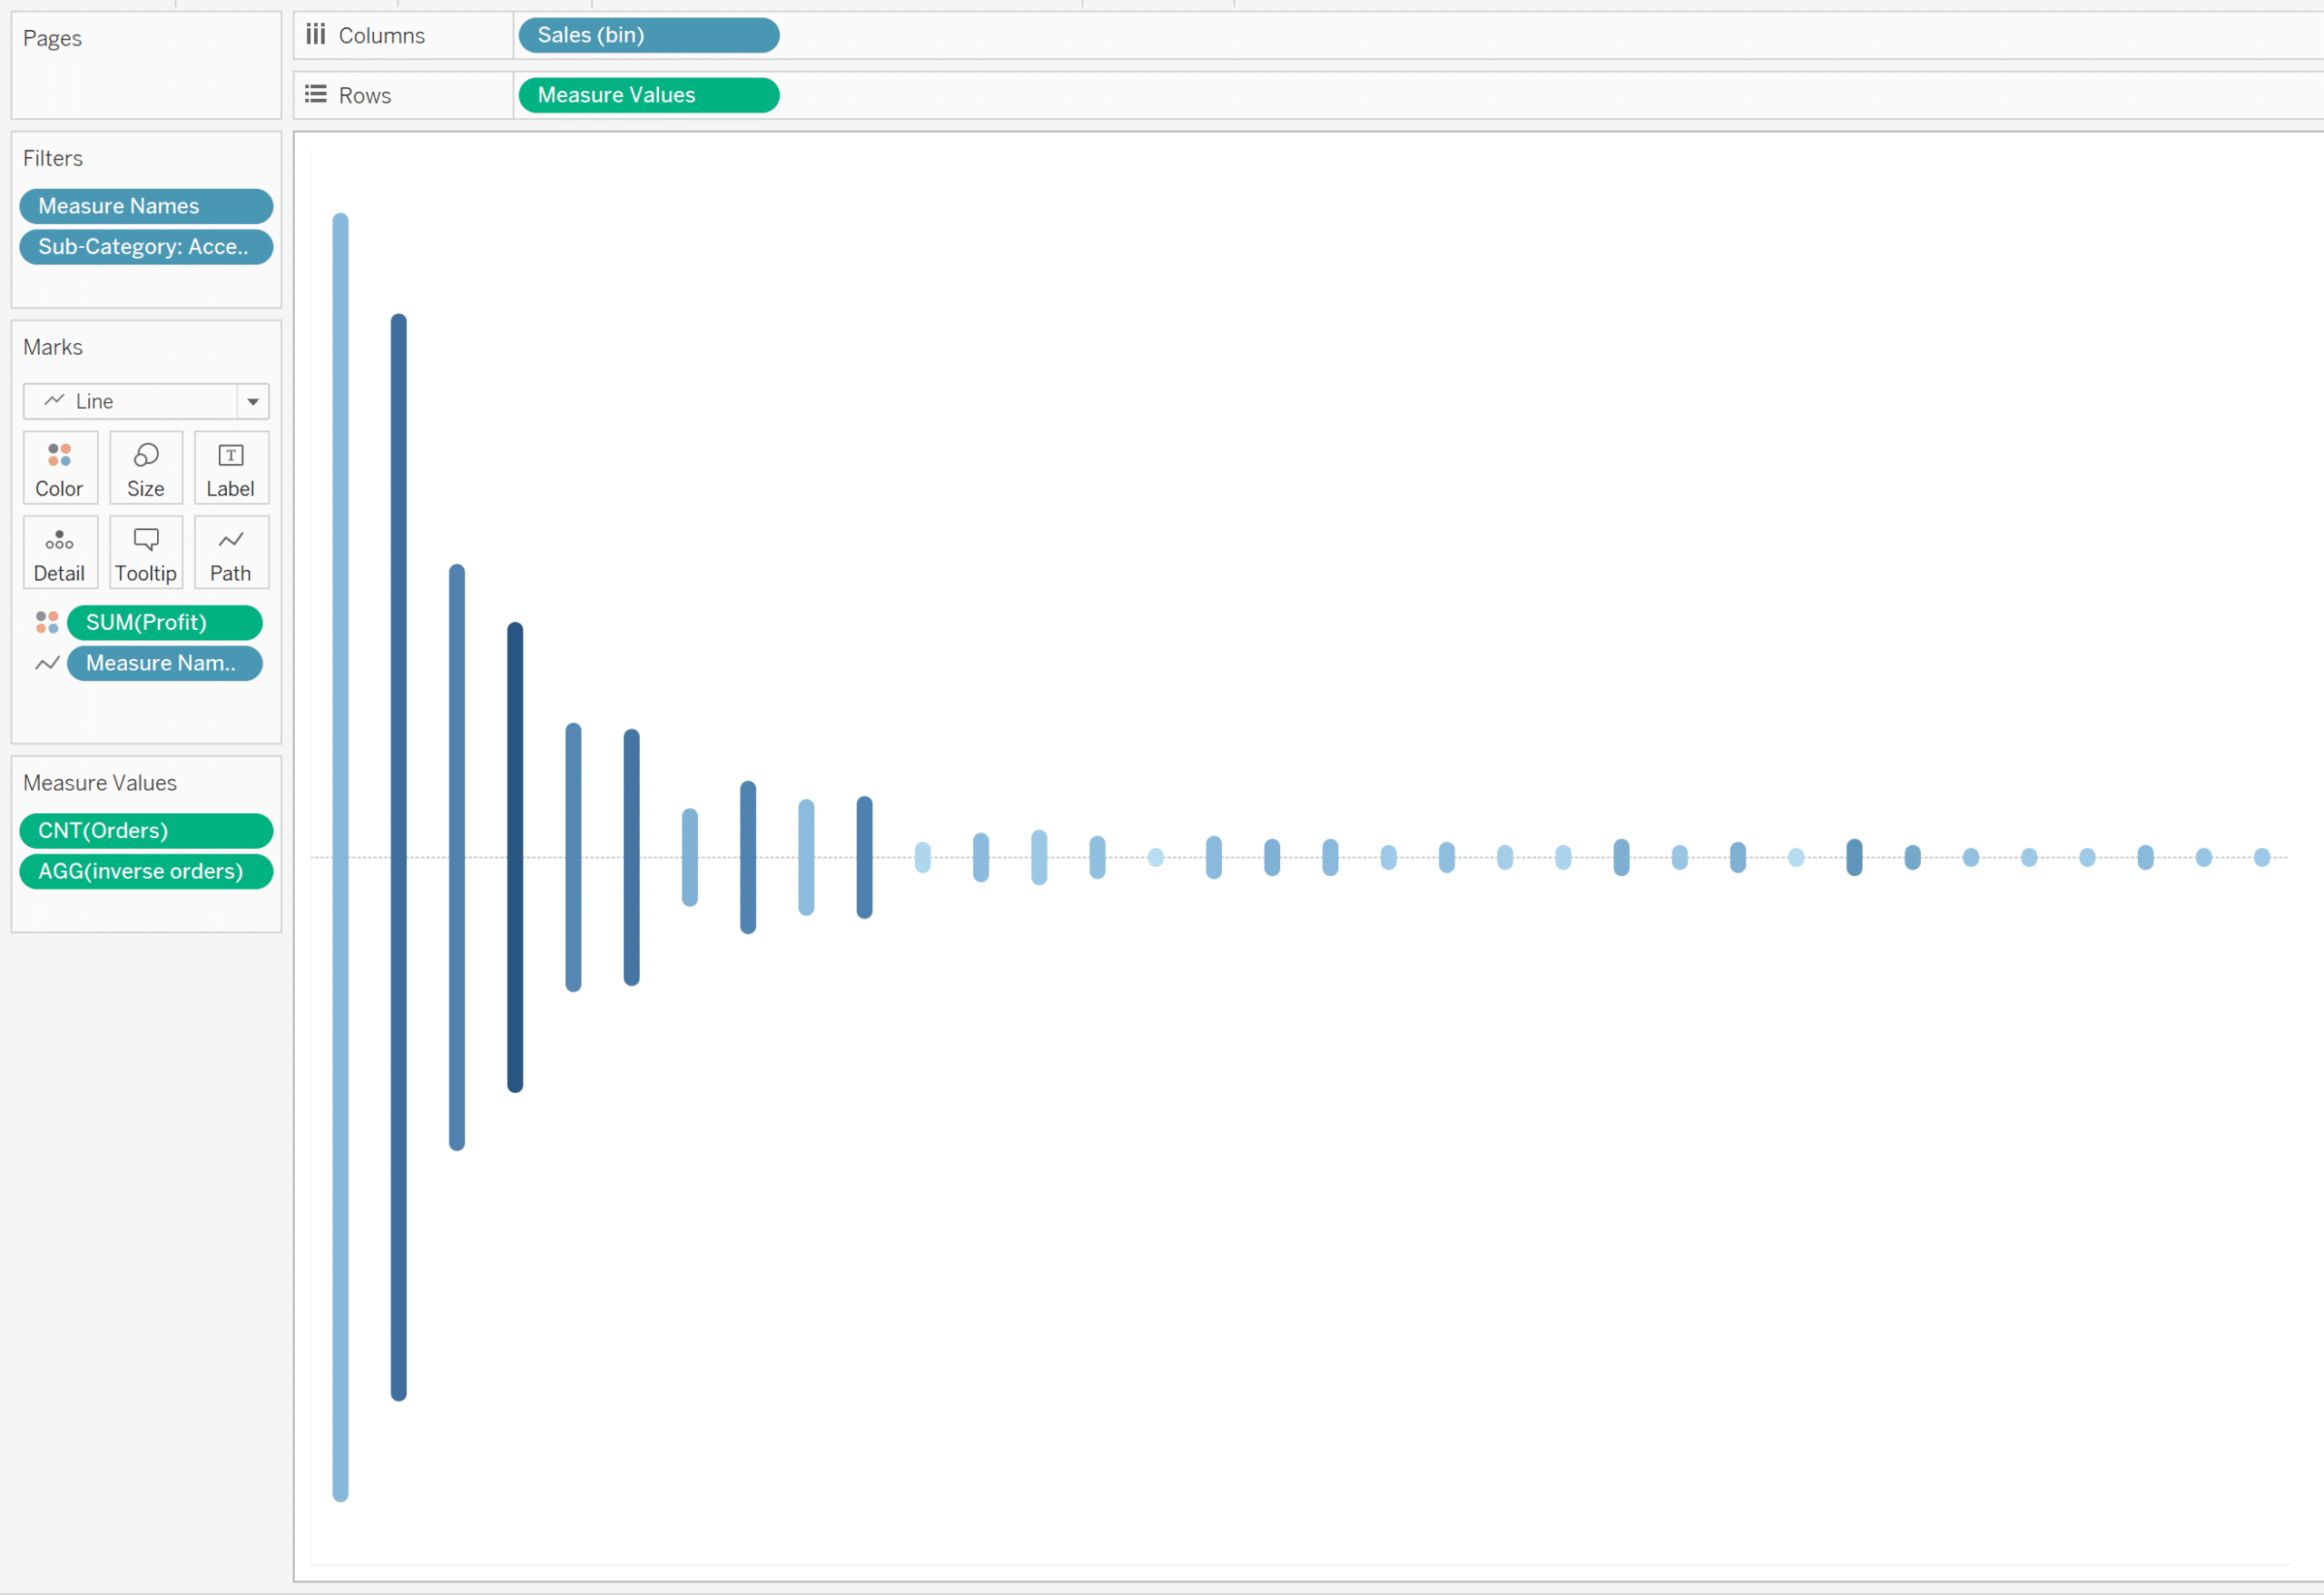
Show your bin control parameter and attempt some exploratory analysis. Change the parameter from 100 to 50, then to 25, and see how your soundwave chart changes for Technology. See how Technology compares to the other categories by showing your category filter and selecting Furniture, then Office Supplies.
Conclusion
These principles can be applied to almost any scenario to quickly and effectively display a comparison over time. One specific advantage to soundwave charts is their approachability to those who may be less familiar with data visualization. With the advent of music-data reporting from streaming services and more, this chart type will be familiar to most users and can be easily stylized for an aesthetic and easily navigated user experience.
Happy vizzing,
Dan
Related Content
How to Map Any Background Image in Tableau
The out-of-the-box Tableau symbol and filled maps are some of the most powerful visualization types available in the software. This…
How to Pivot, Unpivot, and Double Pivot Data in Tableau Prep
One of the first topics I cover during my live Tableau training events is what I view as the single…
How to Make Your New Favorite Commenting System in Tableau
I’ve shown you in the past how to add custom integrated insights to a Tableau dashboard. This tactic allows you…
