Advanced Tableau Mapping Series: Calculating Weighted “Center of Gravity”

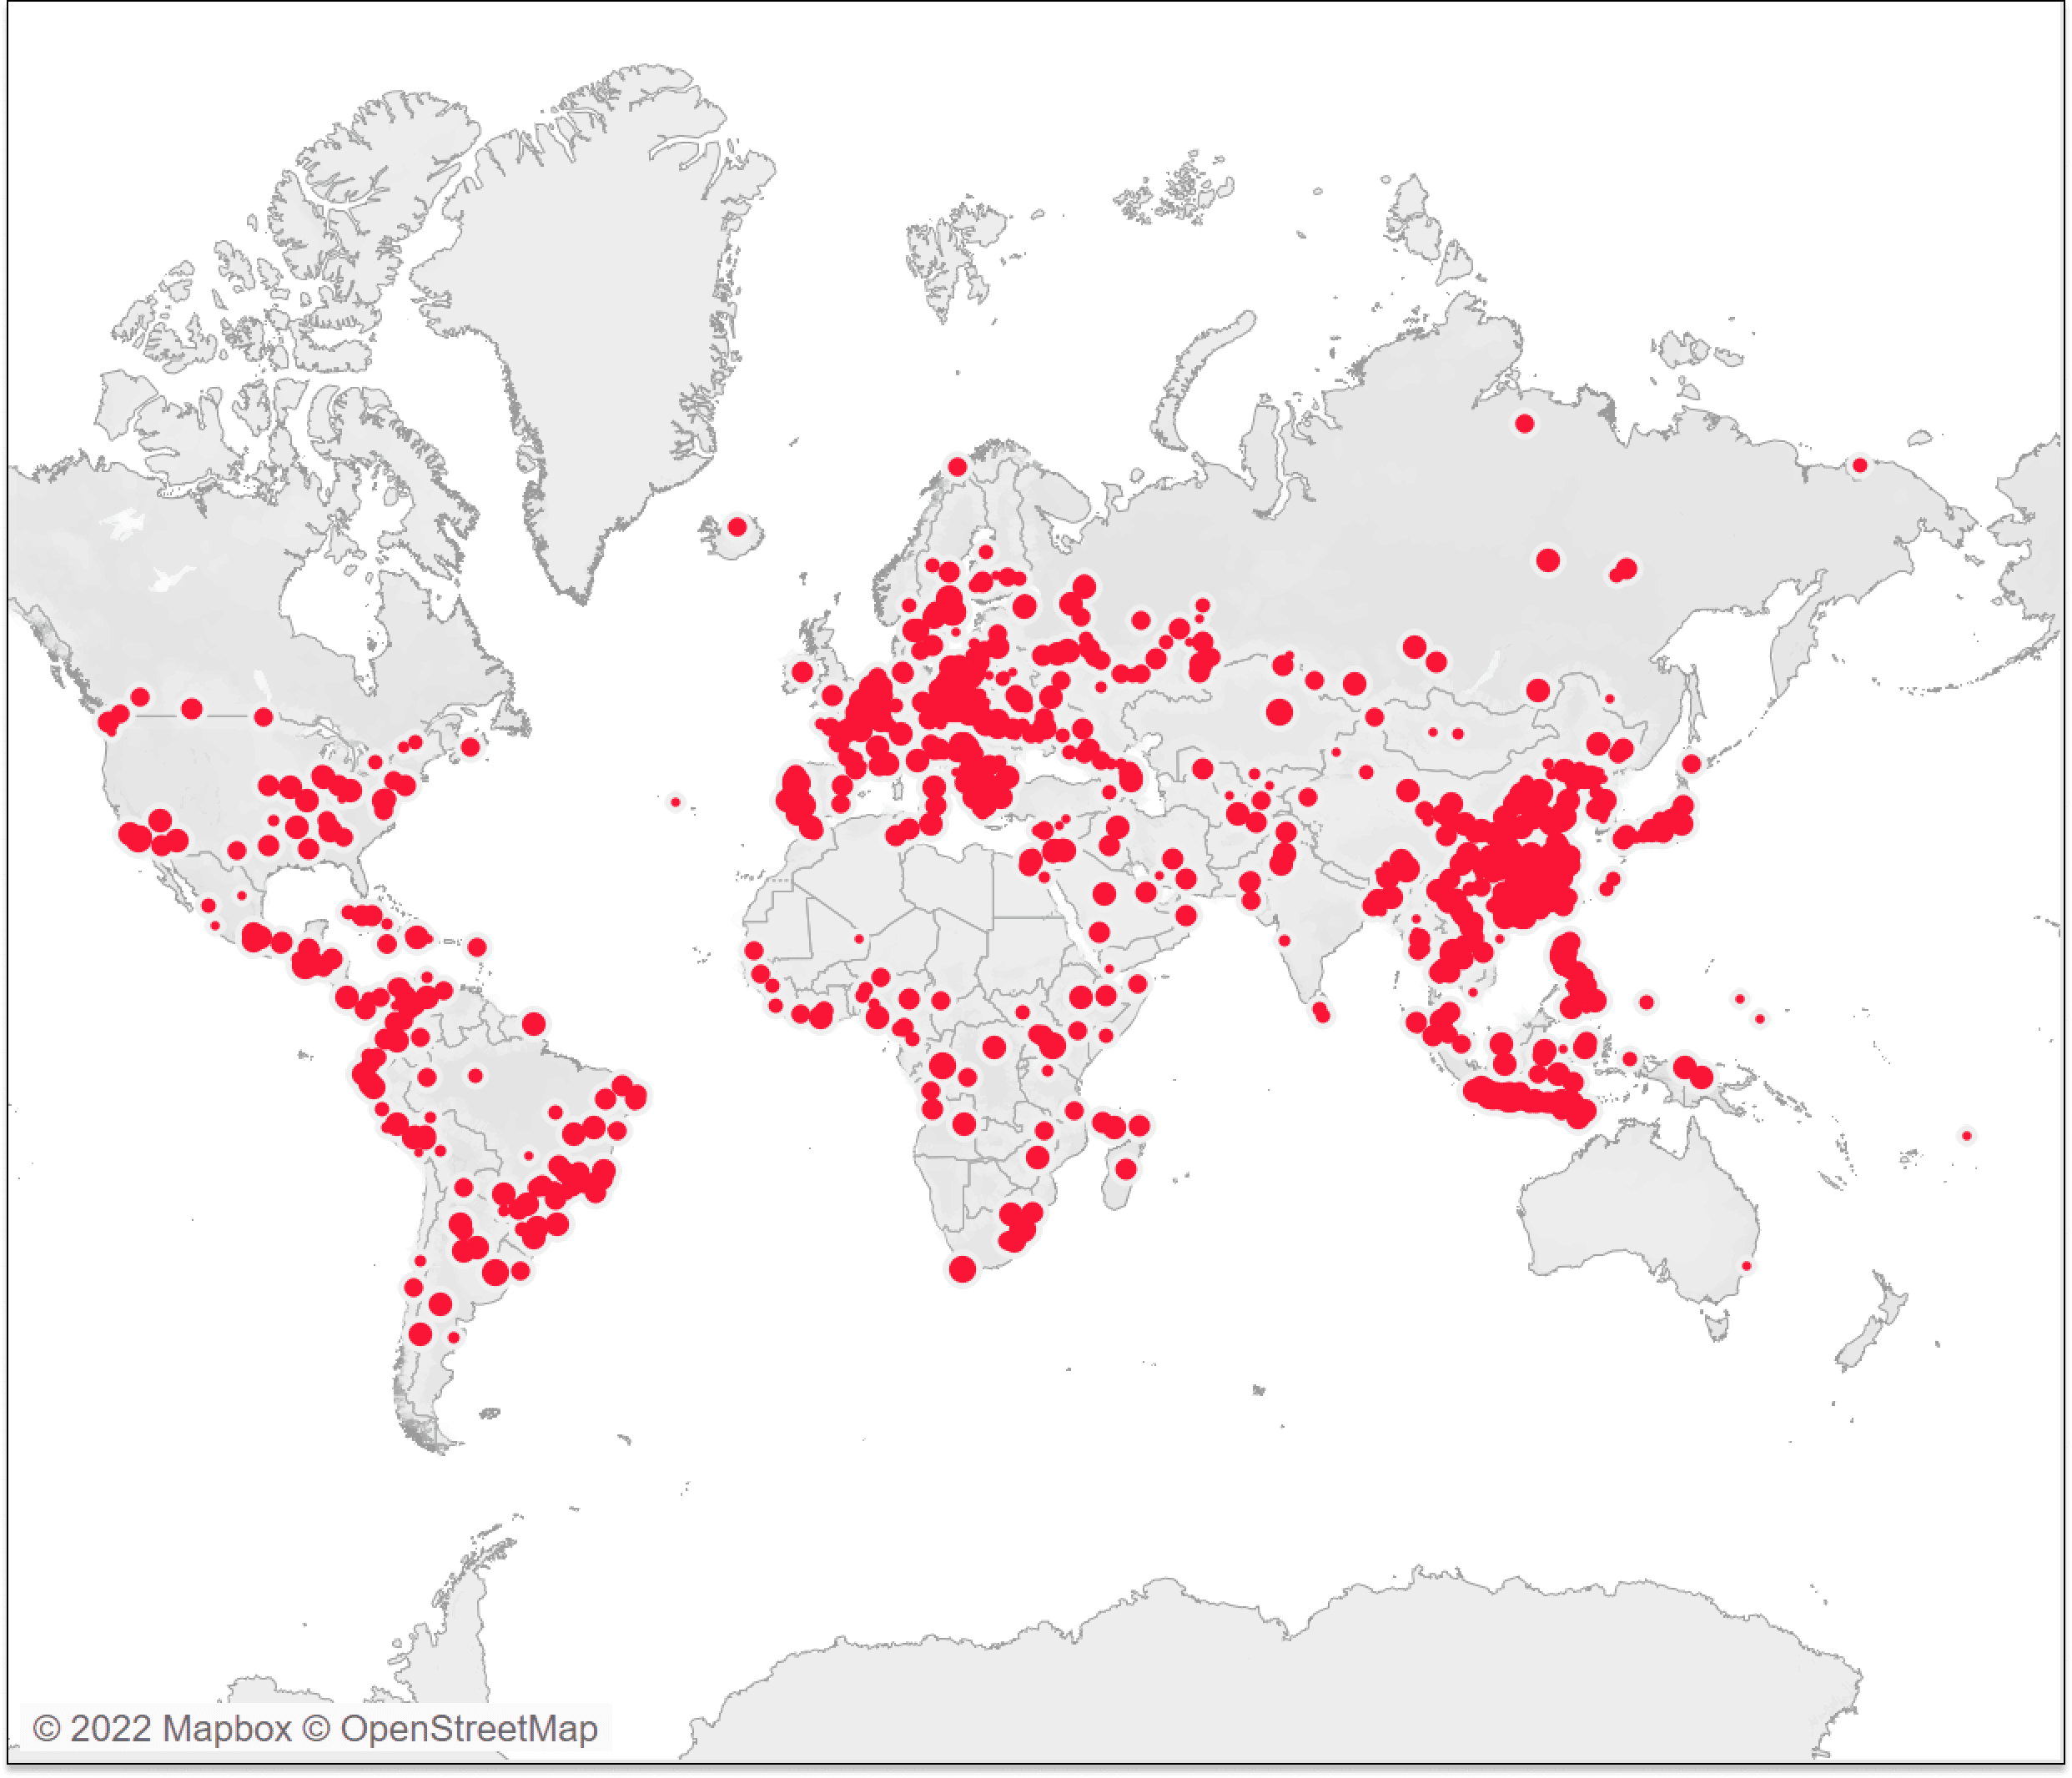
Advanced Tableau maps, like the one below, can sometimes be overwhelming to interpret. Each point on the map shows an individual sale. A stakeholder may pose the question, “Where is the center of this data?” They want to know where, if you were to average all these points, it would fall. Perhaps you are interested in opening additional distribution centers or looking to change your shipping strategy. From this visual alone, that is unidentifiable. In this blog, I am going to show you how to calculate in Tableau the average latitude and longitude weighted by sales.
Learn more advanced mapping techniques with Playfair+
It may feel tempting to simply drag your latitude and longitude to the view and set the aggregation to “Average”. While that may be okay for small subsets of the globe, the larger the area you are using, the more error you are exposing yourself to. The reasoning, simply put, is that the distance between two identical longitudinal coordinates can be thousands of kilometers at the equator but only a couple of kilometers closer to the poles.
![]()
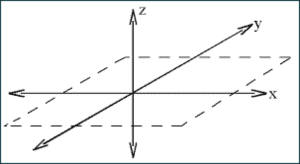
To get a more accurate average, I am going to convert the latitude and longitude into cartesian coordinates. Cartesian coordinates are the classic (x,y,z) coordinates and can be used since each three-dimensional point is a uniform distance from one another.
Continue reading with a free account, or login.
Unlock this tutorial and hundreds of other free visual analytics resources from our expert team.
Already have an account? Sign In
By continuing, you agree to our Terms of Use and Privacy Policy.
Converting the coordinates
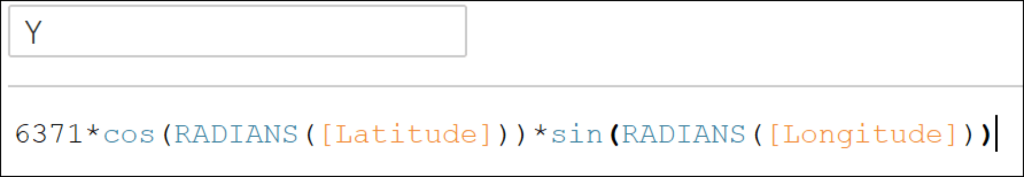
To get your (x,y,z) coordinates, use the following formulas:
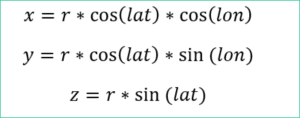
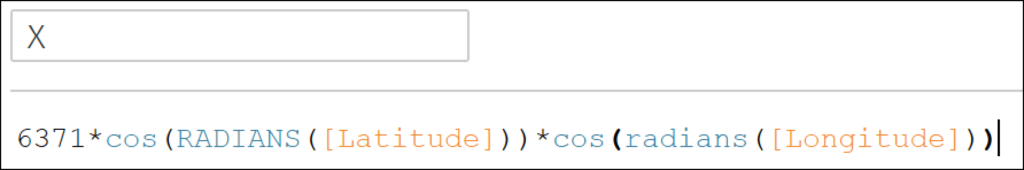
The r is your radius, so in this instance, r would be the radius of the Earth which is 6,371 km. Also, note that to convert into Cartesian coordinates, your latitude and longitude need to be in radians. The data set I am using has its coordinates in degrees, so I will need to add the step of converting from degrees to radians in Tableau. In Tableau, the formulas will be the following:
6371*cos(RADIANS([Latitude]))*cos(radians([Longitude]))
6371*cos(RADIANS([Latitude]))*sin(RADIANS([Longitude]))
6371*sin(radians([Latitude]))
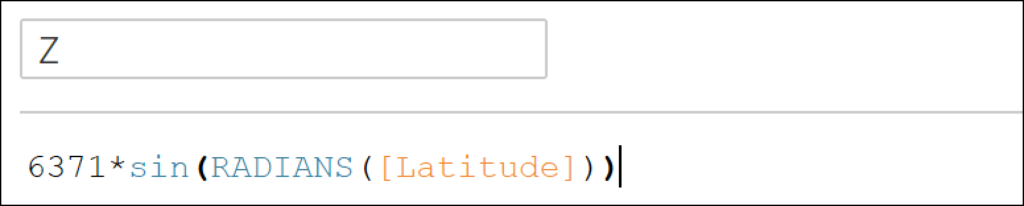
If your coordinates are already in radians, leave out the RADIANS function.
Getting the weighted average for the advanced Tableau map
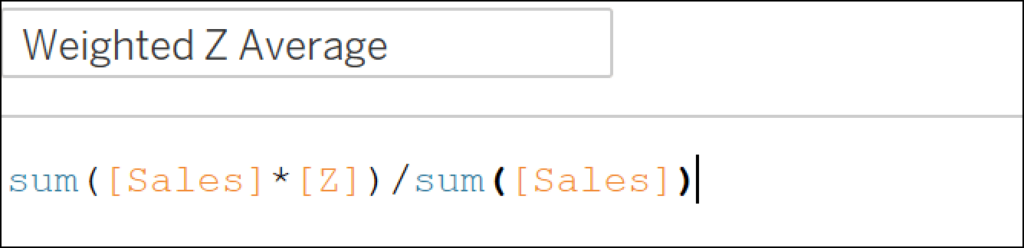
Now we are going to calculate our average (x,y,z) coordinates. I am going to weight my average by sales to get a weighted center of gravity. The formula for a weighted average is as follows:
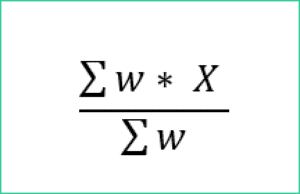
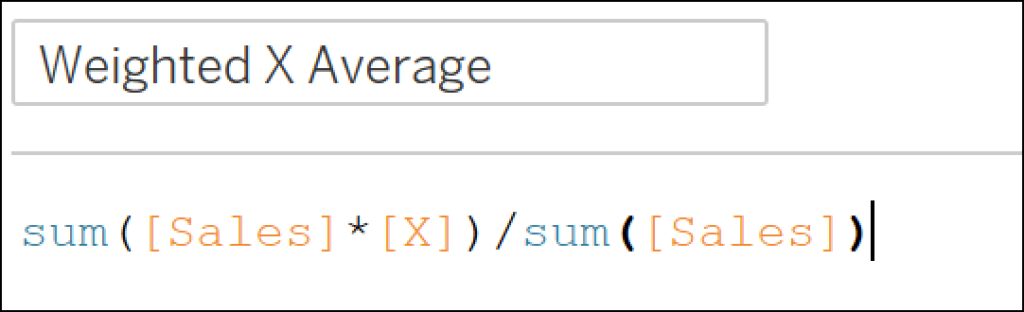
Where w is the weight and X is the value being averaged. In Tableau the formulas will be:
sum([Sales]*[X])/sum([Sales])
sum([Sales]*[Y])/sum([Sales])
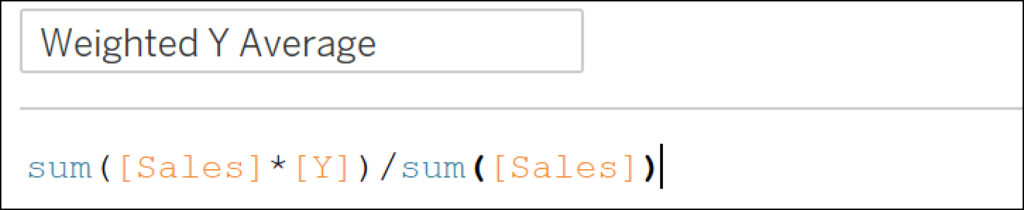
sum([Sales]*[Z])/sum([Sales])
Converting back to geographic coordinates
With our weighted averages, we will need to convert back from Cartesian coordinates to latitude and longitude so that we are able to get the coordinates on the map. The formulas to convert back are:
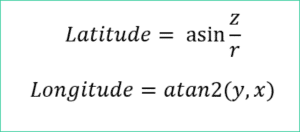
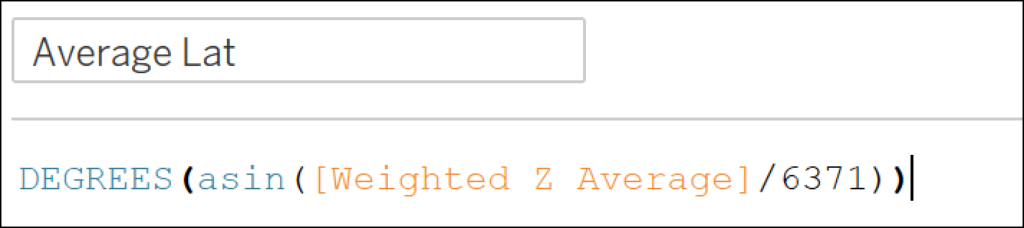
In Tableau the formulas are:
DEGREES(asin([Weighted Z Average]/6371))
DEGREES(ATAN2([Weighted Y Average],[Weighted X Average]))
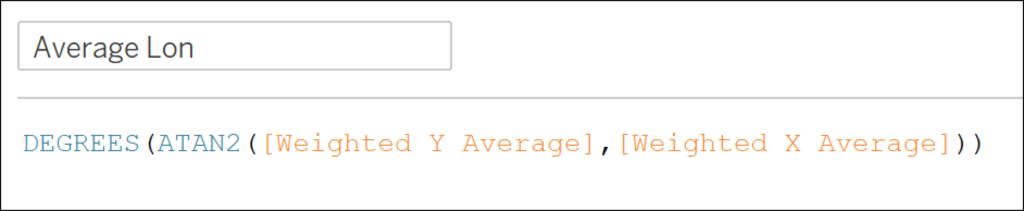
Since the results are in radians, I am wrapping the equations in the DEGREES function to convert back into degrees.
The results of this advanced Tableau mapping technique
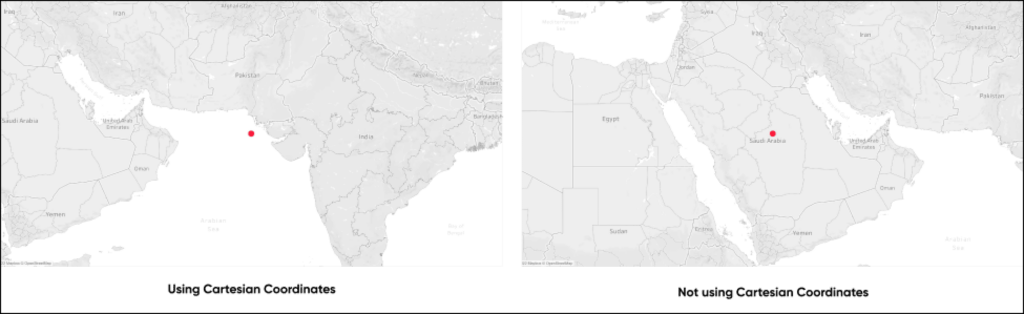
Now we have our weighted average latitude and longitude. In this data set, we get a latitude of 23.2° and a longitude of 66.97° which falls a little off the coast of India and Pakistan.
![]()
If we had just used the average of the values of latitude and longitude, we would have gotten a latitude of 24.99° and longitude of 44.84°, which falls in the middle of Saudi Arabia. Simply averaging the longitude results in a far different result and in this case, placing the center of gravity in a far different location.
To further demonstrate the difference between the results of these two calculations, I am using Tableau’s DISTANCE function to calculate the kilometers between the points we calculated using Cartesian coordinates and the points averaged in Tableau.
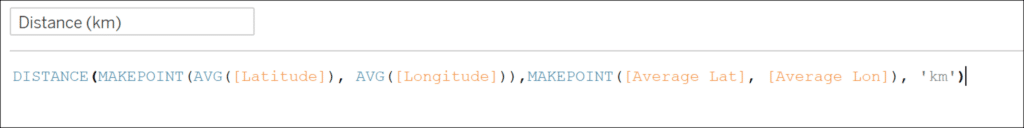
The distance between the two points is 2,256 kilometers, which is not an inconsequential distance!
There are other, more involved ways to calculate an average latitude and longitude with even more accuracy. If you are trying to do something like launching a satellite into orbit, this method may not get you where you need to go. However, it should be suitable for most of your business applications.
Stay after it,
Maddie


Written By
Maddie Dierkes

Peer Review
Alyssa Huff
Assoc. Director, Information Design

Graphic Design
Dan Bunker
Manager, Decision Engineering
Related Content
How to Isolate Linear Regression Equations in Tableau
Tableau has a decent variety of built-in statistical features. One of the easiest to use is the trend line. The…
Advanced Analytics in Tableau Series: One-Way ANOVA Tests
You may be wondering why we would want to perform an ANOVA test in Tableau, as you can do it…
How to Do Customer Segmentation with Dynamic Clustering in Tableau
Tableau has a few different built-in analytics features that allow you to both summarize and model your data in various…