Beginner’s Guide to DAX in Power BI: Creating a Date Table

In the same way that you can’t bake a cake without flour, you can’t use Power BI Desktop without Data Analysis Expressions, also known as “DAX”. Well, you can, but you will be limited to default levels of analysis, and you won’t be able to dig any deeper into your data. The wide world of DAX in Power BI enables you to create custom measures, columns, and tables according to your needs. Without it, Power BI Desktop wouldn’t be nearly as powerful as it is. Using the financials sample dataset, we’re going to explore some of the many things you can do with DAX in Power BI. In this blog, we’re going to create a dimension date table.
Once you open up a new report in Power BI Desktop, check if auto date/time is toggled off. This can be found in settings.
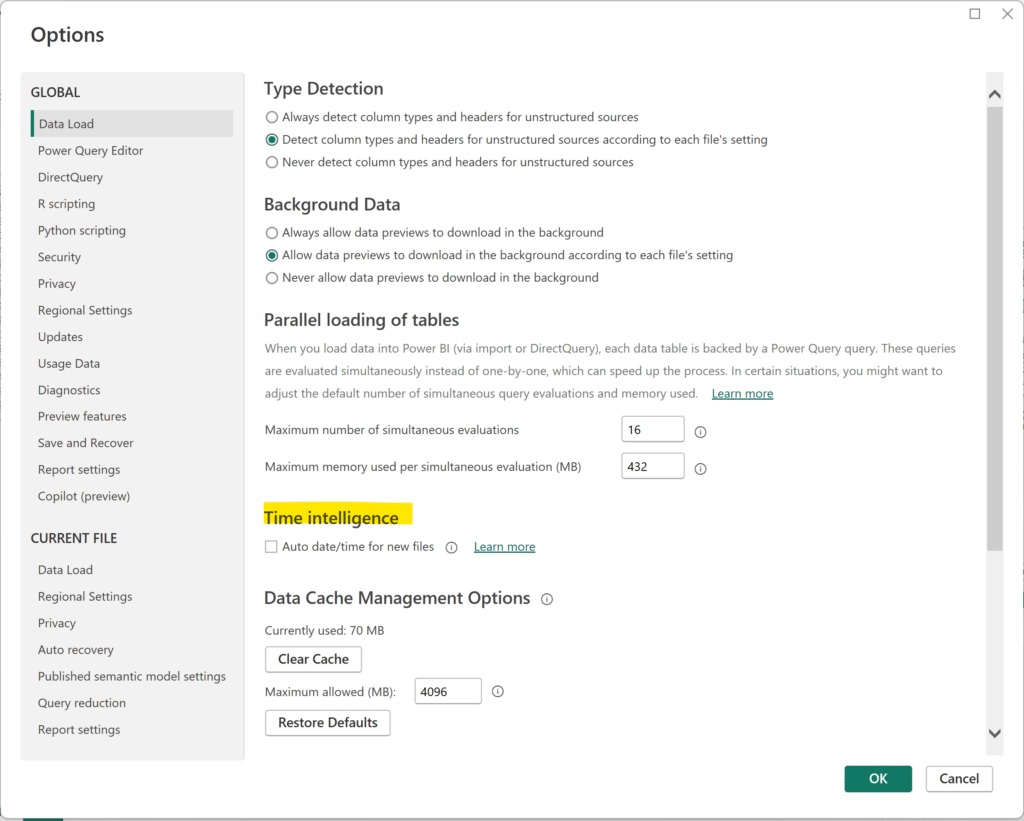
To simulate what can happen in real-world datasets with this example, we don’t want Power BI Desktop to auto detect date fields. Once auto date/time is toggled off, click on the ‘Use sample data’ tile.

In the popup window that appears, hit ‘Load sample data’ to load the Financials dataset. In the navigator popup window, click on the table named “Financials” and click ‘Load’. It’s typically best practice to transform data first, but we’ll go ahead and just hit ‘Load’ for this exercise.
Creating a dimension date table with DAX in Power BI
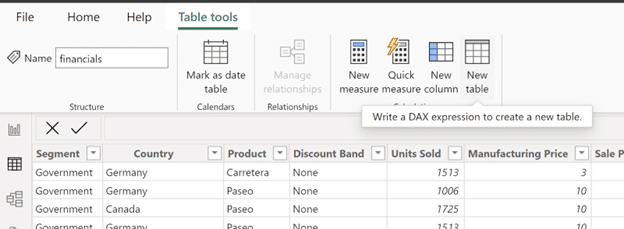
Now that we’ve loaded our data, notice that we only have one date field, named Date. Technically, we also have a month name, month number, and a Year field, but we’ll focus on the Date field for now. With only one date field, our analysis is pretty limited, so we’re going to create a new dimension date table. To start, click ‘New Table’ from within the Table view.
Continue reading with a free account, or login.
Unlock this tutorial and hundreds of other free visual analytics resources from our expert team.
Already have an account? Sign In
By continuing, you agree to our Terms of Use and Privacy Policy.
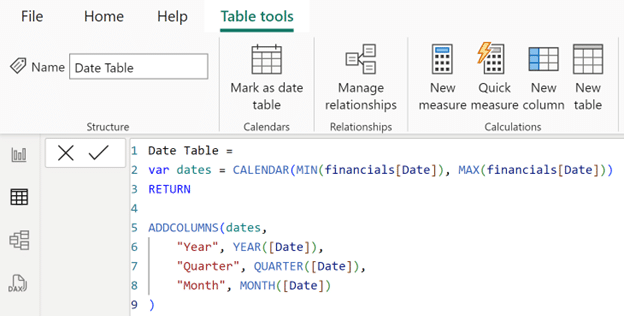
This is the DAX code for our table. Below, I’ll explain what each section does.
Date Table =
var dates = CALENDAR(MIN(financials[Date]), MAX(financials[Date]))
RETURN
ADDCOLUMNS(dates,
“Year”, YEAR([Date]),
“Quarter”, QUARTER([Date]),
“Month”, MONTH([Date])
)
It’s the VAR function that enables us to create a custom variable. To return to using DAX, after you’ve created your variable, you type RETURN. Now we’re free to use our variable as many times as needed, which translates to helping us write cleaner and more efficient code. If you have to make a change to the variable, you only need to change it once, in the VAR statement, instead of every time you use it throughout the rest of your DAX measure or calculated column.
In our VAR expression, we use CALENDAR() ,MIN(), and MAX() to create a calendar based on the first and last dates of our date column in the Financials table.
Now let’s get into creating a new table in DAX. We use ADDCOLUMNS() to add the columns to our calendar we created in our VAR expression. The columns we want to add are Year, Quarter, and Month. The argument order for ADDCOLUMNS() is ADDCOLUMNS(Table, Name, Expression). So, following our name for each column and the table we want to put these columns into is our formula for each column.
These are pretty straightforward as YEAR(), QUARTER(), and MONTH() return the specified date part of the Date field, so they output the year, quarter, and month portions of the Date field, respectively. Now that we’ve finished adding the columns we want, hit the Enter key or the checkmark to confirm the new table.
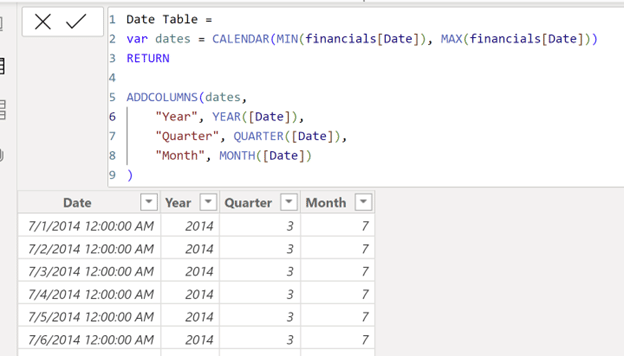
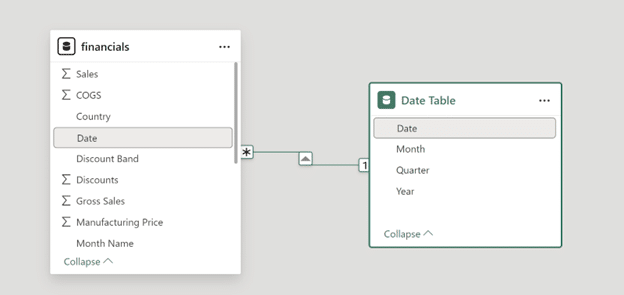
As you can see, our new date table has been populated! To use this separate table, we need to create a relationship with the main Financials table. In the model view, drag the Date field from the Date table to the Date field in the financials table to create a relationship.
Bringing Tables Together: Tableau Relationships
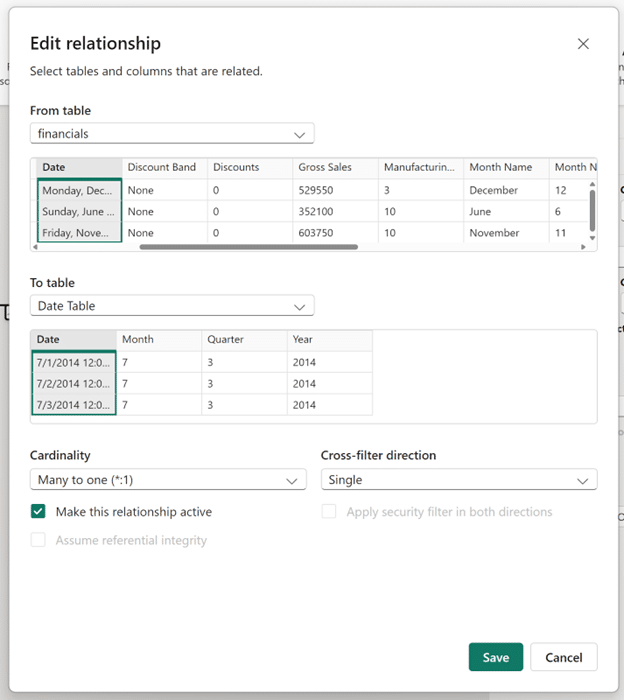
This dialog helps us visualize the relationship we are creating between the two tables. Note that a one-to-many/many-to-one relationship is the most common type of relationship you can create in Power BI. In this type of relationship, the ‘one side’ is a table that has one instance of a value in the selected column, and the ‘many sides’ can have multiple instances of the same value in the selected column. Now we can analyze our financials table using our newly created month, quarter, and year columns in the date table. To further customize your analysis, continue to add date parts to your date table!
Thanks for reading,
Juan Carlos Guzman

Written By
Juan Carlos Guzman

Peer Review
Matt Snively
Sr. Manager, Analytics Engineering
Related Content
An Introduction to the Power BI Power Query Editor
With the Power BI Power Query Editor, the data engineering world is at your fingertips. You can shape data to…
Matt Snively
Create a custom date table in Power BI Desktop In this video, you will learn how to create a custom…
Beginner’s Guide to DAX: Creating Calculated Columns and Measures in Power BI
When building a report from scratch in Power BI Desktop, one of the most common questions you can ask yourself…