How to Change Sort Order with Buttons in Tableau
Sorting marks within bar charts in ascending or descending order is good practice because it allows you to compare not only the preattentive attribute of height (or length), but also rank. By default, Tableau allows a user to sort bar charts in ascending, descending, or data source order, but the functionality has several limitations including: (1) its appearance is very subtle and often goes overlooked, (2) there are no formatting options, and (3) the sort does not work across multiple sheets.
The following technique overcomes all three of these limitations. This post shows you how to change the sort order of multiple sheets at the same time with the click of a button!
Watch the related video with Playfair+
Set up the foundation of the UX for sort order in Tableau
By the end of this post, you will be able to toggle the sort between descending and ascending across multiple charts by clicking on an up or down triangle, respectively.
Step 1
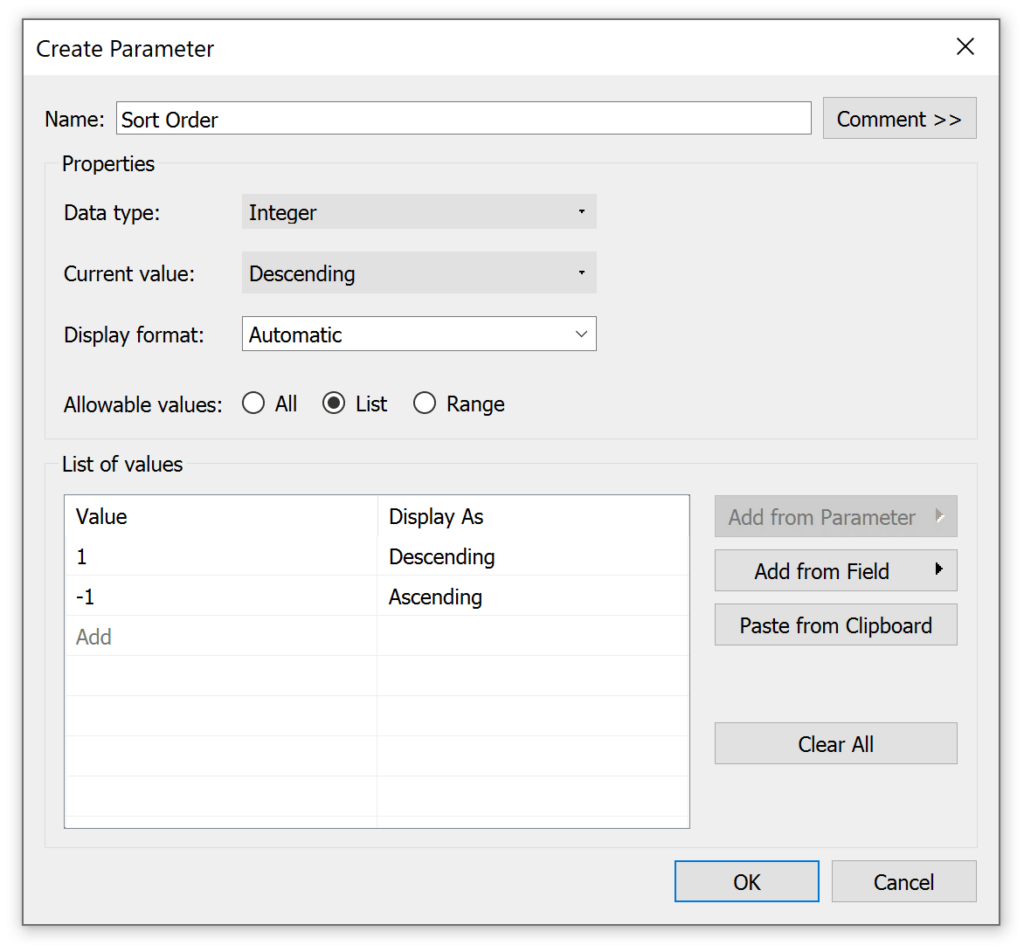
Create a parameter with a data type of Integer and two values; one for descending and one for ascending. The values need to be 1 and -1, but the Display As can be set to whatever you want.
Step 2
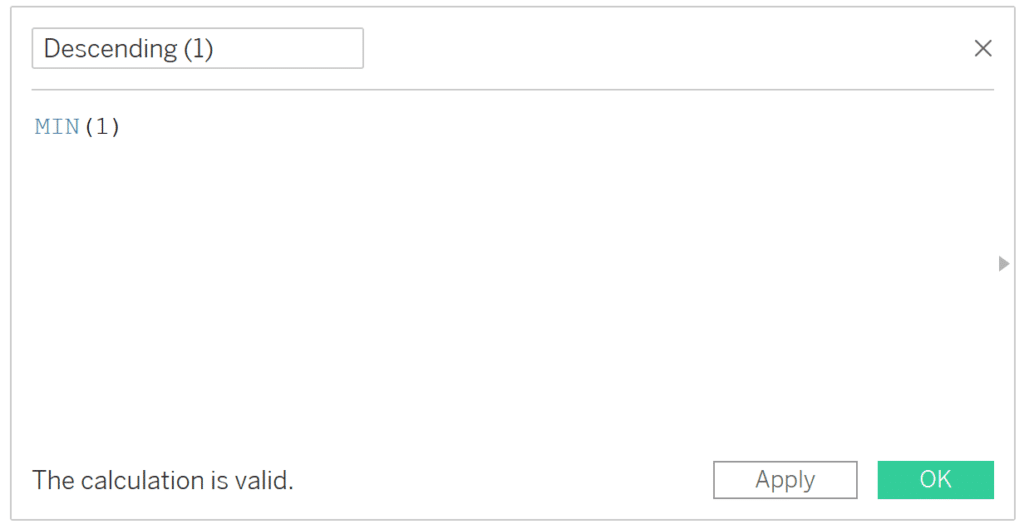
Create a calculated field that equals the value: 1. Whenever I am creating a calculated field containing one value, I like to add the aggregation of Minimum to ensure it’s never aggregated in a different way.
Step 3
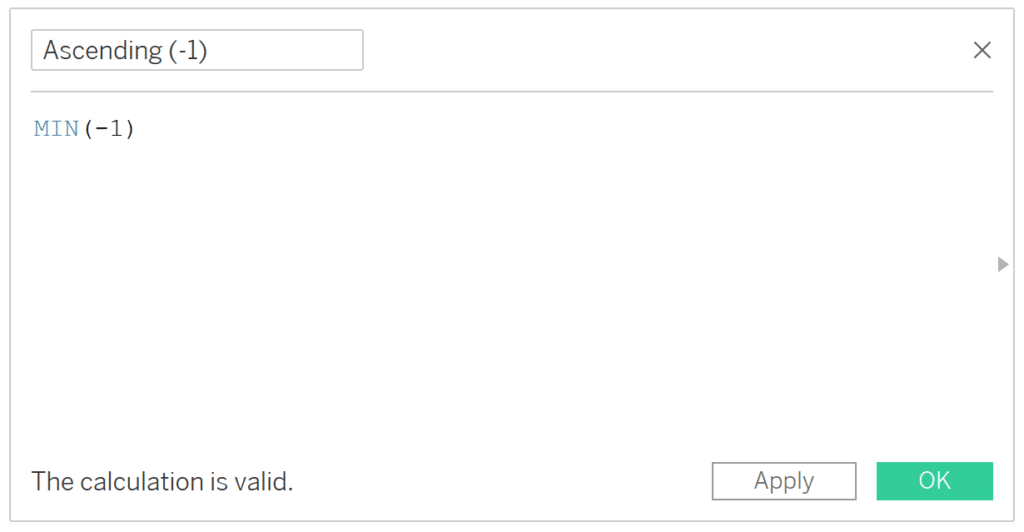
Create a calculated field that equals the value: -1.
Continue reading with a free account, or login.
Unlock this tutorial and hundreds of other free visual analytics resources from our expert team.
Already have an account? Sign In
By continuing, you agree to our Terms of Use and Privacy Policy.
Creating the control sheet
Step 4
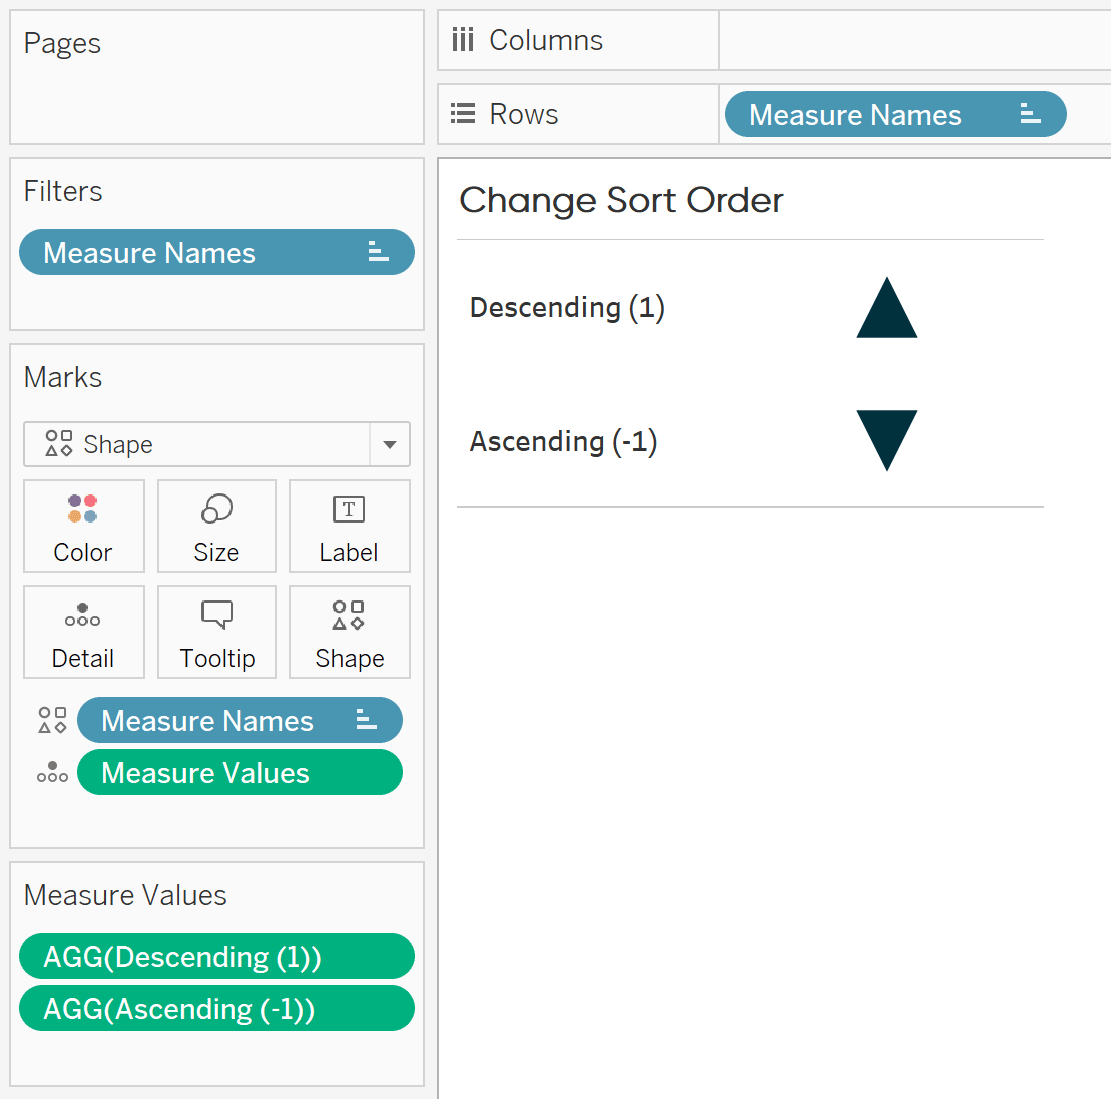
Create a control sheet that will be used to select the sort order. The easiest way to do this is to create a new worksheet, change the mark type to Shape, place the Measure Names dimension on the Rows Shelf and Shape Marks Card, the Measure Values measure on the Detail Marks Card, and filter out every measure name except for the descending and ascending calculations from steps two and three.
![]()
I’ve also clicked on the Shape marks card to map a solid up triangle for descending and a solid down triangle for ascending.
Step 5
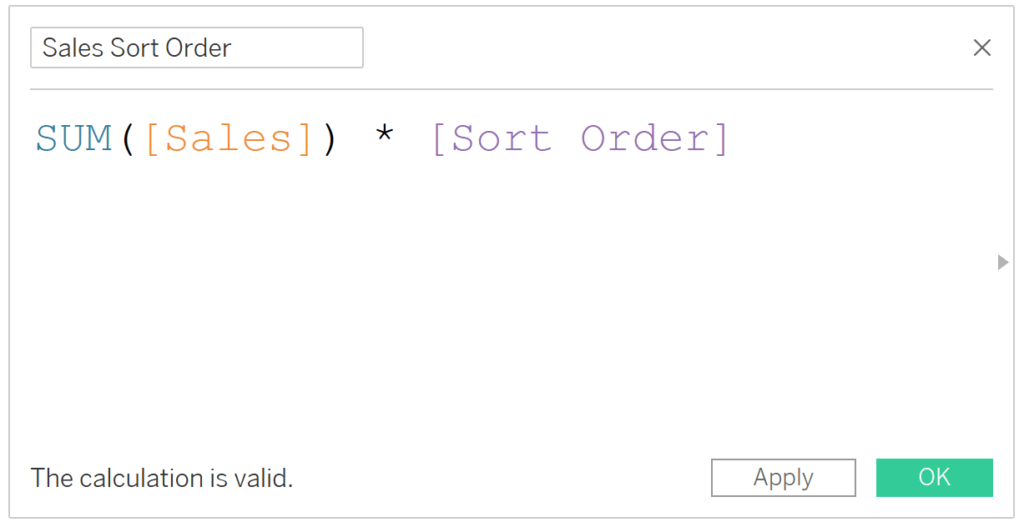
Create a calculated field that multiplies the measure you are sorting by times the value in the parameter from step one. When descending is selected, this results in the measure being multiplied by itself (so no change). When ascending is selected, this results in the measure becoming negative. For the Sales measure in the Sample – Superstore dataset, the formula would be:
Sorting each individual view
Step 6
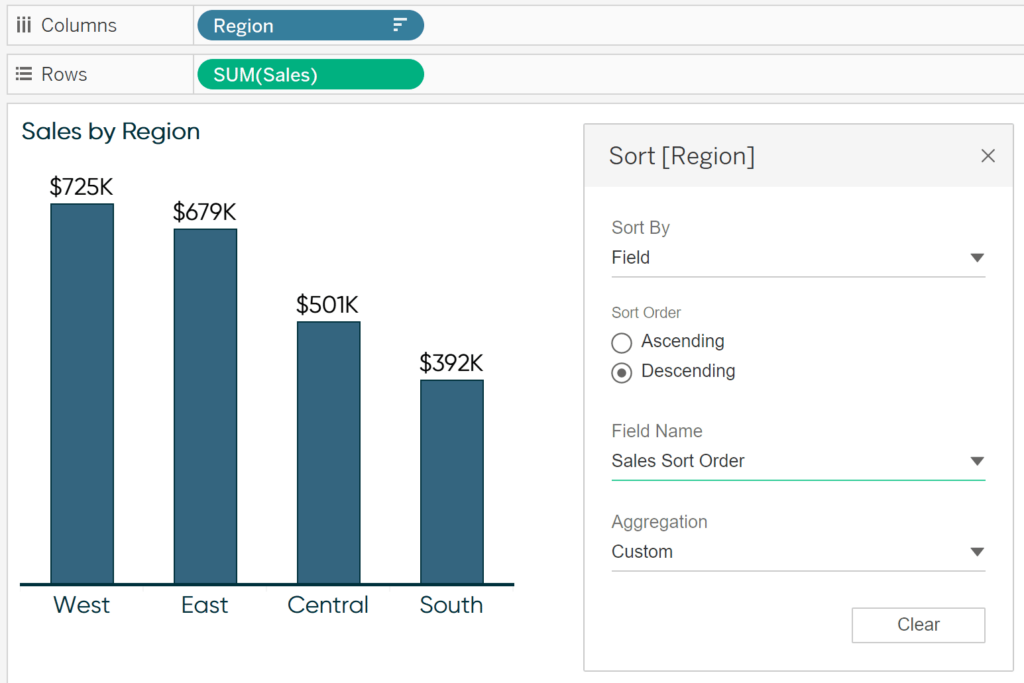
For each chart containing the measure you are sorting by, right-click on the dimension on the Columns Shelf or Rows Shelf (depending on whether your chart is in a horizontal or vertical orientation), click “Sort…” to open the sort options, and sort the dimension in descending order by the newly created calculated field from step five.
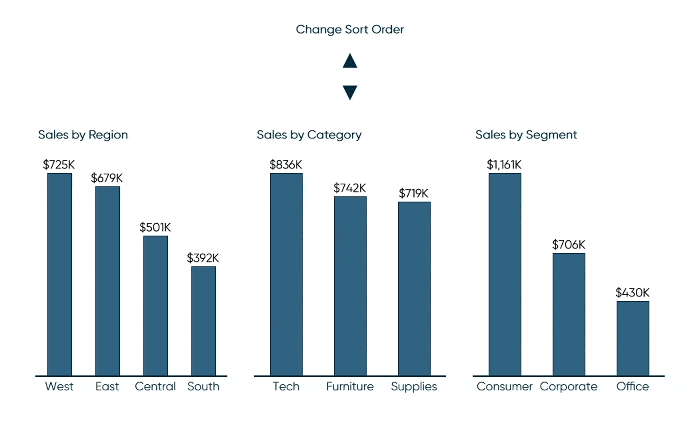
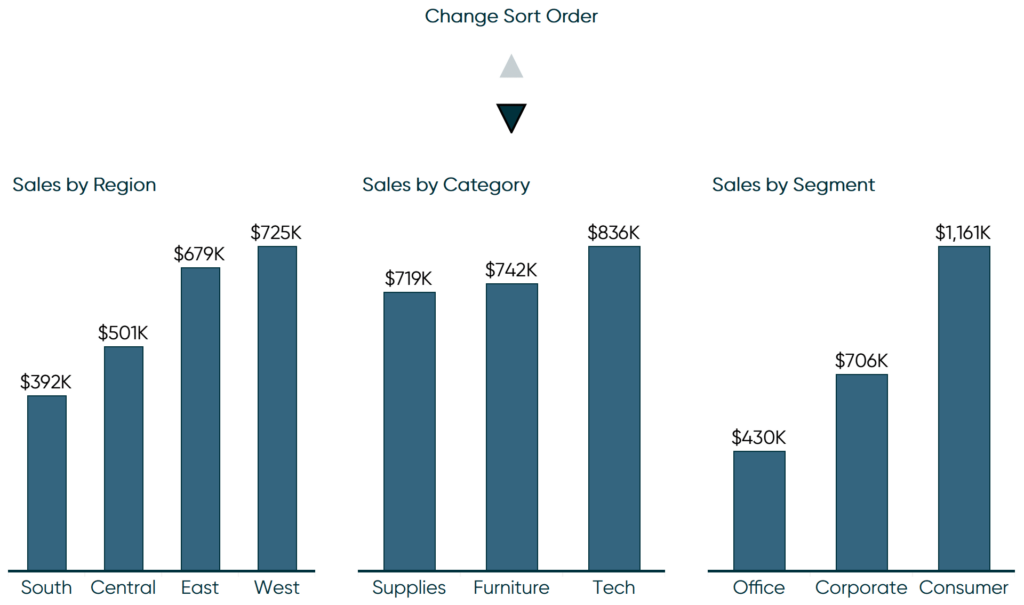
For this illustration, I’m going to change the sort order across three separate sheets at the same time. The first is looking at Sales by Region, so I am sorting on the Region dimension.
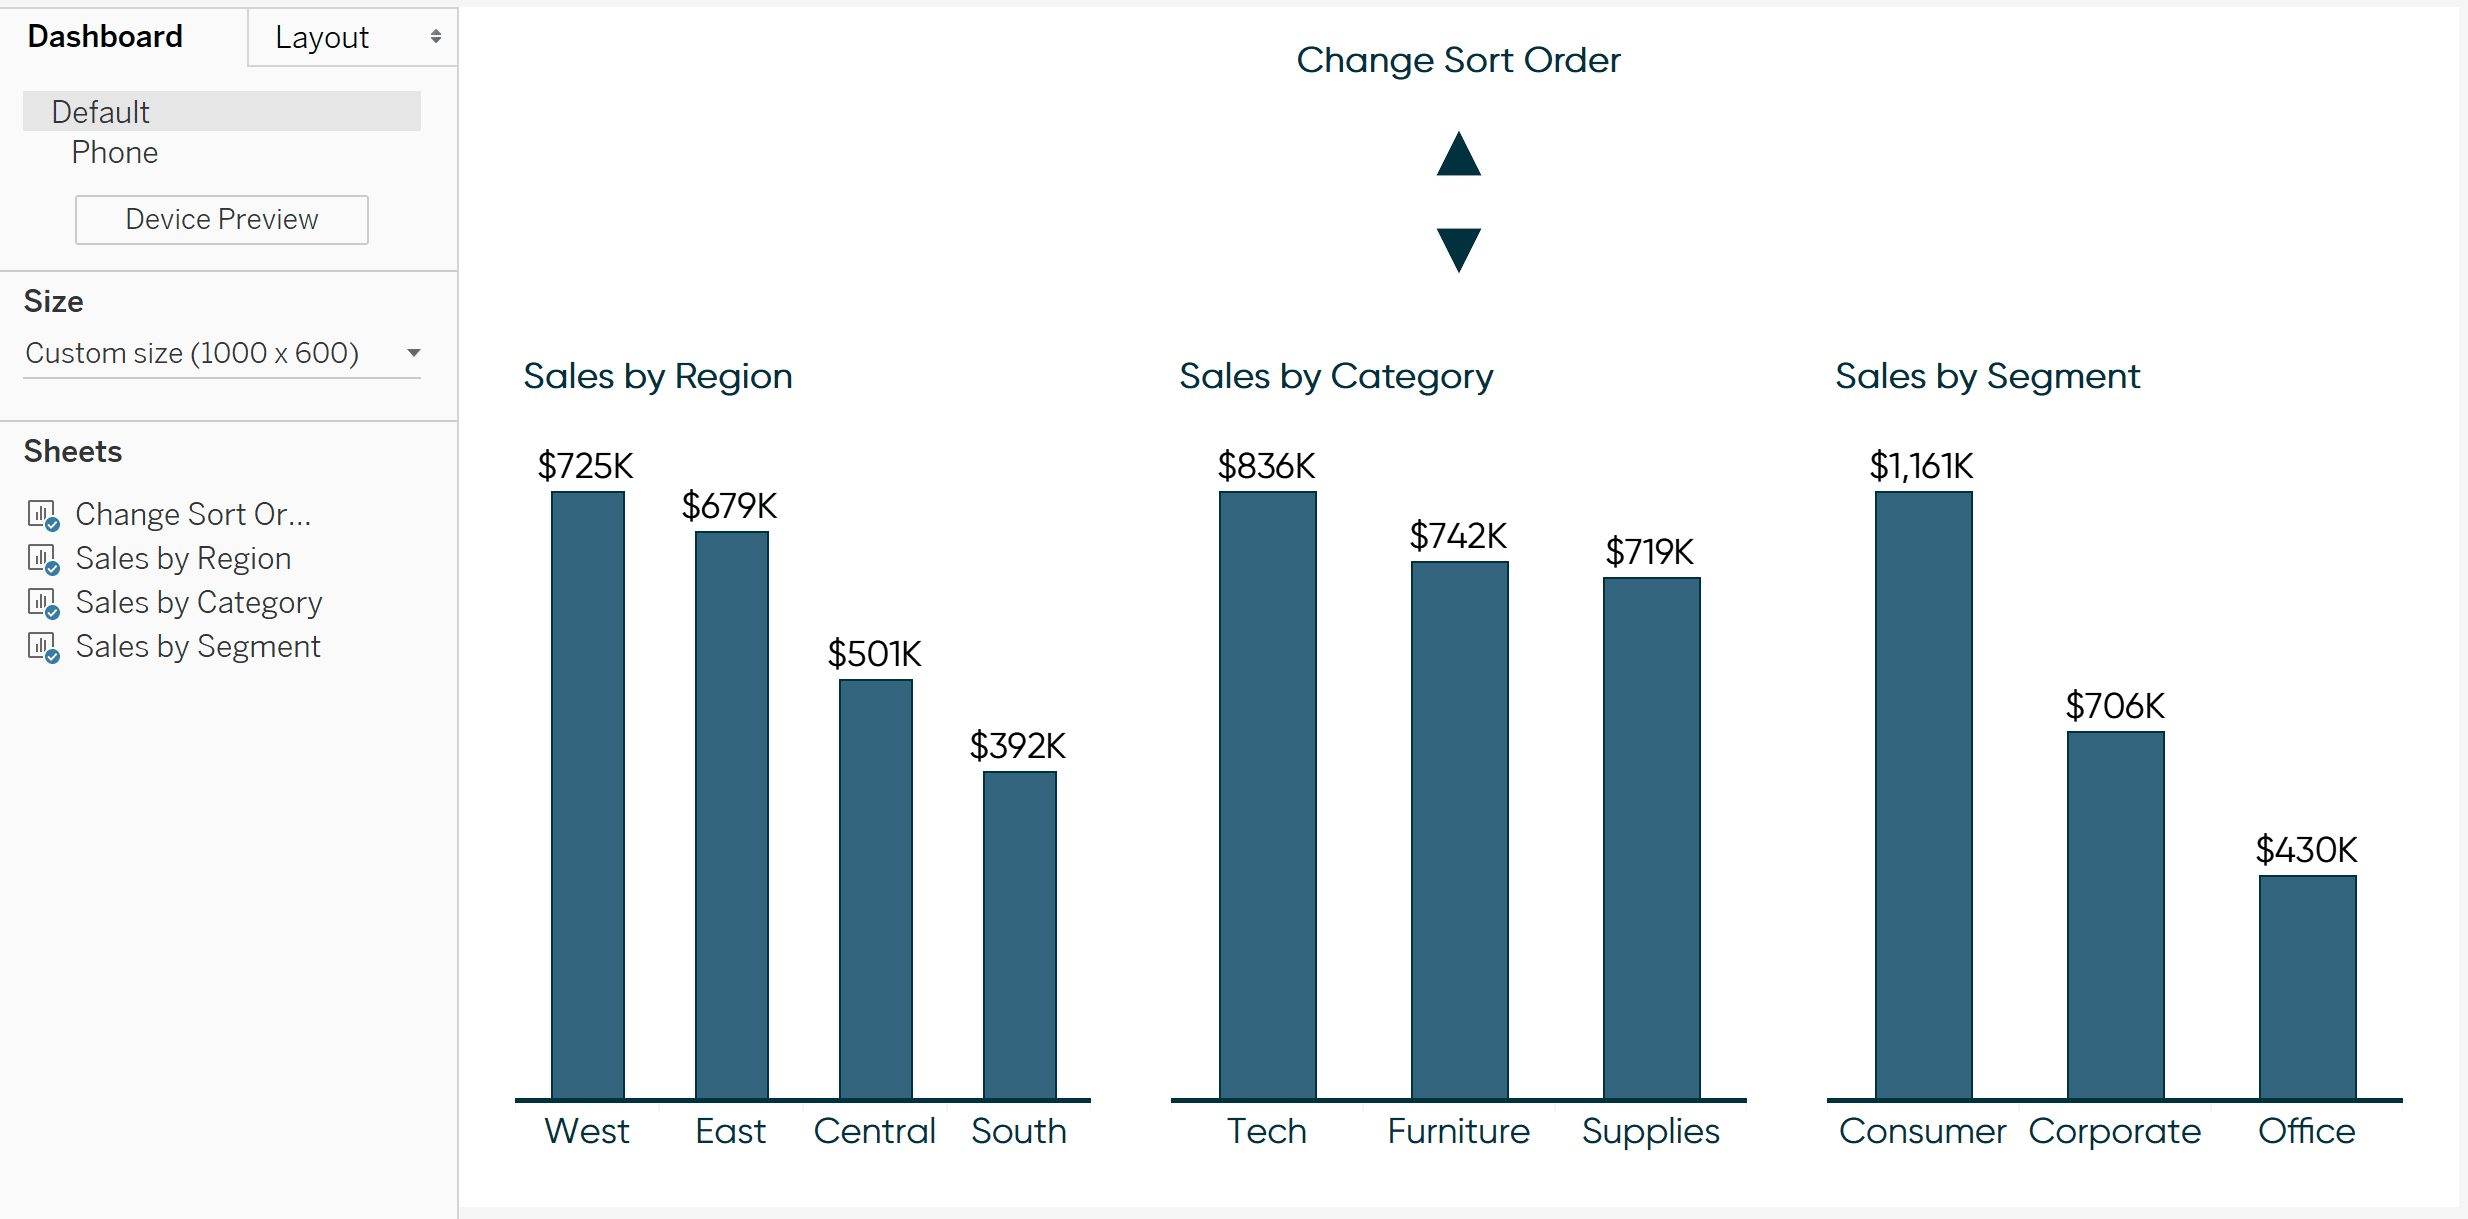
I’ve also applied this sort order to my Sales by Category and Sales by Segment worksheets.
Step 7
Add the control sheet and all the sheets you want to sort to a new dashboard. I also hid the header names of the control sheet (“Descending (1)” and “Ascending (-1)”) by right-clicking on the header and deselecting “Show Header”.
Bringing the sort order to life with dashboard actions
Step 8
Add a “Change Parameter…” dashboard action by clicking Dashboard, then “Actions…” in the top navigation. A dialog box will appear where you need to click the “Add Action” button and choose “Change Parameter…”. In my example, I’m setting this up so that if you click on the Change Sort Order sheet, the underlying value will overwrite the Sort Order parameter with the measure value that is clicked on.
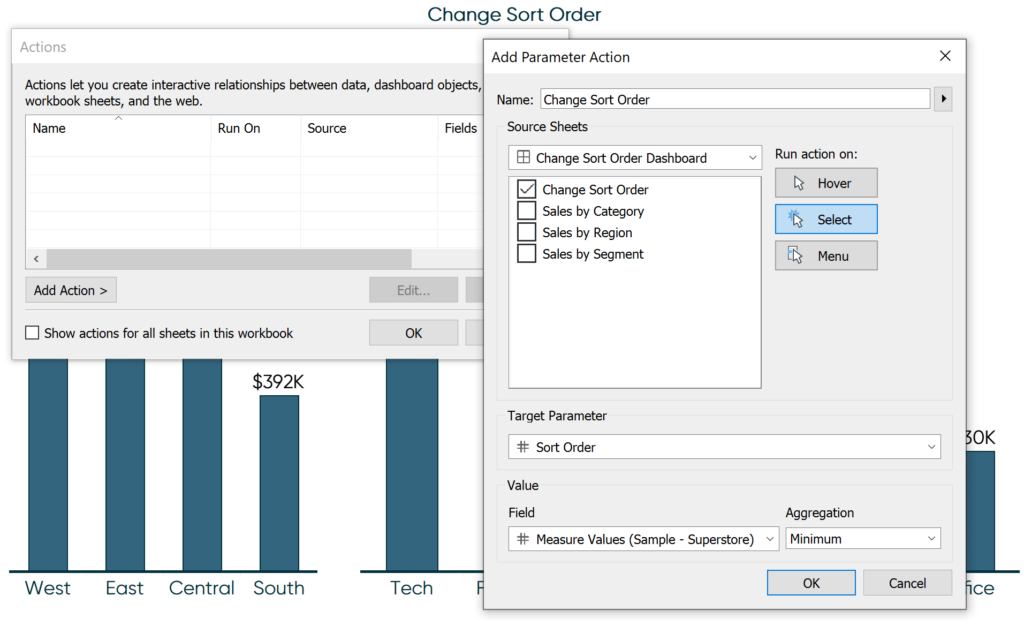
How to Use Tableau Parameter Dashboard Actions
Remember, those triangles are mapped to the values 1 and -1. So, clicking on the up triangle overwrites the value in the parameter with the value of 1. This value of 1 then feeds the calculated field that is multiplying this value by the measure to control the sort order. Since the values are already being sorted in descending order and are now being multiplied by 1, you wouldn’t see any change.
![]()
Clicking on the down triangle will overwrite the parameter value with -1. When Sales is multiplied by -1, it flips the best performer to the worst performer. Since the charts are still being sorted in descending order, the previously worst performers are moved to the front – we’ve created the illusion of an ascending sort!
The best part about this is parameters can be used across sheets and even data sources, so this technique will control the sort order across every sheet it is being applied to.
For ease of illustration, I sorted multiple sheets at the same time, but they all contained the same measure. This technique also works when using a variety of measures, but you have to create the calculated field from step five for each measure being used and sort each chart by its respective sort order calculated field (i.e. Sales is sorted by Sales Sort Order and Profit is sorted by Profit Sort Order). Every other step including the single parameter and single dashboard action are still shared.
Thanks for reading,
– Ryan


Written By
Ryan Sleeper
Related Content

Ryan Sleeper
How to sort in ascending, descending, alphabetical, manual order, and more Sorting is a best practice for charts built with…
How to Reorder Stacked Bars on the Fly in Tableau
I often mention during my training workshops that Tableau stacked bar charts are among my least favorite chart types because…
Ryan Sleeper
Make engaging explanatory dashboard elements with any images Learn how to create custom shape palettes in Tableau and how to…