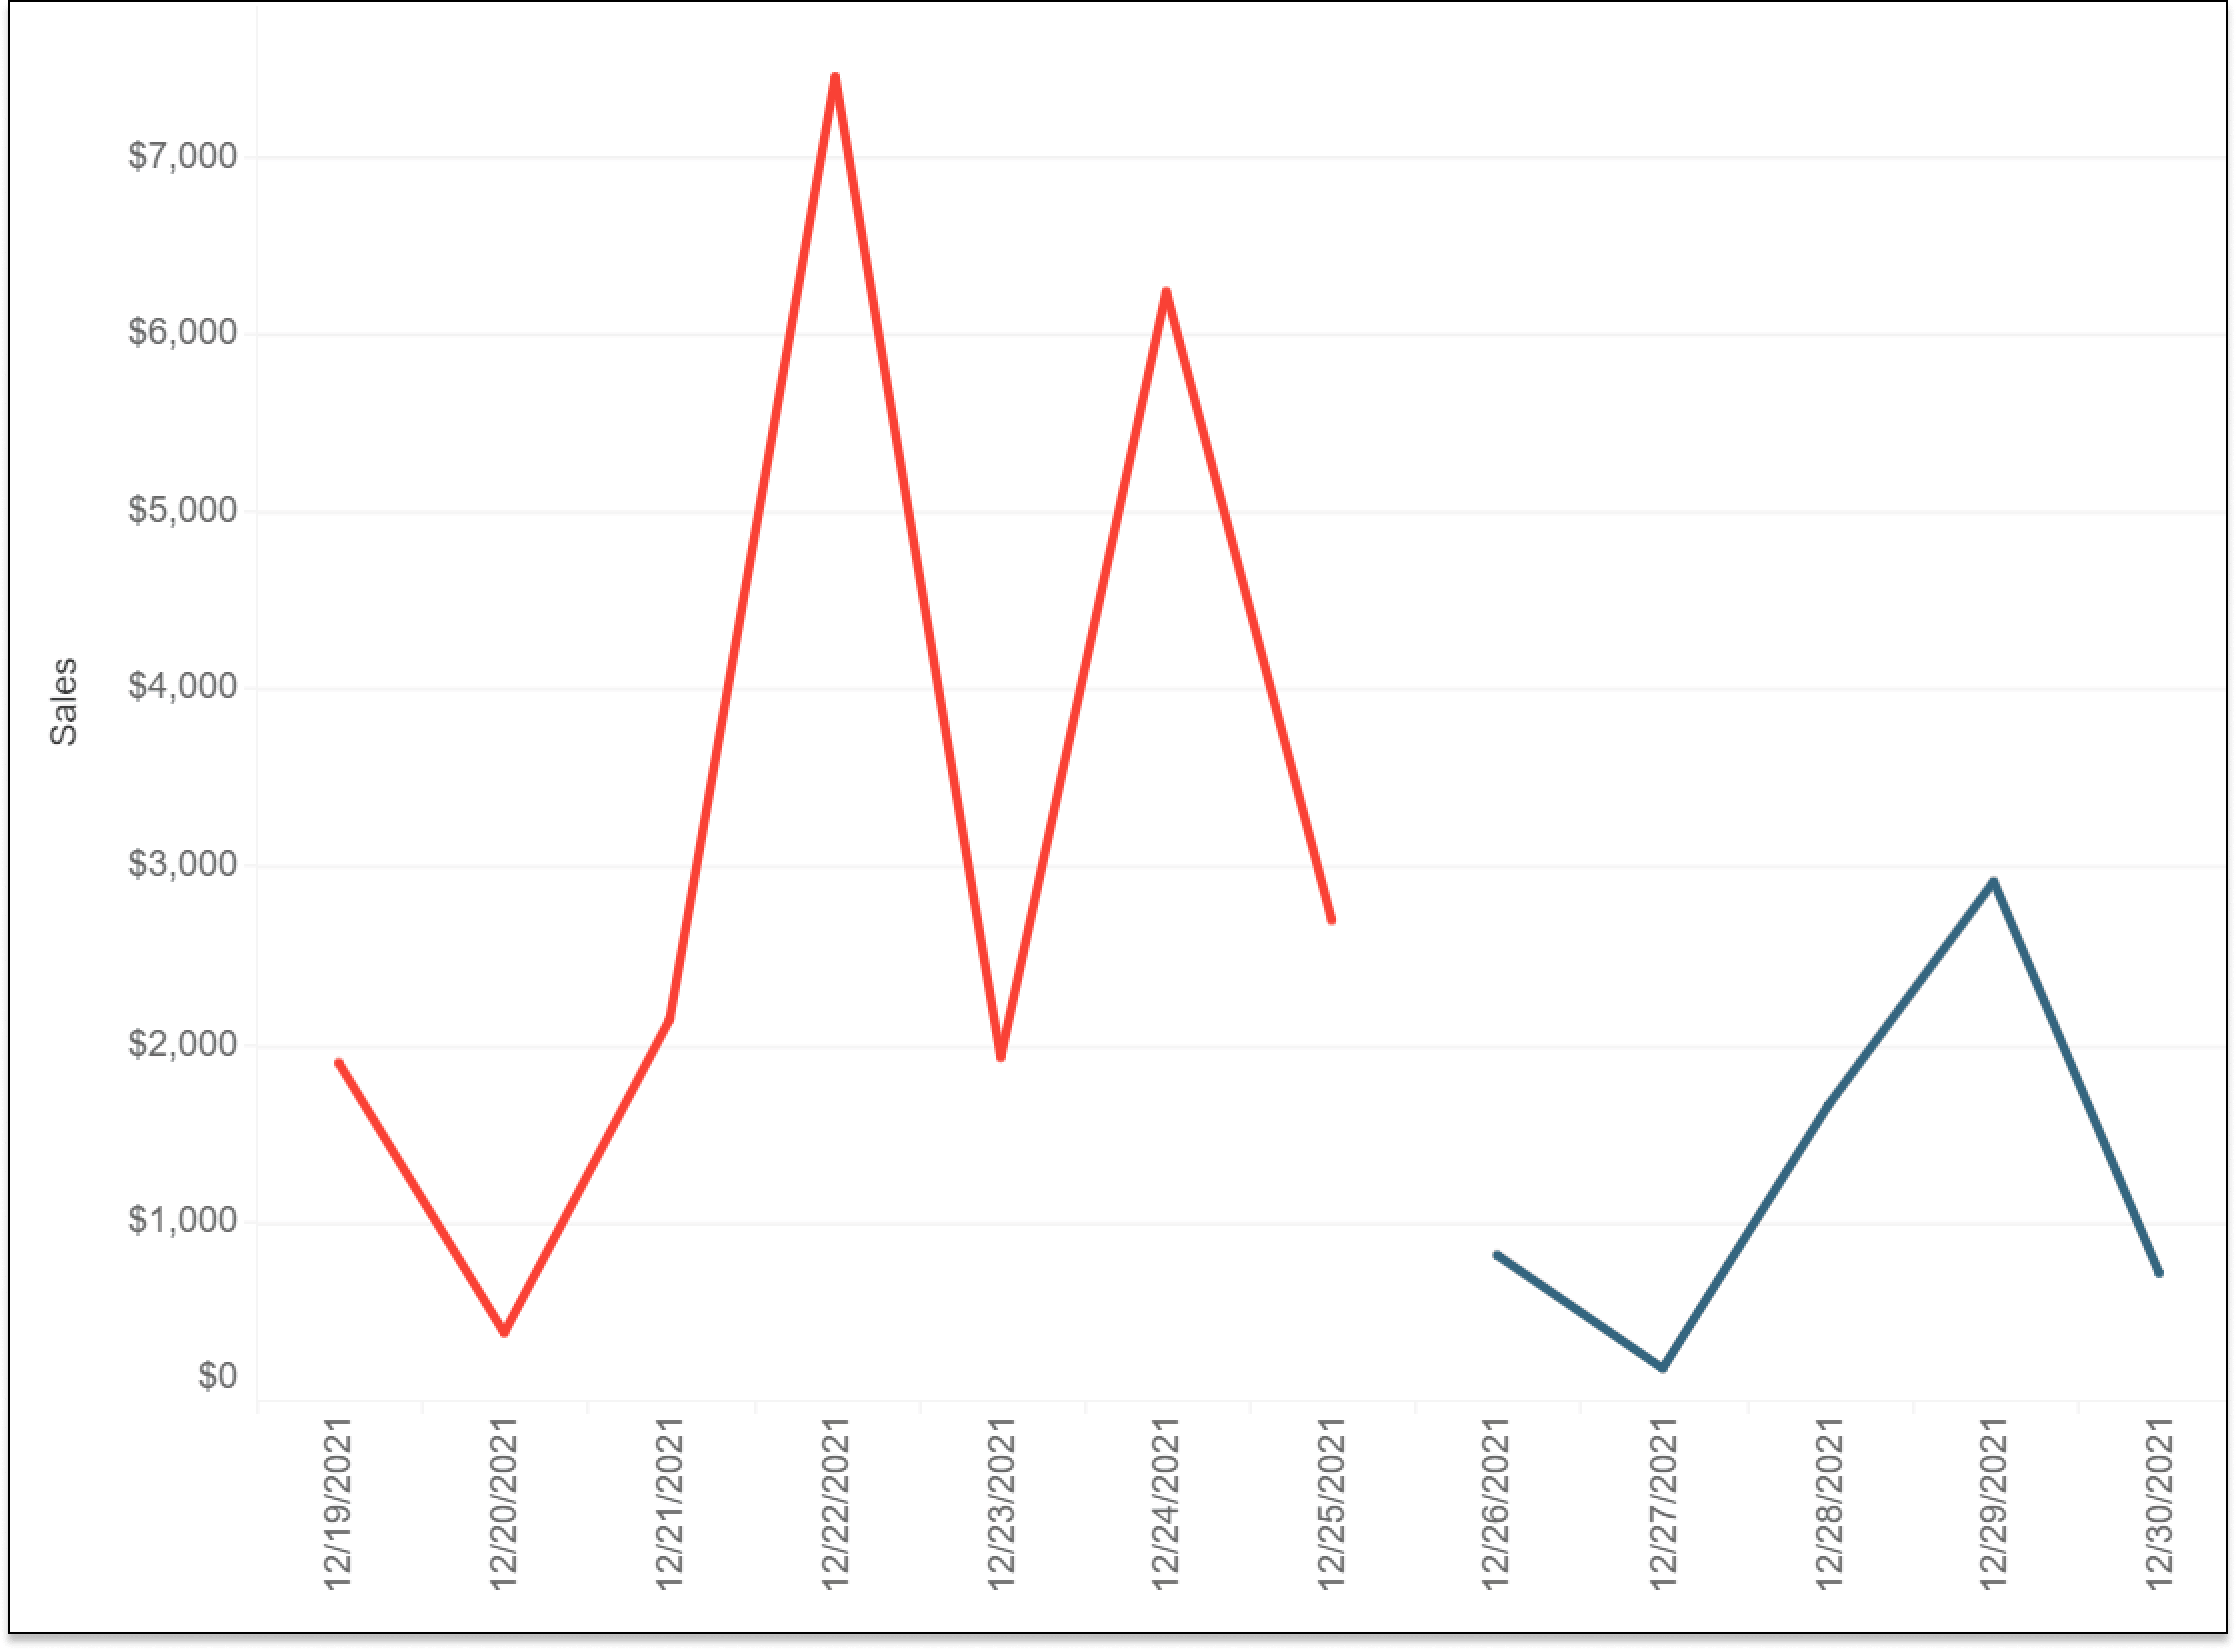
How to Compare the Last Two Full Days, Weeks, or Months in Tableau
This post aims to help you harness dates in Tableau to create powerful comparisons in your dashboards. You will learn how to isolate the last two full reporting periods – whether they be days, weeks, months, quarters, or years – so can compare the last complete date part to the date part preceding it (i.e. last full month compared to the month before in Tableau). The calculations shared in this post can be used as a foundation to: (1) create period-over-period percent or index changes, (2) filter your dashboards to only the most recent dates, and (3) normalize the dates so they overlap on the same axis.
While there is almost always more than one way to do the same thing in Tableau, I’ve attempted to provide an easy-to-execute solution that also processes efficiently. As such, this approach allows you to compare the last two complete date parts without the use of level of detail calculations or table calculations. I owe a big thank you to Playfair Data partner consultant, Rody Zakovich, as he collaborated with me on this post to make the calculations even more elegant than my original idea.
This content is excerpted from my book, Innovative Tableau: 100 More Tips, Tutorials, and Strategies, published by O’Reilly Media Inc., 2020, ISBN: 978-1492075653. Get the book at Amazon.
Watch the related video with Playfair+
Compute the full current and full prior periods
This technique works regardless of what date part you are using (day, week, month, quarter, or year), assuming your data source is updated at least daily. The foundational calculated field that you need computes whether the date range is within the last full period or two full periods ago. This formula can be written with CASE WHEN or IF THEN logic, but the CASE WHEN code is slightly more concise. To illustrate, I will use the date part ‘week’ in the Sample – Superstore dataset.
Create a free account, or login.
Unlock this tutorial and hundreds of other free visual analytics resources from our expert team.
Already have an account? Sign In
Note: I’m writing this on 1/27/2019, and the Sample – Superstore dataset only goes through the year 2018. For this reason, I have adjusted the Order Date field by creating a calculated field to add a year to it ([Order Date] = [Order Date] + 365).
The formula is:
CASE [Order Date] < DATETRUNC(‘week’, TODAY())
WHEN [Order Date] >= DATEADD(‘week’, -1, DATETRUNC(‘week’, TODAY())) THEN “Full Current”
WHEN [Order Date] >= DATEADD(‘week’, -2, DATETRUNC(‘week’, TODAY())) THEN “Full Prior”
END

The first line in this logic limits the date range to dates that are less than today’s date, truncated at the week date part, which eliminates partial weeks. If today is 1/27/2019 and my week starts on Monday, all dates would need to be less than 1/21/2019.
Note: By default, weeks in Tableau start on Sunday. To change the day your weeks start, click Data in the top navigation, hover over the name of the data source, and choose “Date Properties…”.
The next line in the calculation says the date must be greater than or equal to the start of the last full week. The third line says the date must be greater than the start of the second last full week from today. You may notice there is some overlap in dates between the second and third line in this statement (i.e. today is both greater than one full week ago and two full weeks ago), but each date can only be classified once. This means that once a date is classified as “Full Current”, it cannot be reclassified as “Full Prior”.
Using IF THEN instead of CASE WHEN
If you prefer to think in terms of IF / THEN logic, the formula would be:
IF [Order Date] < DATETRUNC(‘week’, TODAY()) THEN
(IF [Order Date] >= DATEADD(‘week’, -1, DATETRUNC(‘week’, TODAY())) THEN “Full Current”
ELSEIF [Order Date] >= DATEADD(‘week’, -2, DATETRUNC(‘week’, TODAY())) THEN “Full Prior” END)
END
Whether I’m using the CASE WHEN or IF THEN version, if today’s date is 1/27/2019, the last full week should start on 1/14/2019, and two full weeks ago should start on 1/7/2019. Let’s see if it works. I’ll make a Sales by Day line graph filtered to this year and put the newly created “Full Current / Full Prior” calculation on the Color Marks Card.
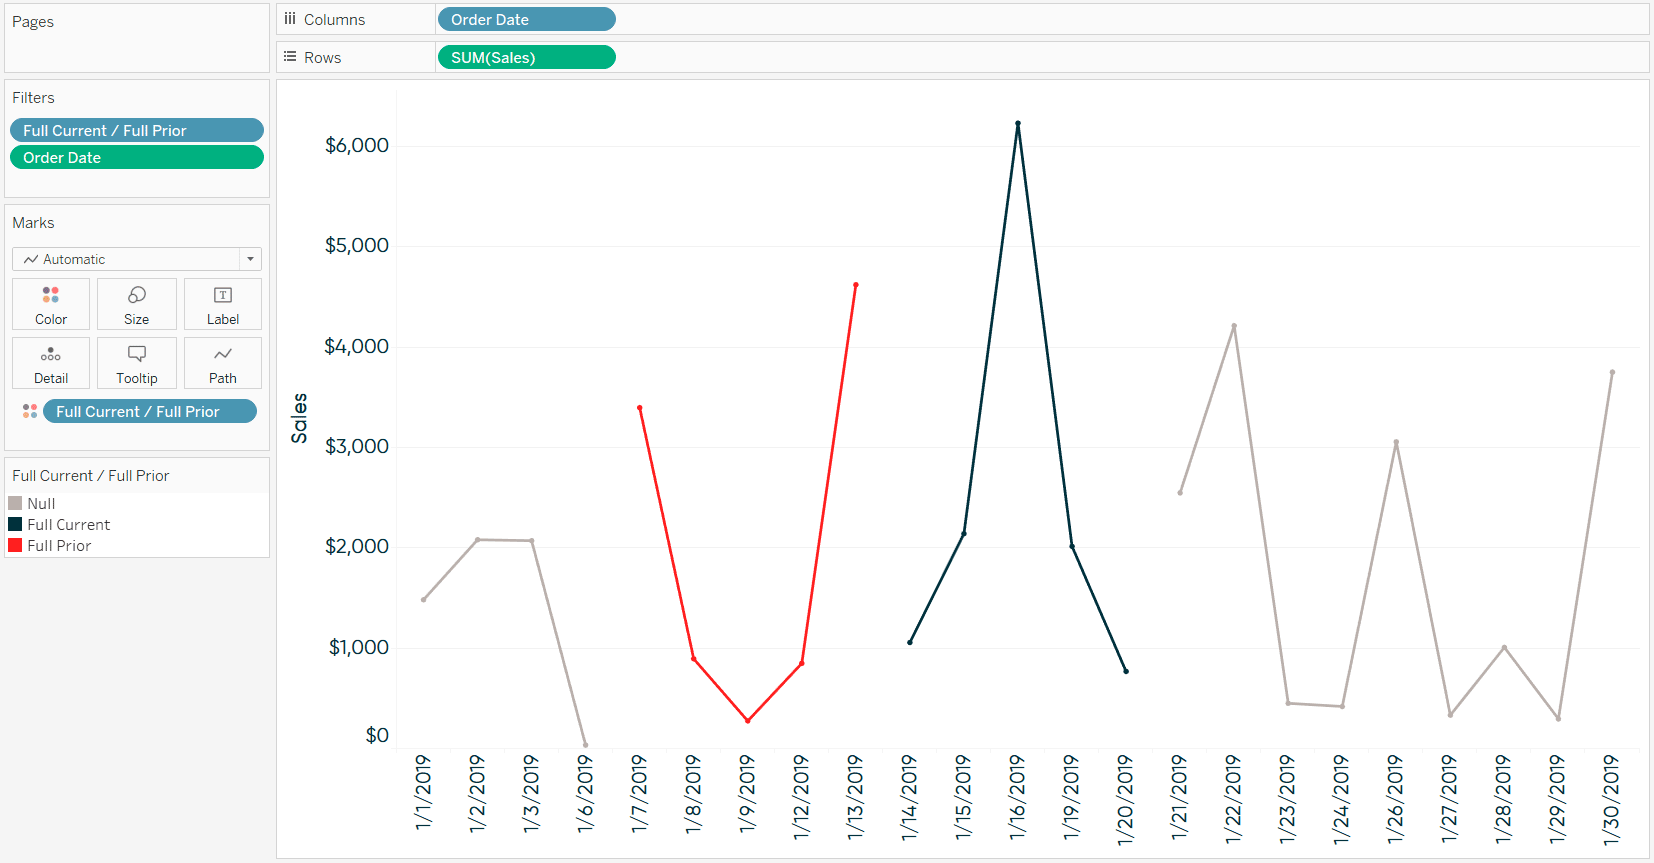
As you can see, the last full week is colored blue and starts on 1/14/2019; the second full week ago is colored red and starts on 1/7/2019; everything else is classified as null and is colored gray. We have just isolated the last two complete reporting periods! This calculation works if you replace the ‘week’ date part with ‘day’, ‘month’, ‘quarter’, or ‘year’.
Other ideas for comparing the last two full months in Tableau
There are several tactics we can implement from this point including filtering the view to only the last two complete periods, creating period over period percent change calculations, normalizing the comparison ranges so they overlap on the same axis, and parameterizing the date part to change between days / weeks / months / quarters / years on the fly.
1. Using the Full Current / Full Prior dimension as a filter.
In the last screenshot, you can see that the dates that are not classified as Full Current or Full Prior are called Null and colored gray. To remove these dates completely from the view to focus on the relevant dates only, simply add the newly created calculated dimension to the Filters Shelf and deselect Null.
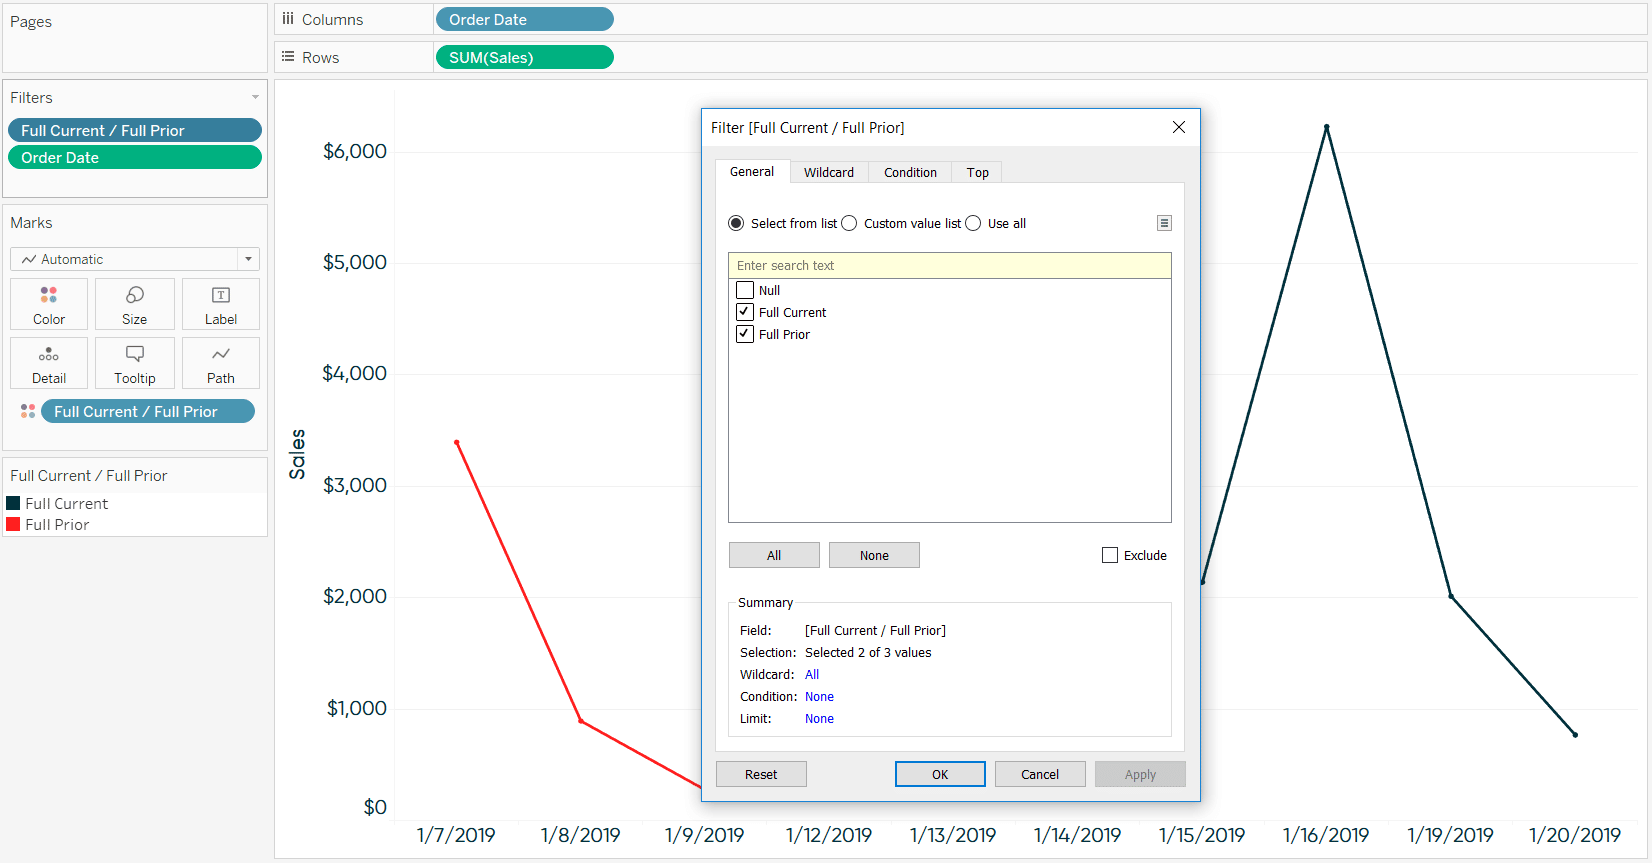
By the way, if you would prefer your null dates have a better name, you can add an ELSE statement at the bottom of your CASE WHEN or IF THEN calculated field. For example, I may call my null dates “Not in Range” by adding one more line to my calculated field:
CASE [Order Date] < DATETRUNC(‘week’, TODAY())
WHEN [Order Date] >= DATEADD(‘week’, -1, DATETRUNC(‘week’, TODAY())) THEN “Full Current”
WHEN [Order Date] >= DATEADD(‘week’, -2, DATETRUNC(‘week’, TODAY())) THEN “Full Prior”
ELSE “Not in Range”
END
You can similarly limit the dates on the view by using a relative date filter in Tableau, but the difference is that the version I’m sharing filters out partial weeks.
2. Compute percent or index changes between the last two full periods.
Isolated numbers do not provide much value and it is almost always better to provide context in the form of a comparison. I’m such a big believer in this that my first go-to dashboard element is the current versus comparison index callout. It is very easy to create this powerful component now that we have the foundational Full Current / Full Prior calculated field. Let’s say that we want to compare the Sales measure from the current full week to the prior full week. We would need to isolate Sales from “Full Current” week and “Full Prior” week; then compute the percent change or index score.
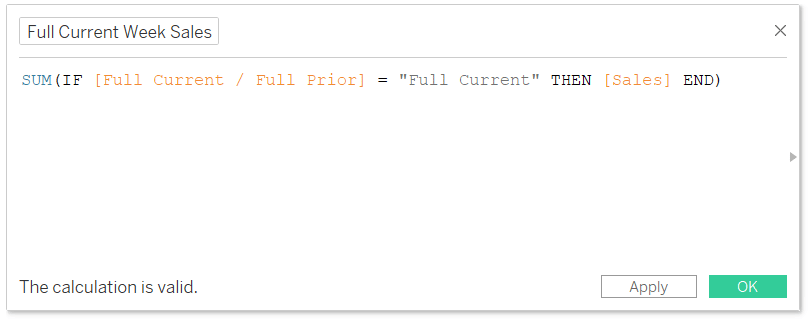
The formula for Full Current Week Sales is:
SUM(IF [Full Current / Full Prior] = “Full Current” THEN [Sales] END)
The formula for Full Prior Week Sales is:
SUM(IF [Full Current / Full Prior] = “Full Prior” THEN [Sales] END)
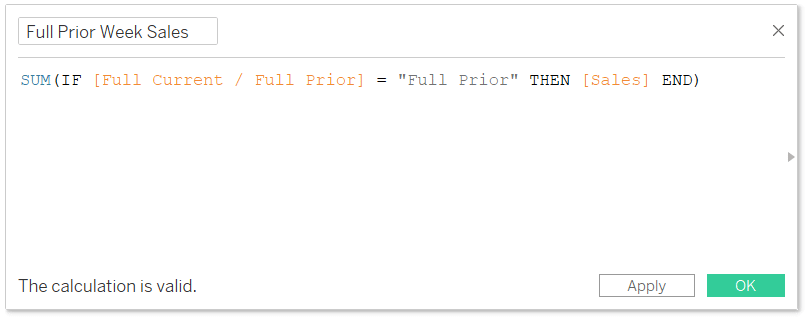
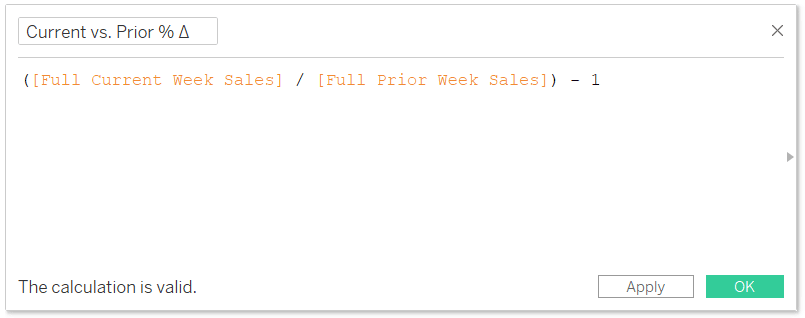
The formula to compute the percent change between the last two full weeks is:
([Full Current Week Sales] / [Full Prior Week Sales]) – 1
Here’s how the ‘current versus comparison callout’ could look after creating these three calculated fields:
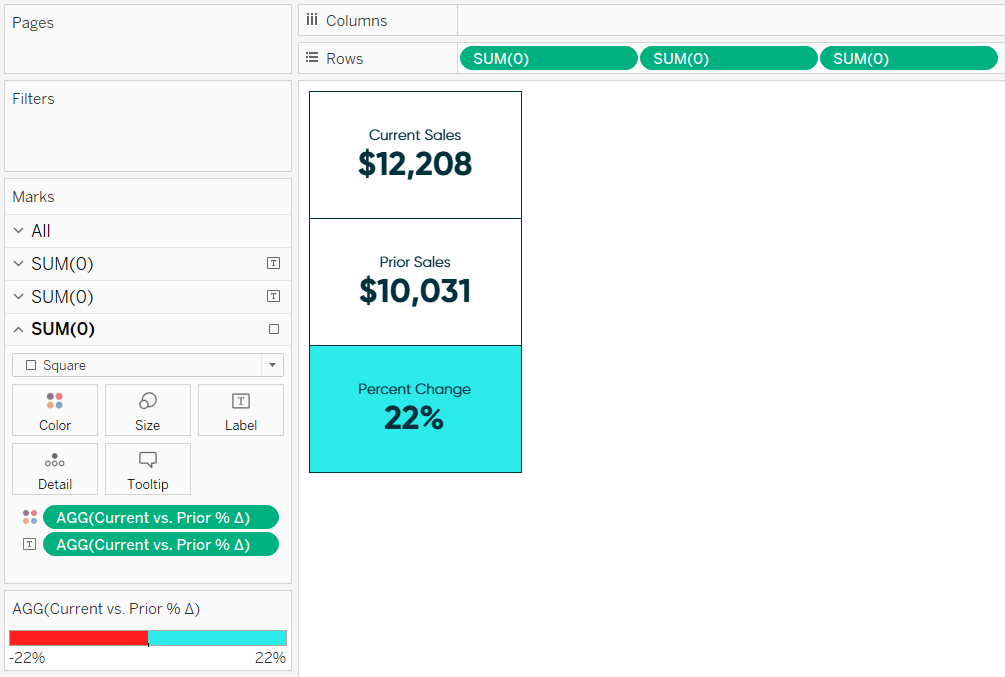
Tableau Dashboard Element – The Current Versus Comparison Callout
3. Equalize the comparisons ranges so they line up on the same axis.
If comparing the last full week to the full week two weeks ago on a line graph, it would be easier to compare day over day (i.e. Tuesday vs. Tuesday) if the two lines overlapped on the same axis. To accomplish this, instead of using the default date field in your dataset on the Columns Shelf, replace it with a “Date Equalizer” calculated field that moves the dates from the comparison period forward on the x-axis. If my date part is week, the formula would be:
IF [Full Current / Full Prior] = “Full Prior” THEN [Order Date] + 7
ELSE [Order Date]
END
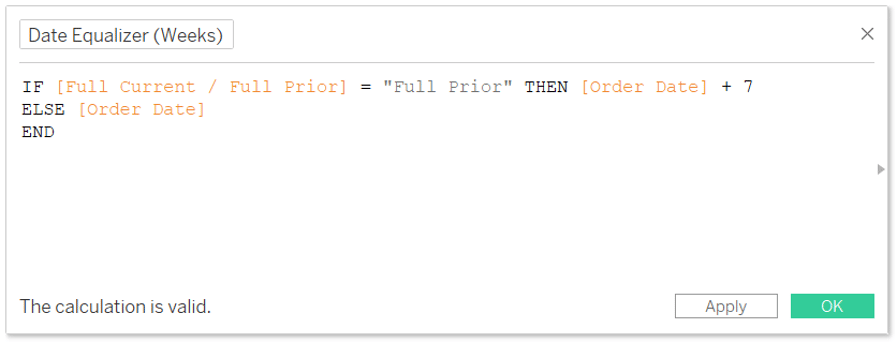
This formula looks to see if the date has been classified as “Full Prior”, and if so, adds seven days; otherwise it shows the default date. When using a date part of week, the Monday from two full weeks ago (1/7/2019) would be moved up 7 days so it lines up with the Monday one full week ago (1/14/2019). Here’s how my line graph looks when replacing [Order Date] with [Date Equalizer] on the Columns Shelf.
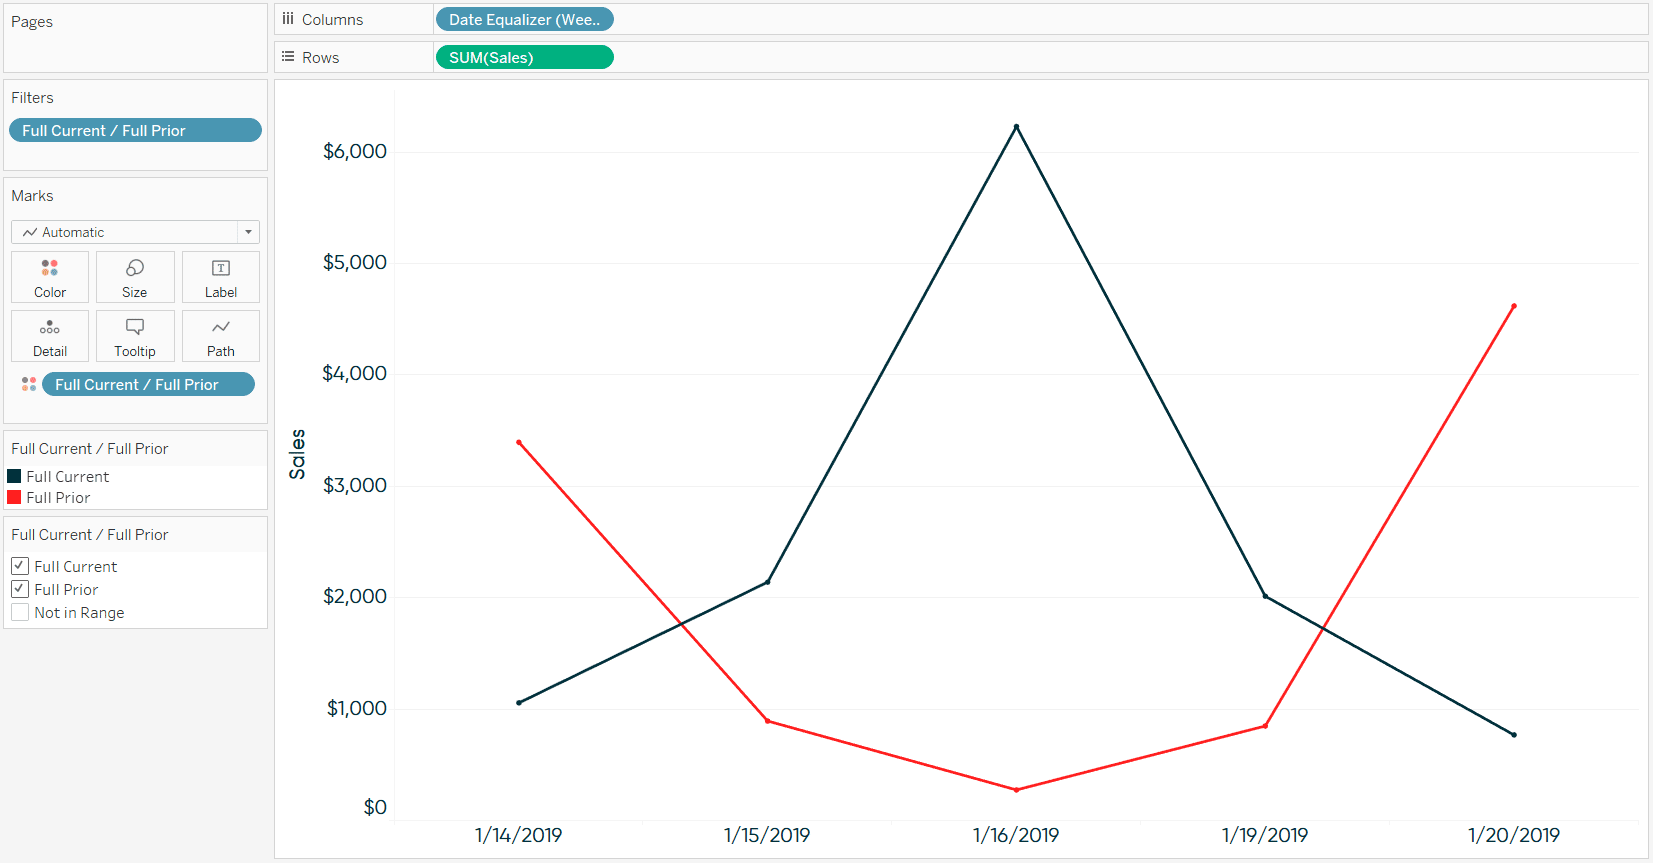
Note: The Sample – Superstore dataset currently does not have data for 1/10, 1/11, 1/17, or 1/18 in the most recent year; this results in just five days of data per week in this example.
This type of normalization is relatively straightforward when dealing with days, weeks, or years because the ranges contain an equal number of days. Months, quarters, and custom ranges on the other hand may have a different number of dates (i.e. February vs. January), so you must compute the number of days in the range before adding them to the comparison range to equalize the dates. For more on normalizing dates and the DATEDIFF function, see How to Normalize Current and Prior Dates on the Same Axis in Tableau.
4. Create a parameter to change the comparison date part on the fly.
In my examples thus far, I’ve used the ‘week’ date part to compare the last full week to the full week preceding it, but also mentioned the calculation works if you replace week with day, month, quarter, or year. Well, why not allow yourself and your end users to quickly pivot through the different date parts?
This is relatively easy to accomplish by setting up a parameter with a data type of String and a list of allowable values. Each allowable value should represent one of your date parts. The value itself needs to be lowercase, but the Display As value can be title cased or abbreviated.
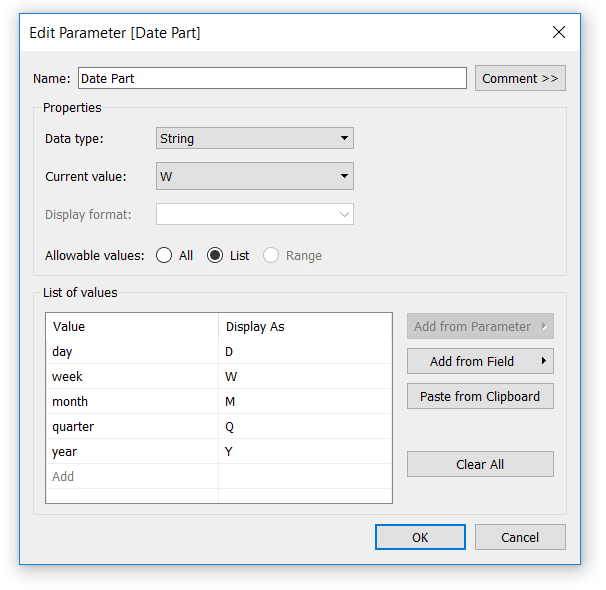
You would then replace every occurrence of the date part, ‘week’, in the Full Current / Full Prior calculated field with this newly created parameter, right-click on the parameter, and choose “Show Parameter Control”. After following these steps, you and your end users will have direct access to choosing the date part that is populating the comparison periods.
To take this idea to a Jedi level, see How to Use Tableau’s Parameter Actions Extension to Change Date Parts.
Thanks for reading,
– Ryan
If you would prefer to automatically compare partial date periods, see How to Compare the Last Two Partial Weeks, Months, Quarters, or Years in Tableau.
Related Content
How to Compare the Last Two Partial Weeks, Months, Quarters, or Years in Tableau
This post shows you how to automatically isolate the last two partial date ranges so you can compare an equal…
How to Normalize Current and Prior Dates on the Same Axis in Tableau
Dates can be tricky to work with in Tableau. It’s no wonder there are six different chapters in Practical Tableau…
Ryan Sleeper
Comparing Dates with Tableau’s DATETRUNC, DATEADD, and LOD Functions Get more from dates in Tableau by learning how to: (1)…
