How to Create Multiselect Parameters in Tableau


Binary Parameters are a new technique that allows you to store multiple Boolean selections in one parameter, essentially creating a multiselect parameter. The basis of this technique involves a string parameter containing a series of zeroes and ones, where each digit represents an individual Boolean value. Think of each position in the binary string as an option on a multiselect list, and the character at that position determines whether the box is checked or unchecked.
This method comes in handy when you need to create a list with a fixed number of options, or a multiselect parameter with a fixed order. It’s also helpful in scenarios which typically require a set, where the unselected values need to be considered along with the selected values.
Building blocks for multiselect parameters in Tableau
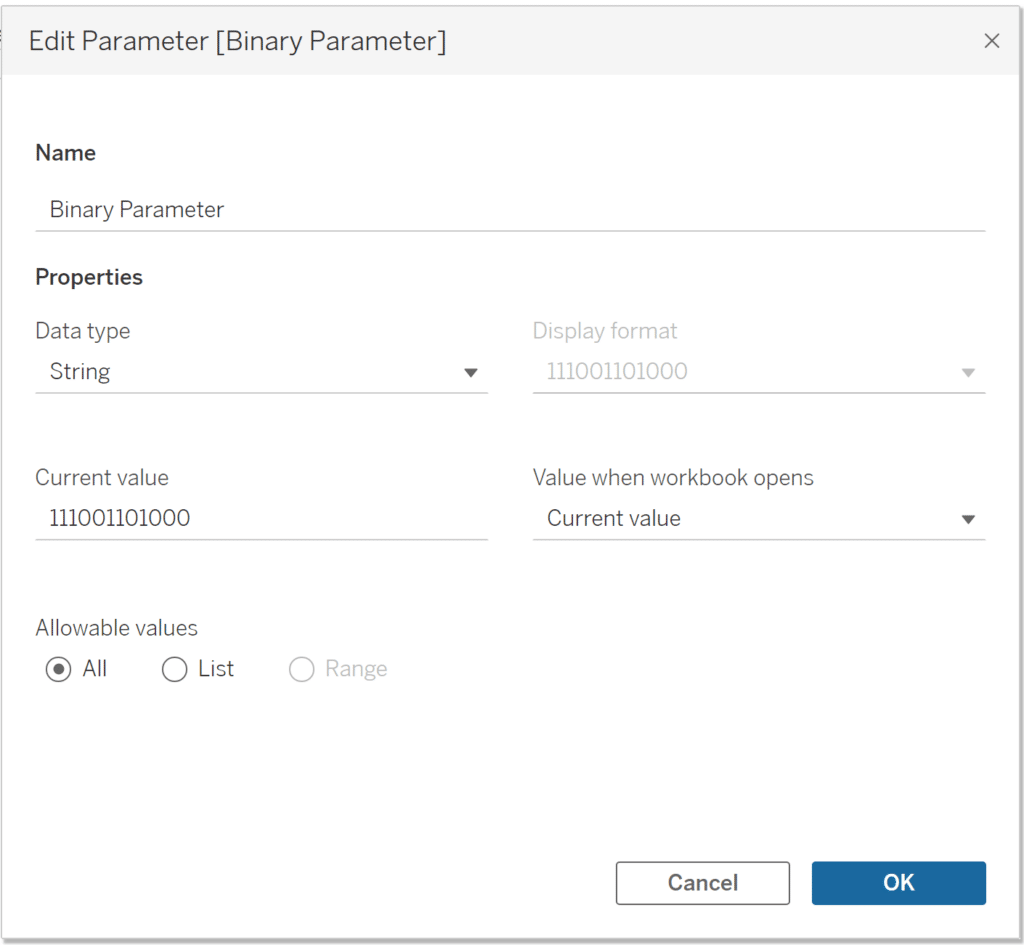
The most important piece of this approach is the ‘Binary Parameter’, which is simply a String parameter with a series of zeroes and ones.
Continue reading with a free account, or login.
Unlock this tutorial and hundreds of other free visual analytics resources from our expert team.
Already have an account? Sign In
By continuing, you agree to our Terms of Use and Privacy Policy.
I recommending using a string parameter over an integer parameter. When developing the technique, I found that strings were easier to work with because they preserve the leading zeros, and are directly compatible with the string functions we’ll be using to isolate, replace, and count the characters. To implement this technique, it’s important to understand the basics of the following Tableau string functions.
![]()
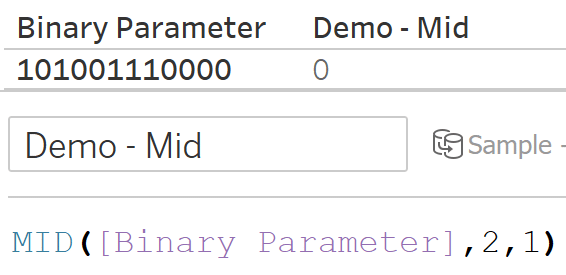
MID() pulls a substring out of a string based on character position. It can be used to isolate a Boolean setting. This function takes three inputs: a string (in our case the Binary Parameter), the start position, and the desired string length. For example, we can use MID([Binary Parameter], 2, 1) to find the second character of the string.
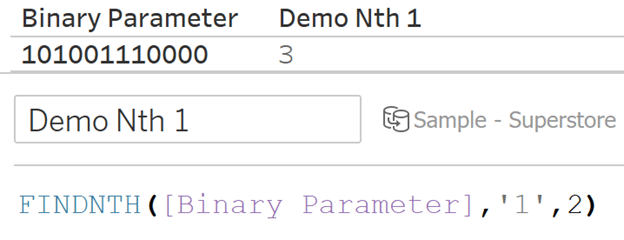
FINDNTH() returns the position of the nth specified character. Here we can use it to find the position of the Nth 1. For example, if the binary string starts with 1010… and we want to find the second 1, FINDNTH([Binary Parameter],’1′,2) will return 3, since the second 1 in this string is the third character.
The function LEN() returns the length of a string, and the function REPLACE() replaces characters in a string with a specified value. We can combine these two functions and use LEN(REPLACE()) to count the number of 1s in the parameter. For example, if the binary string is 01010101, LEN(REPLACE([Binary Parameter],’0′,”)) results in 4. The calculation first removes each 0 by replacing it with an empty space, and then finds the length of the remaining characters which are now all 1s.
An Introduction to String Calculations in Tableau
LEFT() and RIGHT() return the desired number of characters from the left or right of a string. Combined with MID() and LEN(), these string functions can be used to update the parameter input. For example, this calculation could be used to change the second character from 0 to 1 or 1 to 0.
LEFT([Binary Parameter],2-1)
+
IF MID([Binary Parameter],2,1) = ‘0’
THEN ‘1’ ELSE ‘0’ END
+
RIGHT([Binary Parameter],
LEN([Binary Parameter])-2)
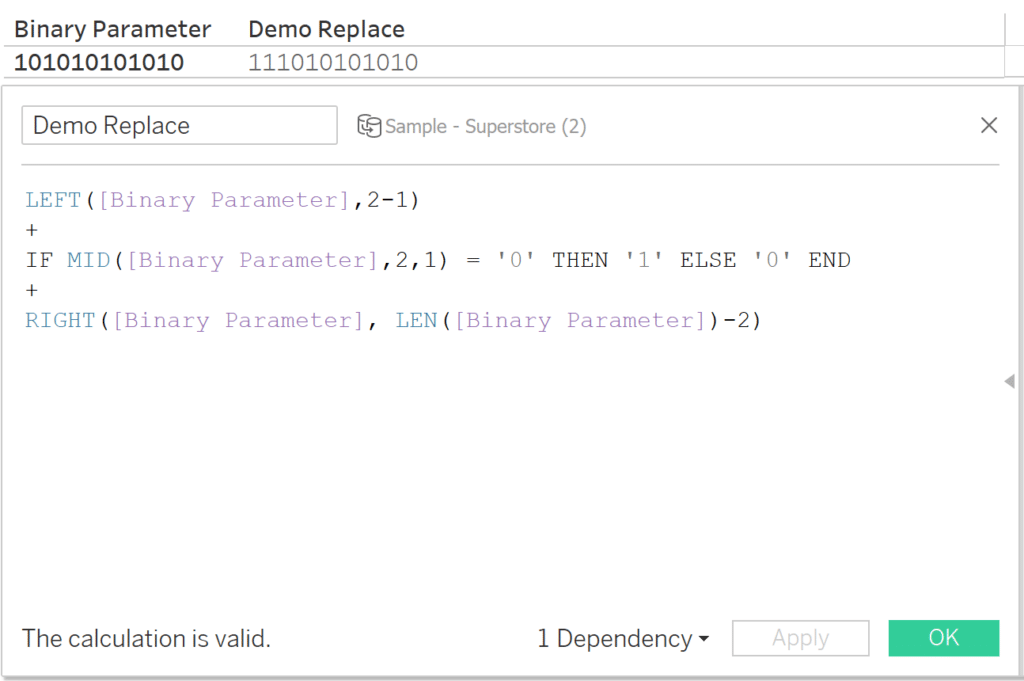
This calculation first uses LEFT() to extract the character to the left of the second character. Next, MID() extracts the second character and we use an IF statement to replace a 0 with a 1, or vice versa. Last, we use RIGHT() and LEN() to extract the rest of the string, minus the first two characters. These three steps combine the string back together with the newly replaced second character.
Multiselect parameters in Tableau: Application 1
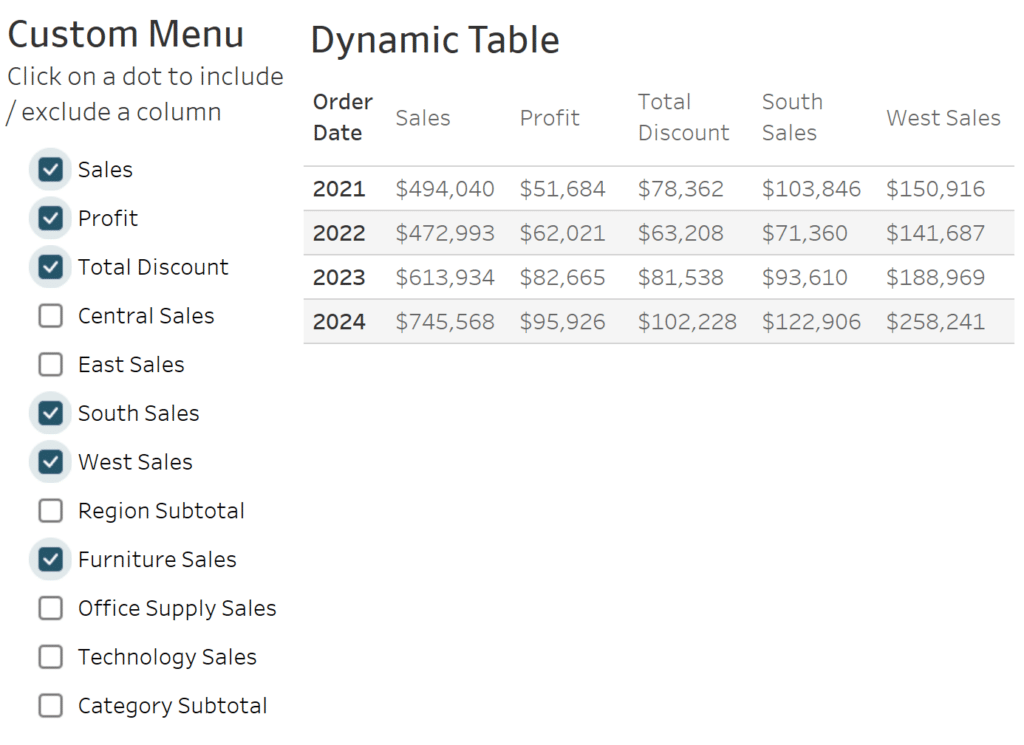
Now that we have covered the necessary string functions, let’s apply these techniques to enhance a simple crosstab. This dynamic table allows users to see Total Sales along with Category, Region, and Segment breakouts. Users can pick which breakouts to include, and columns will always appear in the same order to preserve the groupings.
Create a secondary helper table
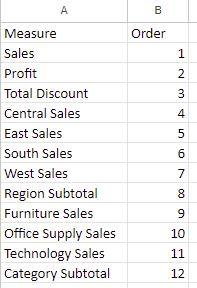
This secondary table isn’t essential but it helps automate field names and parameter actions, reducing the number of calculations Tableau has to process. The table consists of just two columns – the first has the full list of the measures that can appear in your dynamic table. The second has the column order. You can also think of this column as the character position in the Binary Parameter corresponding to the measure.
How to Use Control Sheets for Better Parameter Actions
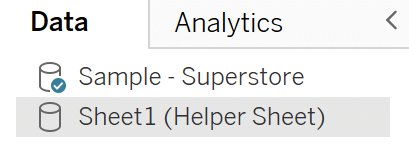
Make sure to add this table to your workbook as a new data source.
New measures based on the Binary Parameter inputs
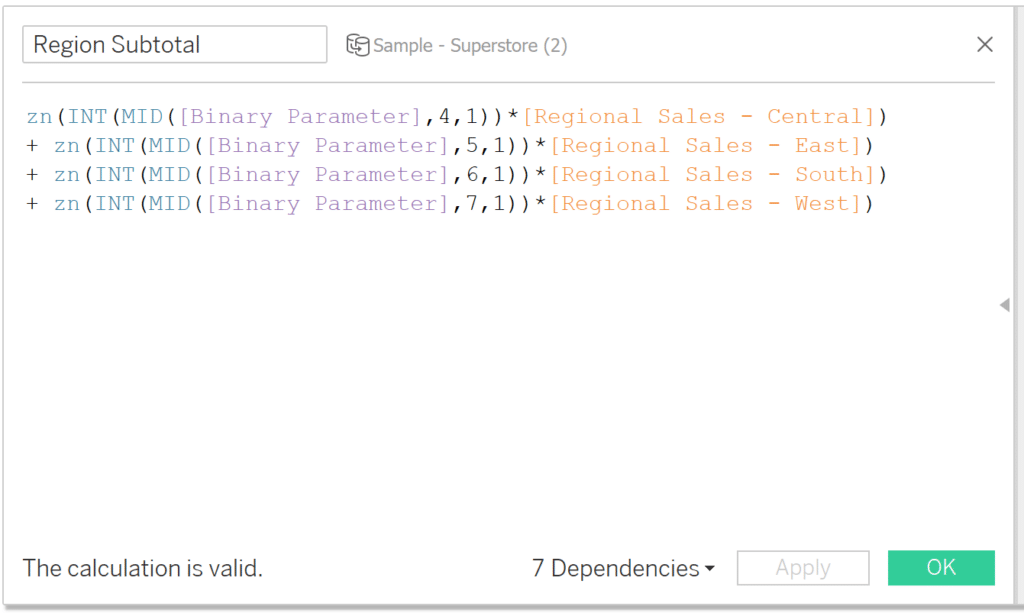
Most of the measures we’re using as inputs are static, so the values for those measures are not affected by the binary parameter, they simply appear or disappear. The Region Subtotal and Category Subtotal measures are different because these calculations will total the regions or categories, including only the values that are marked ‘on’ in the Binary Parameter.
The subtotal calculations multiply measures by their corresponding integers in the Binary Parameter, and then total the resulting values. Take the below Region Subtotal calculation as an example. When all four region measures are included, the subtotal will be equal to Total Sales, but if only West is shown, the subtotal will be equal to the West Sales measure. If no region measures are included, it will equal zero.
This is the Regional Subtotal Calculation
ZN(INT(MID([Binary Parameter],4,1))*[Regional Sales – Central])
+ ZN(INT(MID([Binary Parameter],5,1))*[Regional Sales – East])
+ ZN(INT(MID([Binary Parameter],6,1))*[Regional Sales – South])
+ ZN(INT(MID([Binary Parameter],7,1))*[Regional Sales – West])
Column value calculations
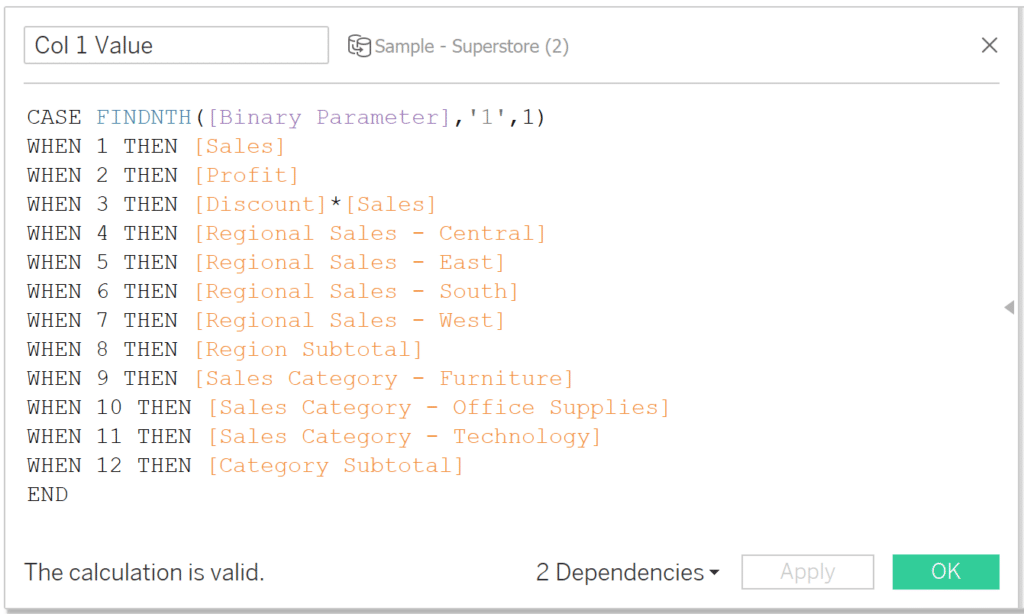
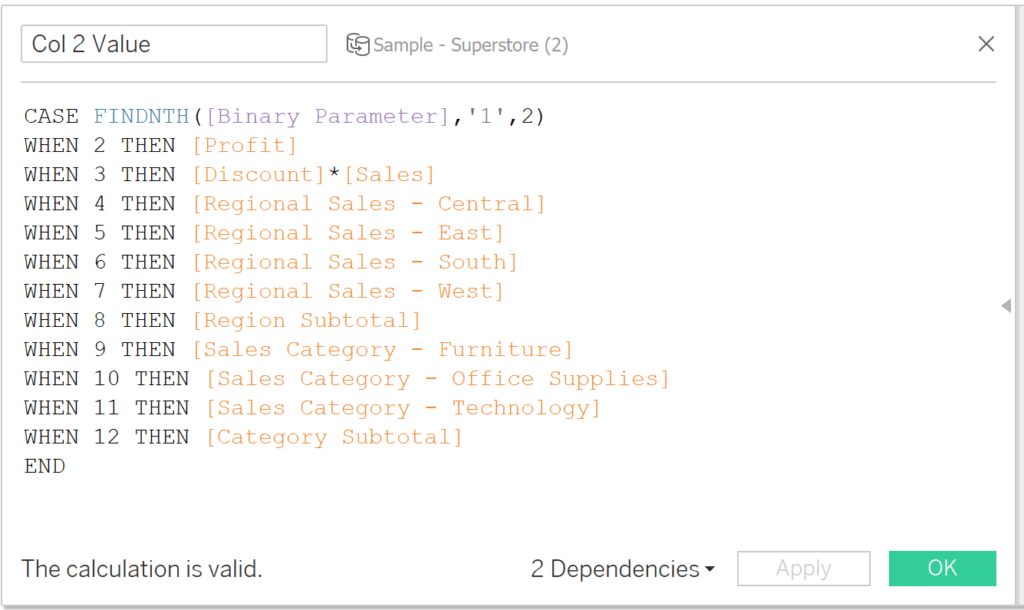
Next we create the calculations that will populate the dynamic table. We will need a separate calculation for each column. The calculation for the nth column will look for the nth 1 in the Binary Parameter, and populate that column with the corresponding measure.
This is the calculation for the first column.
CASE FINDNTH([Binary Parameter],’1′,1)
WHEN 1 THEN [Sales]
WHEN 2 THEN [Profit]
WHEN 3 THEN [Discount]*[Sales]
WHEN 4 THEN [Regional Sales – Central]
WHEN 5 THEN [Regional Sales – East]
WHEN 6 THEN [Regional Sales – South]
WHEN 7 THEN [Regional Sales – West]
WHEN 8 THEN [Region Subtotal]
WHEN 9 THEN [Sales Category – Furniture]
WHEN 10 THEN [Sales Category – Office Supplies]
WHEN 11 THEN [Sales Category – Technology]
WHEN 12 THEN [Category Subtotal]
END
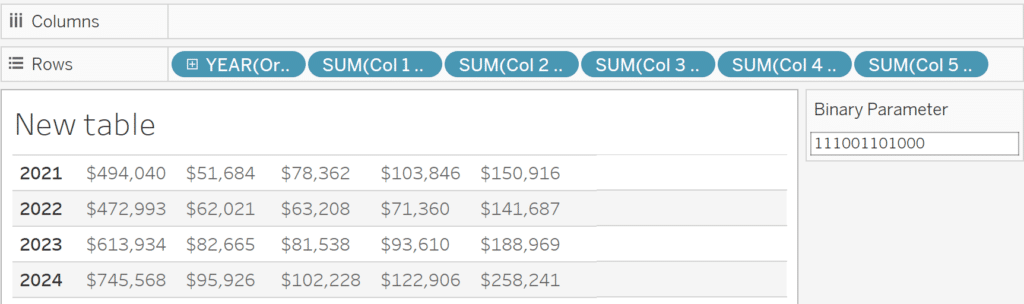
Build the dynamic table
Now we have all of the components to build the dynamic table with our multiselect parameter in Tableau. To do so, place each calculated field you made in the previous step to the Rows shelf.
Build the dynamic headers
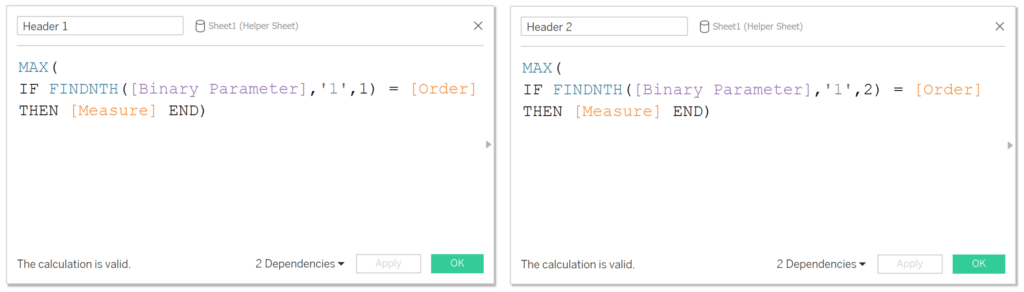
The column headers also require a separate calculation for each column, but fortunately the Helper Table dataset allows us to skip the long case statement. The below calculation for the first column header matches the Order and corresponding Measure from the Helper Table.
MAX(
IF FINDNTH([Binary Parameter],’1′,1) = [Order]
THEN [Measure] END)
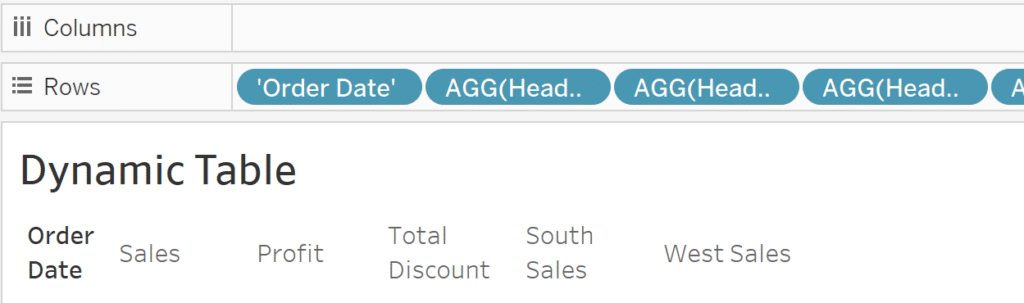
On a separate sheet, place all of the column header calculated fields onto the Rows shelf, like so:
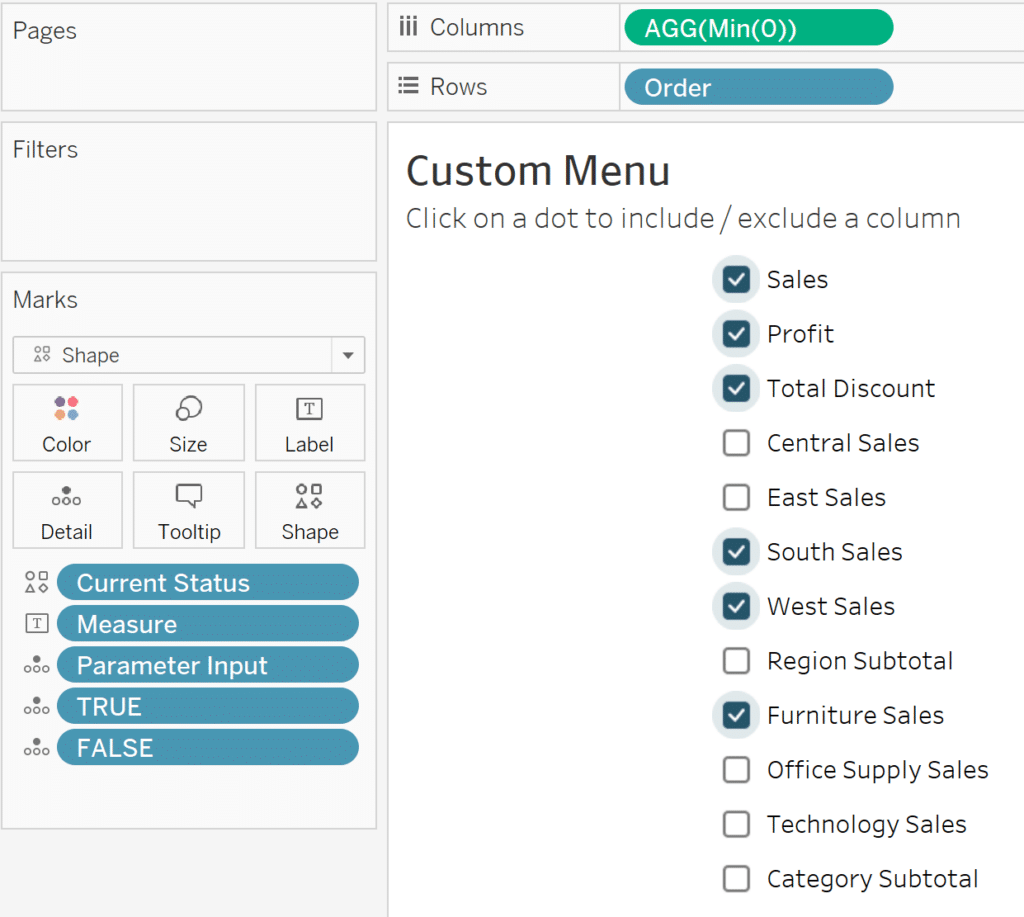
Build a custom menu for multiselect parameters in Tableau
The final worksheet we need to build for this dashboard is a menu that will enable a custom checklist UX once combined with a single parameter action. This sheet lets the user update the Binary Parameter by clicking a checkbox rather than typing directly into the parameter.
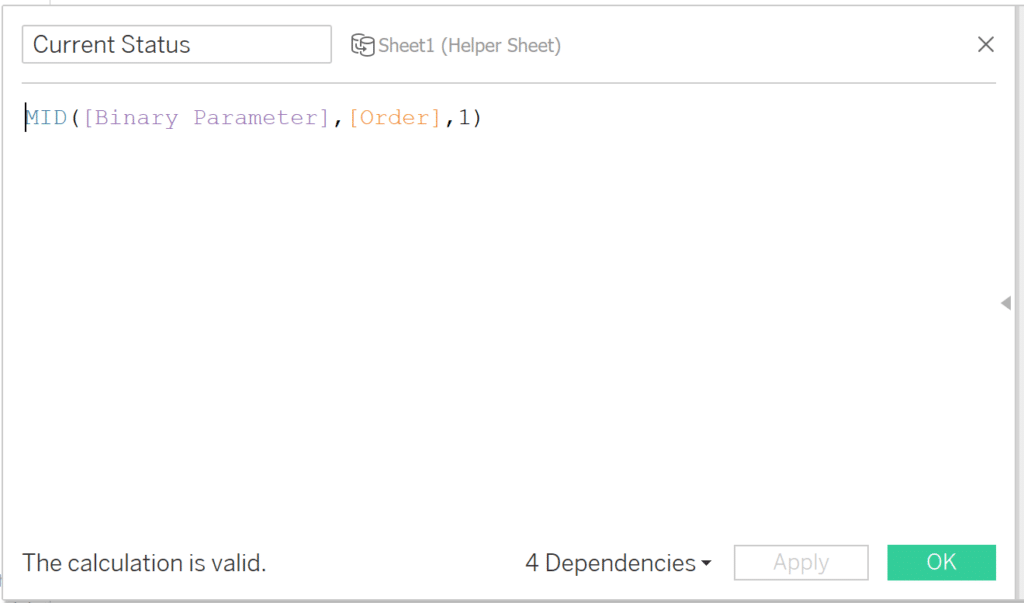
This worksheet uses three calculated fields. The first, Current Status, checks and returns the current position for each measure.
MID([Binary Parameter],[Order],1)
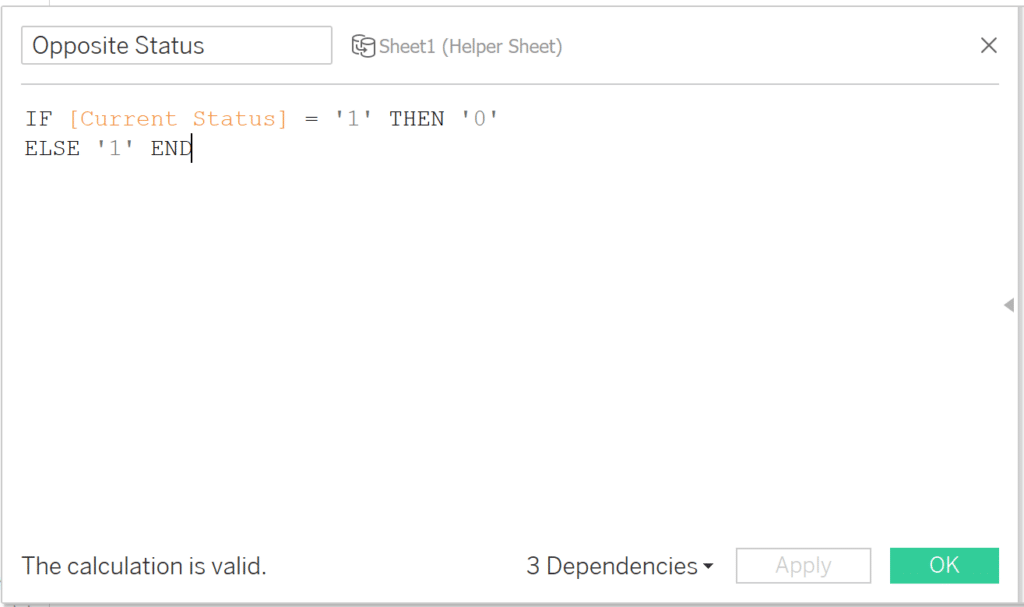
Opposite status flips the Current Status Boolean to the opposite value. The formula is:
IF [Current Status] = ‘1’ THEN ‘0’
ELSE ‘1’ END
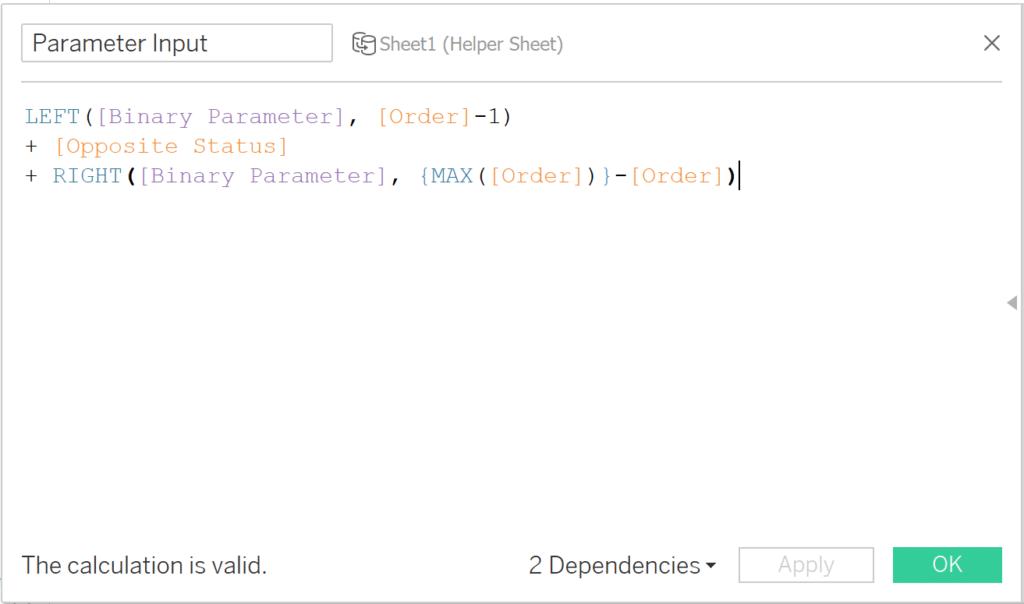
Finally, Parameter Input uses the Opposite Status value to create a string that flips one measure at a time in the Binary Parameter.
LEFT([Binary Parameter], [Order]-1)
+ [Opposite Status]
+ RIGHT([Binary Parameter], {MAX([Order])}-[Order])
To set up the view, I put the Order field on the Rows shelf, set the Mark type to Shape, put the Current Status calculation on the Shape property of the Marks card, and added the Parameter Input calculation to the Detail property of the Marks card. Finally, a placeholder axis with a fixed range pushes the checkboxes to the left side of the pane.
3 Innovative Ways to Use Tableau Scaffolding
Create the dashboard
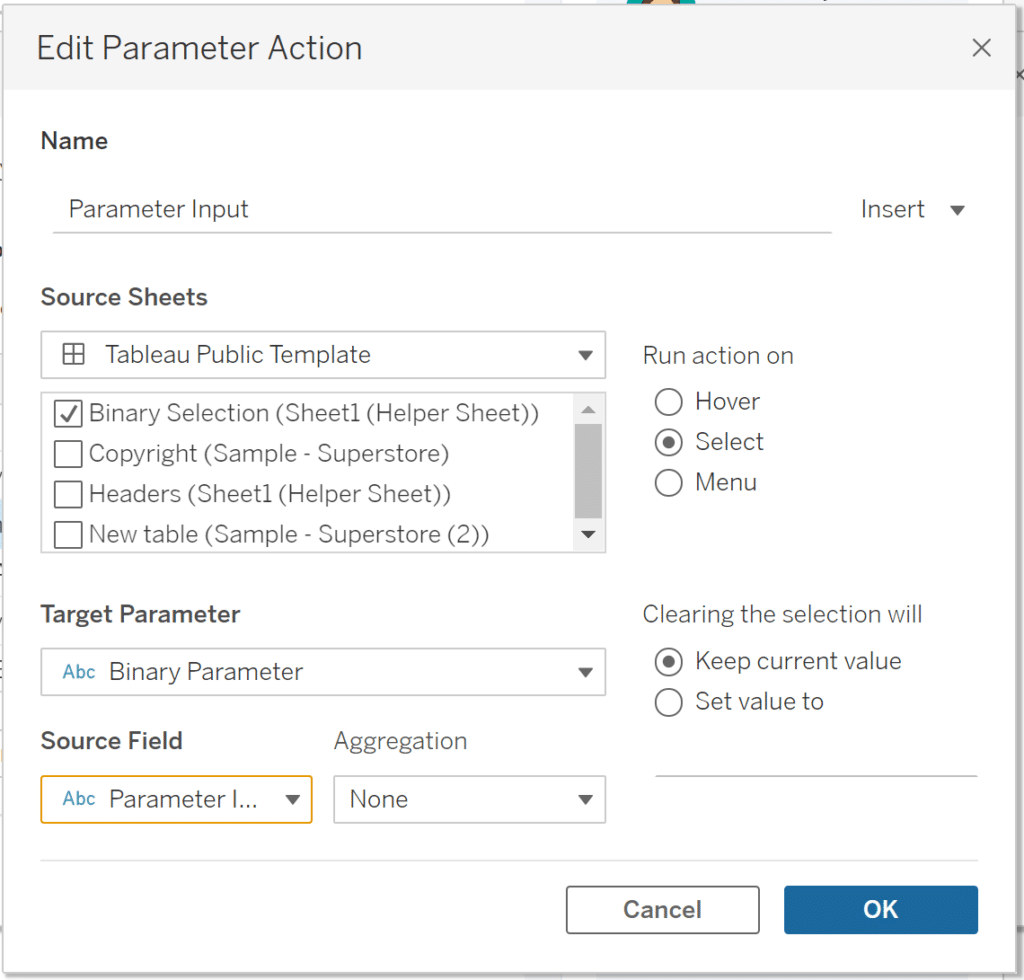
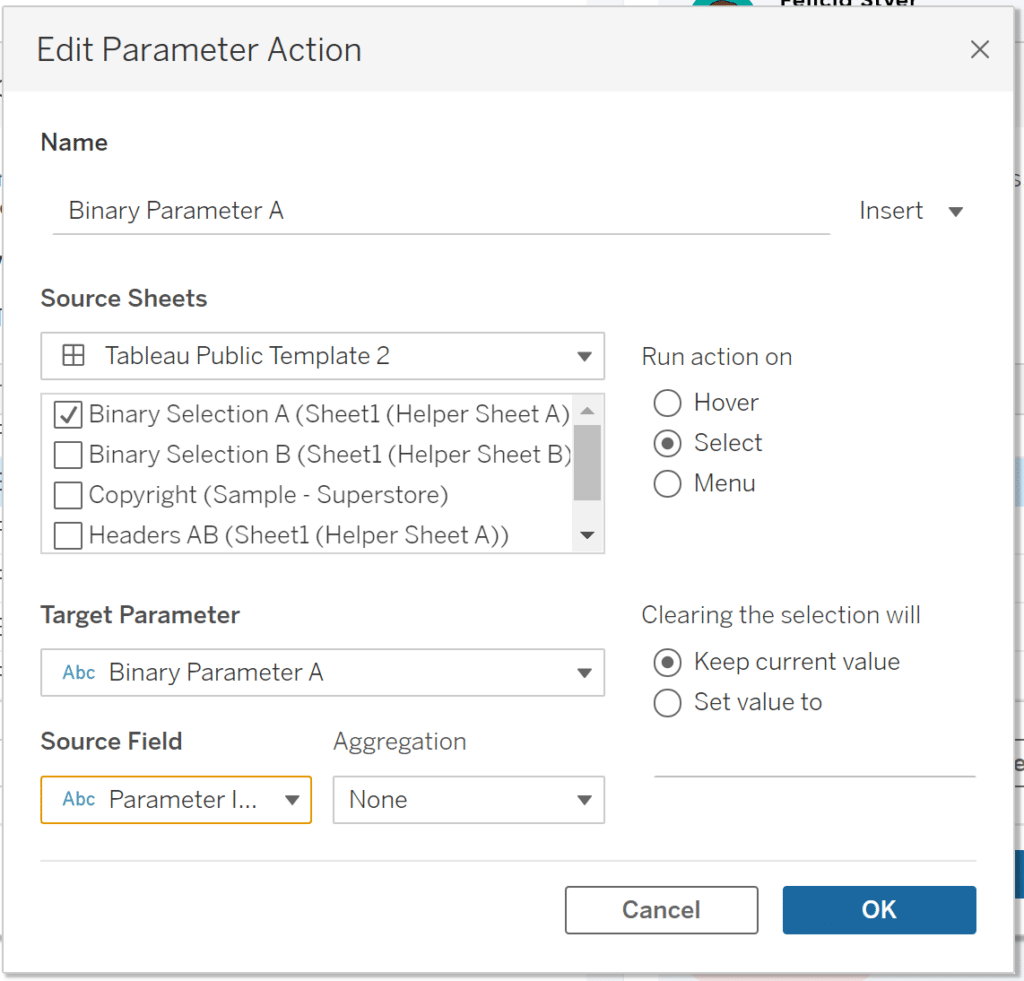
Now we can add all of these sheets to a blank dashboard and create the parameter action that will update the Binary Parameter. When you create the parameter action, make sure the source sheet is your custom menu, the target parameter is the Binary Parameter, and the source field is the Parameter Input calculated field. Don’t forget to have the action run on select as well.
Now clicking on the custom menu will change the dynamic table, dynamic headers, and check or uncheck the list member.
3 Creative Ways to Use Tableau Parameter Actions
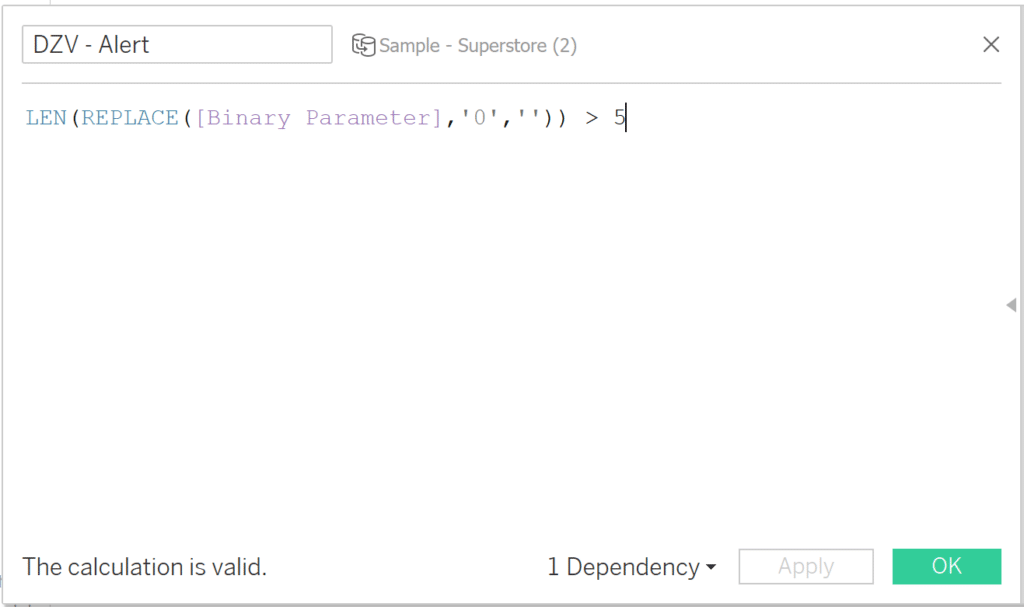
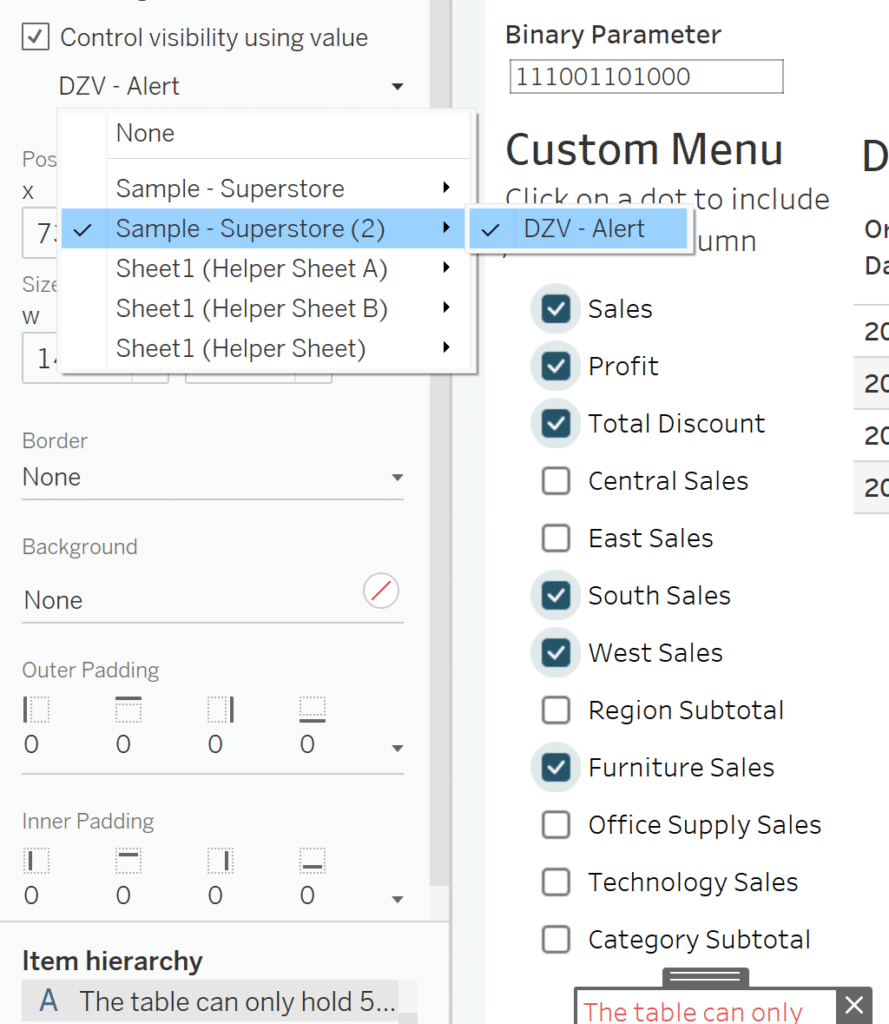
Since we only want our table to include five measure columns at a time, the last step is creating an alert when six or more list members are checked. Start by adding a text object to your dashboard that contains an alert message of your choosing. Then we’ll create a calculation to drive dynamic zone visibility. This calculated field will check the number of 1s in the Binary Parameter and compare it to the number of columns in the dynamic table. We want it to be TRUE when there are more 1s than columns.
LEN(REPLACE([Binary Parameter],’0′,”)) > 5
Finally, select the text box containing your alert message and check the box to control visibility using the DZV – Alert calculated field you just created.
To see this menu in action or copy all the calculated fields shared in this post, download the interactive version.
Multiselect parameters in Tableau: Application 2
We can modify the above technique to artificially create groupings in which we can add and remove columns, while still preserving sort order within each group in the same table! To create groupings, we will split the above helper sheet, calculation, and parameter into as many groupings as we need. For this example, we’ll create two groups.
Create Helper Tables
Each helper table we create will correspond to one group. To create groups A and B, we’re going to create Helper table A and Helper table B. Make sure to restart the order at 1 for each helper table.
The columns for A are the Sales, Profit, and Discount measures from the Sample Superstore dataset. The columns in group B are our regional sales: Central Sales, East Sales, South Sales, and West Sales. Following the same steps as above, our helper sheets will have two columns: Measure and Order. We will add these two helper tables as new datasets in Tableau.
Create column value calculations
Like before, we will create one calculation per column in the dynamic table.
Here is how our first column in Group A will look:
CASE FINDNTH([Binary Parameter A], ‘1’, 1)
WHEN 1 THEN [Sales]
WHEN 2 THEN [Profit]
WHEN 3 THEN [Discount]
END
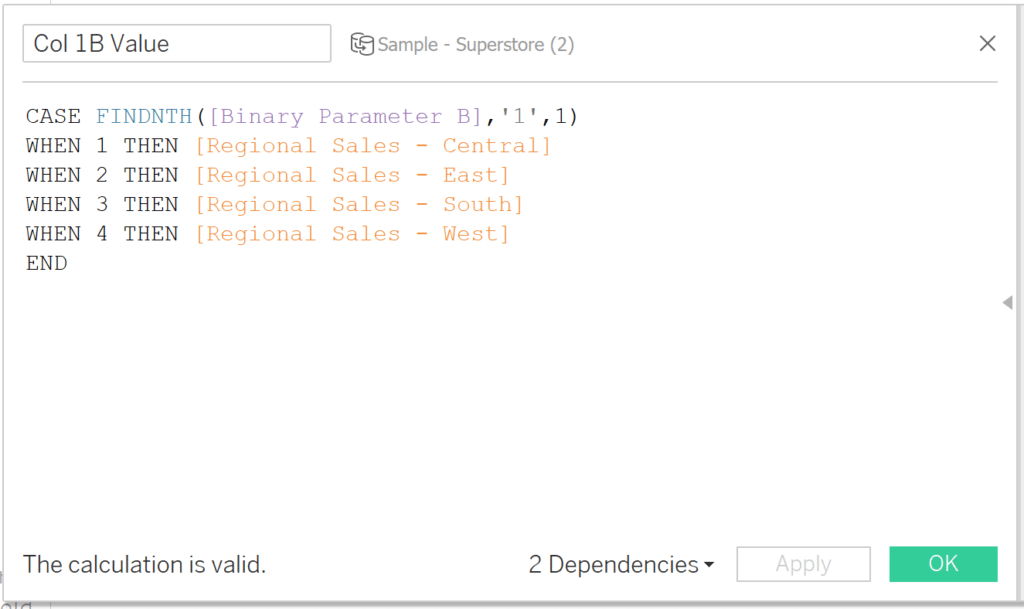
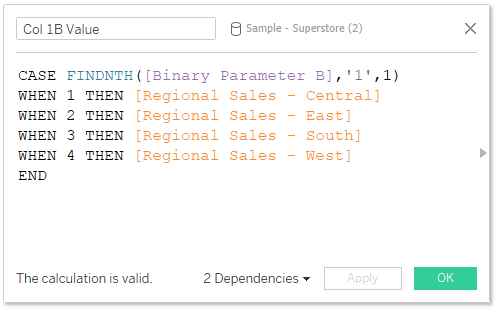
And here is our first column in Group B:
CASE FINDNTH([Binary Parameter], ‘1’, 1)
WHEN 1 THEN [Regional Sales – Central]
WHEN 2 THEN [Regional Sales – East]
WHEN 3 THEN [Regional Sales – South]
WHEN 4 THEN [Regional Sales – West]
END
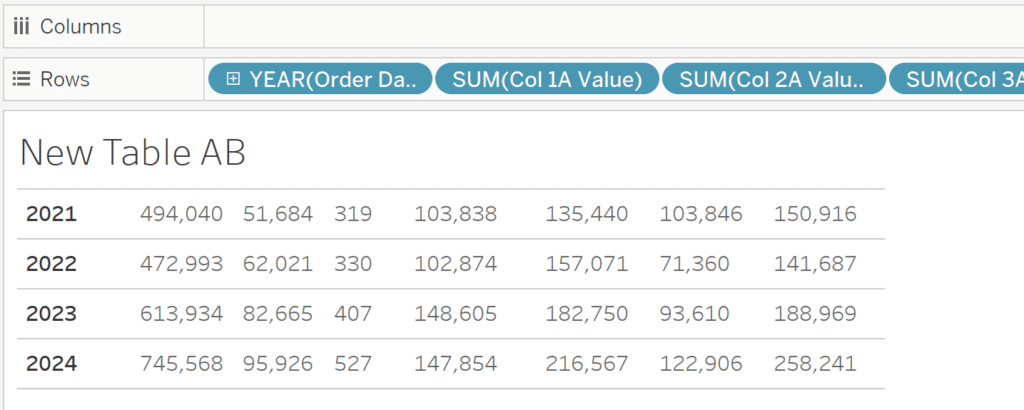
Dynamic Table
Here’s how our dynamic table looks. If you followed the same naming convention as this example, it is important to order the columns in your dynamic table by their grouping first, then by their number (Column 3A goes before Column 1B).
Dynamic Header
Creating the dynamic headers for this application isn’t as straightforward if you choose to use multiple helper sheets. To avoid data blending, we want to create the headers in the same dataset. Since each of our helper sheets have the same field names, we can’t use the above dynamic header calculation because any reference to the [Measure] and [Order] fields will call the [Measure] and [Order] values from the dataset that holds the dynamic header calculations. We’ll have to use a CASE statement and wrap our column names in quotes.
![]()
Header 1A
CASE FINDNTH([Binary Parameter A],’1′,1)
WHEN 1 THEN ‘Sales’
WHEN 2 THEN ‘Profit’
WHEN 3 THEN ‘Total Discount’
Else ”
END
Custom Menu Calculated Fields
For this example, we need a calculation that finds the Current Status, Opposite Status, and a Parameter Input calculation for each group we create.
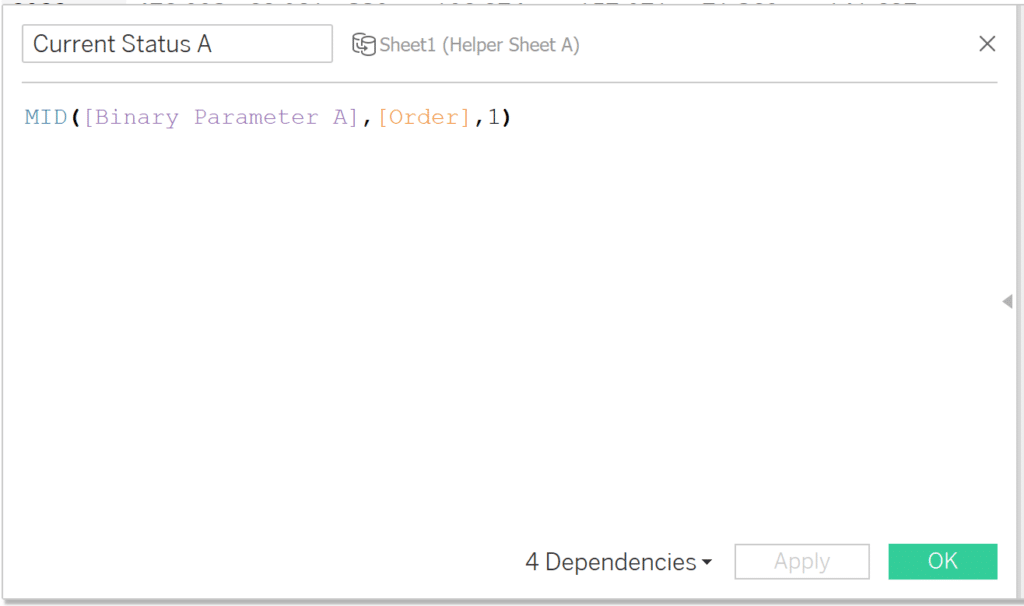
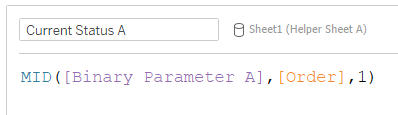
Current Status A
MID([Binary Parameter A], [Order],1)
Opposite Status A
IF [Current Status A] = ‘1’ THEN ‘0’
ELSE ‘1’ END
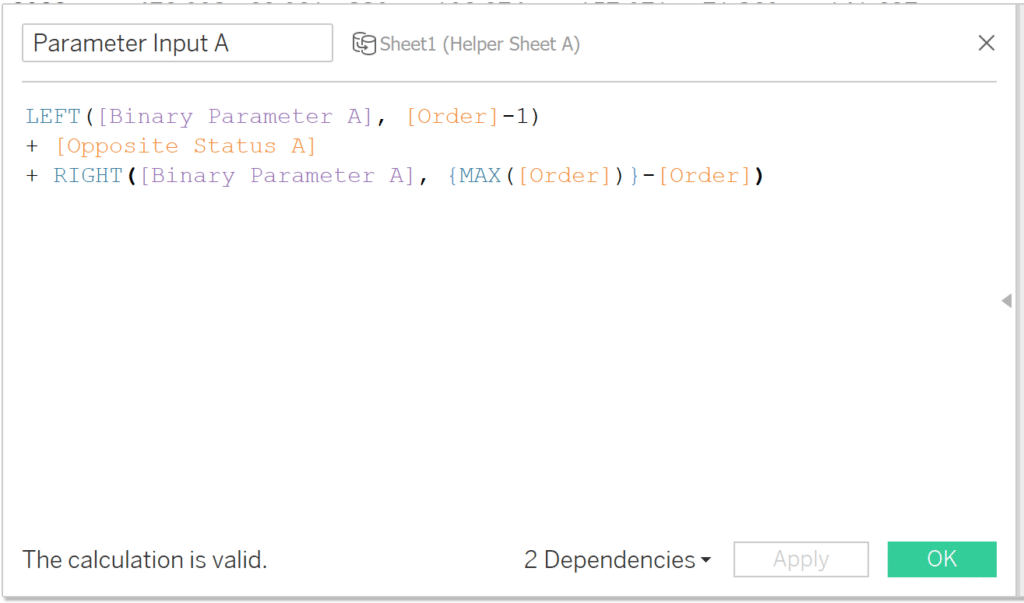
Parameter Input A
LEFT([Binary Parameter A], [Order]-1)
+ [Opposite Status A]
+ RIGHT([Binary Parameter A], {MAX([Order])} – [Order])
Creating the Dashboard
Just like the previous steps, this setup requires a parameter action for each menu created.
Use cases
This dynamic table is just one application of this technique. It’s well suited to situations that require multiselect parameters and situations where order is important. It can also be used like a set, with parameter actions that can add or remove items from the set with a single parameter action. It can create ‘sets’ with values from multiple dimensions, or that group fields themselves like this example of a dynamic table. We would love to see what you create with binary parameters!
Thanks for reading,
Felicia & Juan Carlos

Written By
Felicia Styer

Written By
Juan Carlos Guzman

Peer Review
Dan Bunker
Manager, Decision Engineering

Editorial Review
Megan Spengler
Sr. Visual Analytics Associate
Related Content
How to Completely Customize Multi-Select Filters in Tableau
Filters play a crucial role in allowing users the flexibility to manipulate dashboards to their liking. Multi-select filters can be…
Bringing Tables Together: Tableau Relationships
This is part two in a series on combining data tables together for analysis in Tableau. Other posts in this…
Bringing Tables Together: Tableau’s Physical Layer
Welcome to our series on bringing tables together! This first article is all about the physical layer in Tableau, including…