How to Dynamically Change Number Units Between K / M / B in Tableau

This post will show you how to automatically change number formatting in Tableau between no units for values less than 1000, K for thousands, M for millions, and B for billions. Number display units are a great way to clean up visualization labels or to save real estate in a text table if you are looking to maximize the data-ink ratio.
The issue is that number formatting is all or nothing per measure, so if you set the formatting to display units of K for thousands but then have a value of 100, Tableau will display 0K. Not anymore – there’s a hack for that!
This content is excerpted from my book, Innovative Tableau: 100 More Tips, Tutorials, and Strategies, published by O’Reilly Media Inc., 2020, ISBN: 978-1492075653. Get the book at Amazon.
Normalize the units with a calculated field
Because formatting is per measure in Tableau, I’ve previously covered how to dynamically format measures, even when your field requires more than two number formats (i.e., integers, currency, and percentages). The trick to dynamically changing display units between none / K / M / B follows a similar approach, but instead of a calculation for the number prefix and suffix, you need a calculated field that normalizes each measure and a second calculated field for the suffix (which becomes the display units).
![]()
Continue reading with a free account, or login.
Unlock this tutorial and hundreds of other free visual analytics resources from our expert team.
Already have an account? Sign In
By continuing, you agree to our Terms of Use and Privacy Policy.
If I wanted to dynamically change display units for the Sales measure in the Sample – Superstore dataset, the first formula would be:
IF SUM([Sales]) >= 1000000000 THEN SUM([Sales]) / 1000000000
ELSEIF SUM([Sales]) >= 1000000 THEN SUM([Sales]) / 1000000
ELSEIF SUM([Sales]) >= 1000 THEN SUM([Sales]) / 1000
ELSE SUM([Sales])
END
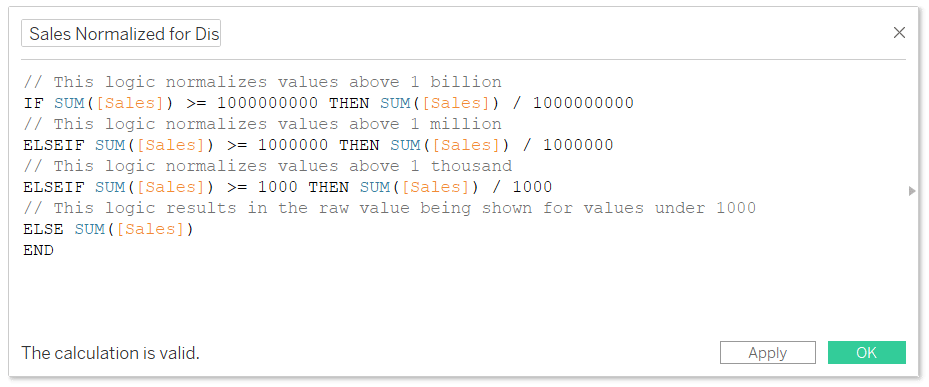
I will also go ahead and set the default formatting of this calculated field so that it always has a $ sign and two decimal places. You can modify the default formatting of a calculated field by right-clicking on it from within the Measures area of the Data pane, hovering over “Default Properties”, and clicking “Number Format…”.
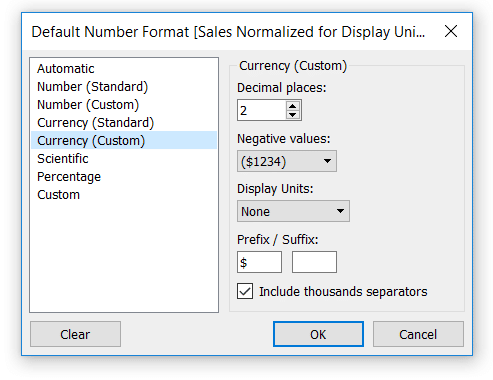
The prefix will always be a dollar sign, but leave the suffix blank because that is what we will dynamically control with the next step.
Create the display units suffix
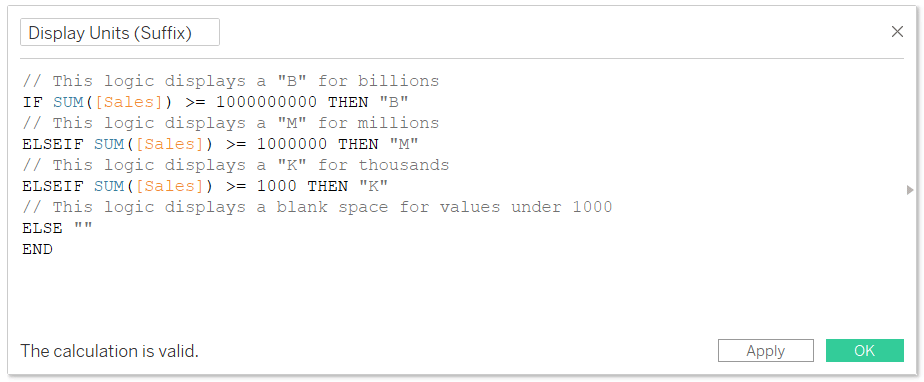
The second calculated field displays the appropriate format based on the measure value. If you want to show B for billions, M for millions, and K for thousands, the formula is:
IF SUM([Sales]) >= 1000000000 THEN “B”
ELSEIF SUM([Sales]) >= 1000000 THEN “M”
ELSEIF SUM([Sales]) >= 1000 THEN “K”
ELSE “”
END
To use this in a text table, place the normalization and suffix calculated fields on the Text Marks Card together. You can format the text so the two results from the calculations are on the same row, making them appear seamless. Of course, you can also format the text for style, such as font, size, and color.
Even though the Display Units (Suffix) calculated field always results in text, you will find it in the Measures area of the Data pane because the result is dynamic. For more, watch An Introduction to String Calculations in Tableau from Playfair+.
![]()
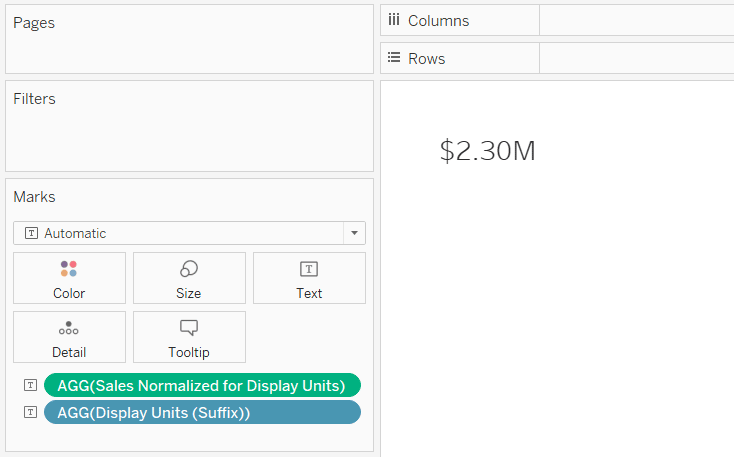
Since we have not specified any level of detail more granular than the entire Sample – Superstore dataset, we are looking at the total Sales amount for the file, which is $2,297,201. Because this number is greater than one million, our normalization calculated field divided it by one million, and our suffix calculated field displayed a M.
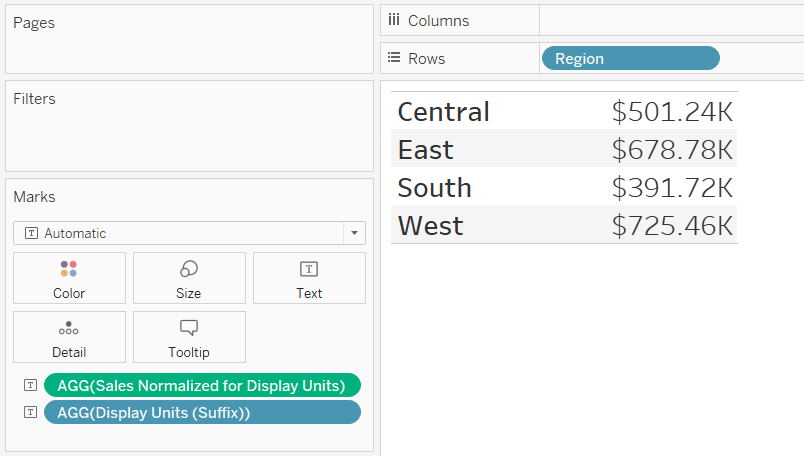
If I add the Region dimension to the view, which has dimension members with values between one thousand and one million, the calculations work to properly normalize the values into thousands and display a K.
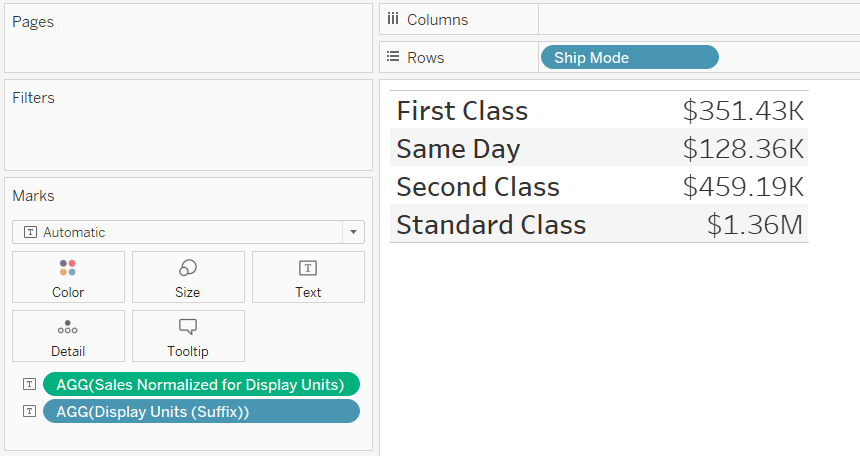
The normalization and suffix calculated fields compute the results at the viz level of detail, so beware that you can get a mix of results, which can be confusing for your audience. Here’s an example when using Ship Mode as the dimensional breakdown.
Pitfall: Don’t mislead your audience

While I like display units because they help reduce redundant data ink, and I particularly like the tactic being shared to dynamically change display units for its convenience, there are a couple of pitfalls to beware of. Since the normalization calculation happens at the viz level of detail, you may end up with some dimension members being divided by different numbers, which can be misleading to your audience. This tactic works best if all dimension members will have the same tier of results (i.e., billions, millions, or thousands).
The misleading effect is particularly problematic for visualizations because every number, regardless of how it was normalized, will share the same axis scale. For example, if one bar has been divided by one million while another bar was divided by one thousand, the best-performing dimension member will appear to have performed the worst! That being said, this is still an effective tactic for dynamically changing labels on visualizations (as opposed to marks).

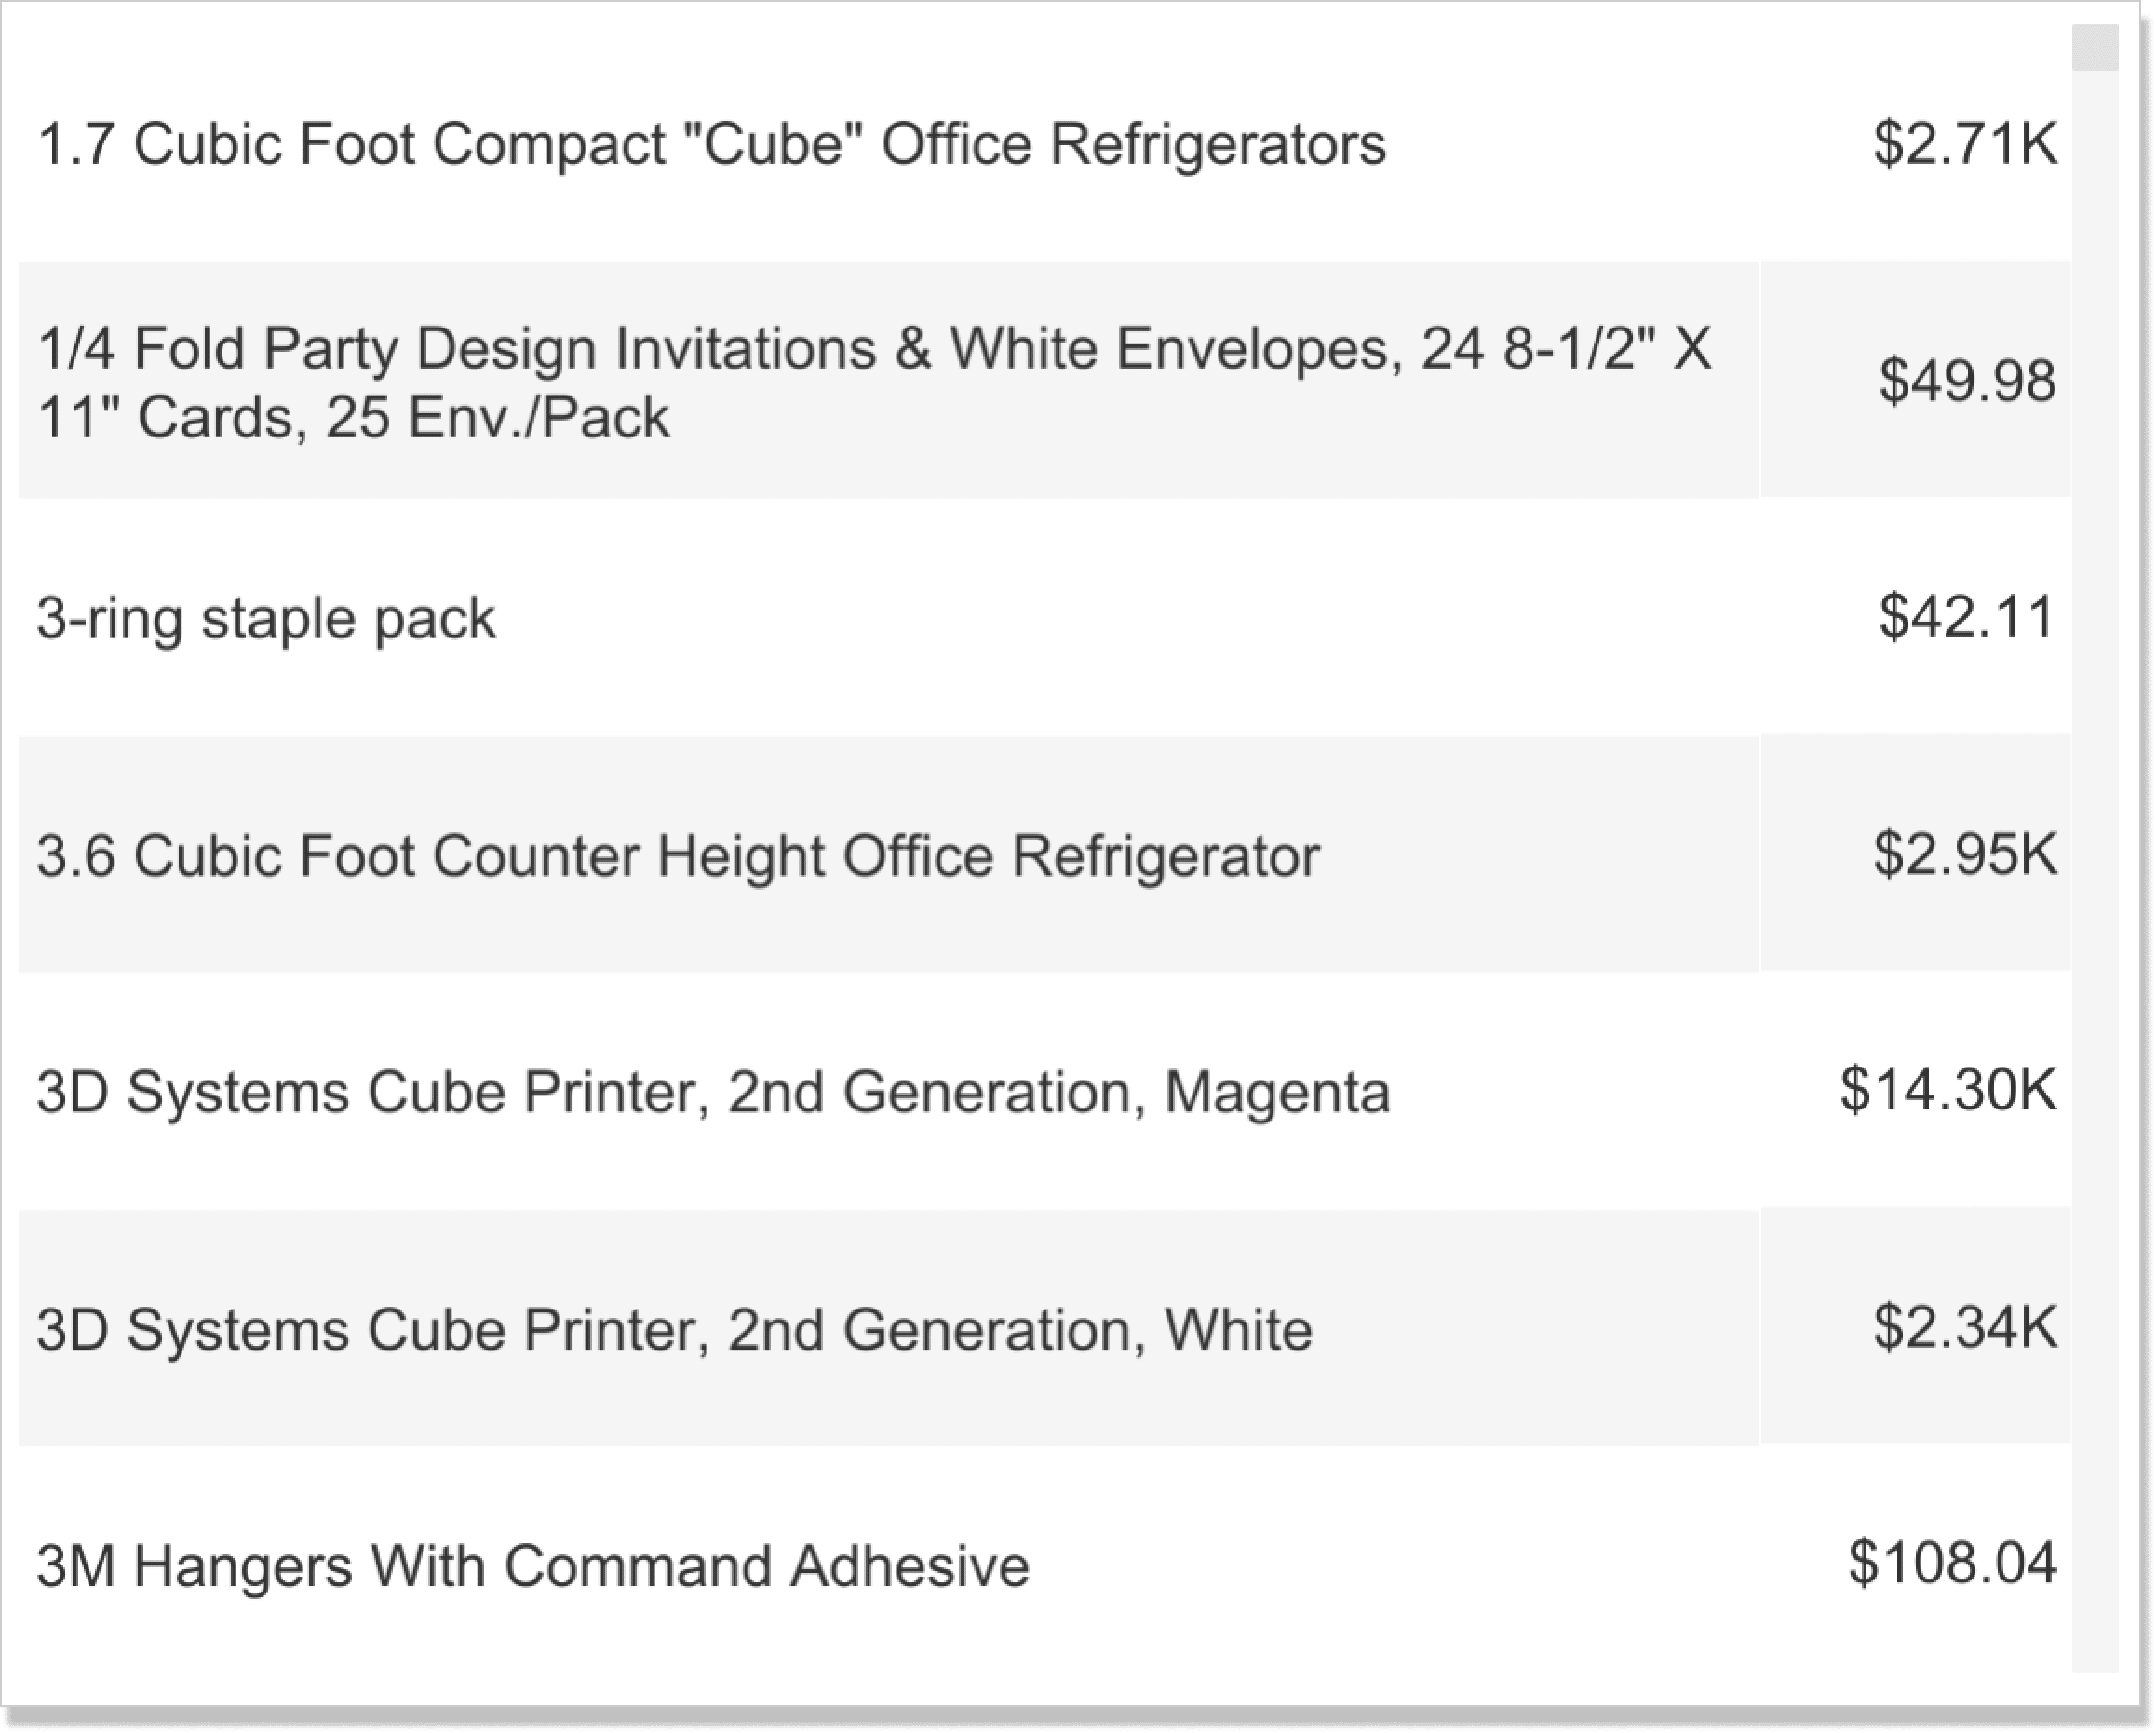
For the last example, I will break the Normalized Sales measure down by the Product Name dimension.
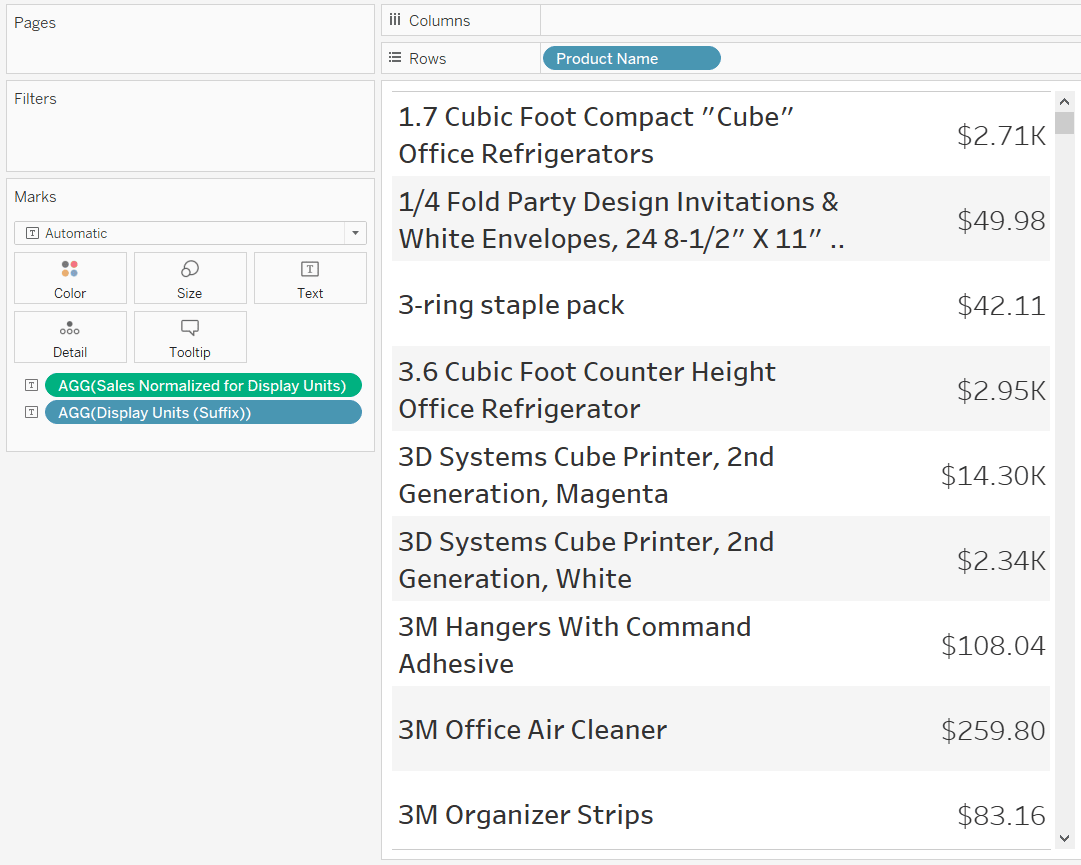
As you can see, whenever a product has a thousand dollars of Sales or more, our calculations normalized the result into thousands with a K. The values under one thousand dollars in Sales get no display units and the raw result in currency formatting is displayed.
The Sample – Superstore dataset does not have an example of Sales greater than one billion, but our calculations would work the same way as you’ve seen here with millions and thousands.
This approach also theoretically works with Trillions. If your company is working with numbers in the trillions, you should get in touch with Playfair Data. 🙂
For more ideas on improving text tables in Tableau, see:
3 Ways to Create Charming Crosstabs in Tableau
Ten Tableau Text Tips in Ten Minutes
Thanks for reading,
– Ryan


Written By
Ryan Sleeper
Related Content
The Beginner’s Guide to Basic Tableau Calculated Fields
At Playfair Data, we call calculated fields one of the “Big 3” – the three technical features that unlock the…
3 Innovative Ways to Use Tableau Scaffolding

If you have been working with Tableau for any length of time, you have probably come across tutorials utilizing the…

Dan Bunker
Enhance Dashboard UX with Dynamic Zone Visibility In this tutorial, Dan explains Tableau’s dynamic zone visibility feature and how it…