How to Use Tableau Set Actions to Compare the Top N vs Other

Tableau set actions are a new (as of version 2018.3) type of dashboard action that will unlock new user experiences by allowing you to dynamically control which dimension members are included in a set. Some of my favorites that have already been figured out include How to Highlight with Color by Matt Chambers, How to Change Dimensions by Lindsey Poulter, How to Make a Cross-Highlight by Rody Zakovich, and How to Drilldown in a Single Sheet by Ann Jackson, just to name a few.
A general thread that I’ve noticed between the innovative applications of set actions is they’re often used to make existing dashboards and tutorials better, and I am no exception. I’ve shown you before how to dynamically group the top N vs everything else using a parameter. This is a user experience I like because it reduces the cognitive load on my end user, making it easier for them to consume the view. In this post, I will make this experience even better by using set actions to allow my end user to choose the top N by simply clicking on the dimension members on a chart.
Two Ways to Dynamically Display the Top N vs. Other in Tableau
Create a top N set
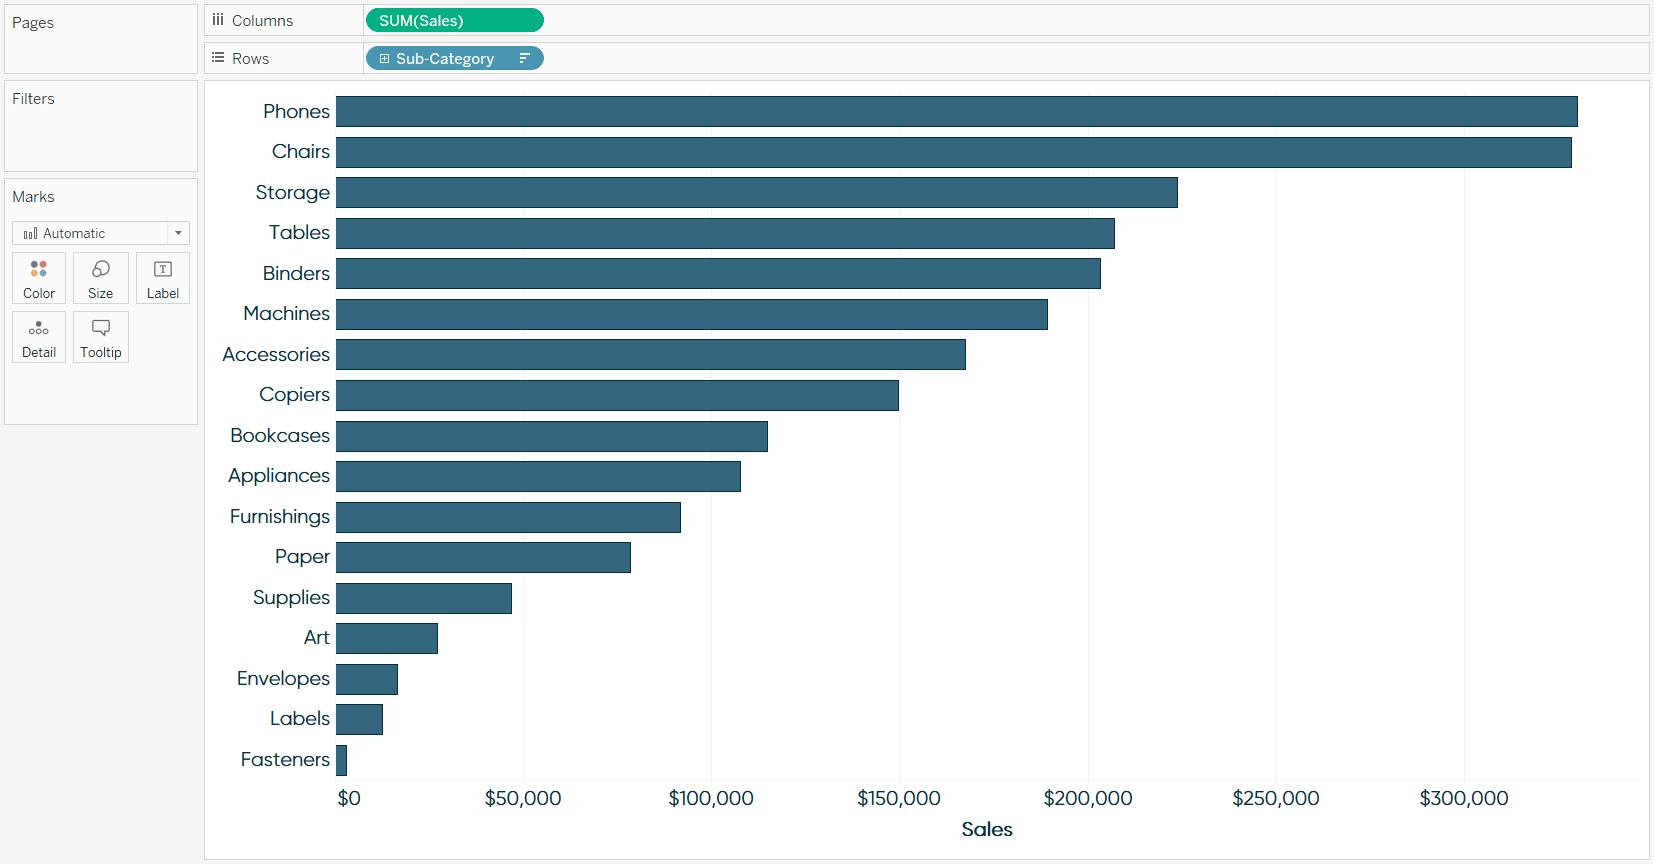
For this example, we will build a bar chart using the Sales measure and Sub-Category dimension from the Sample – Superstore dataset. Eventually, the end user will be able to click on a set of bars to classify those dimension members as the top N or the focus of the dashboard. The remaining dimension members that were not clicked on will be grouped into one bar called “Other”. Here is the foundational bar chart:
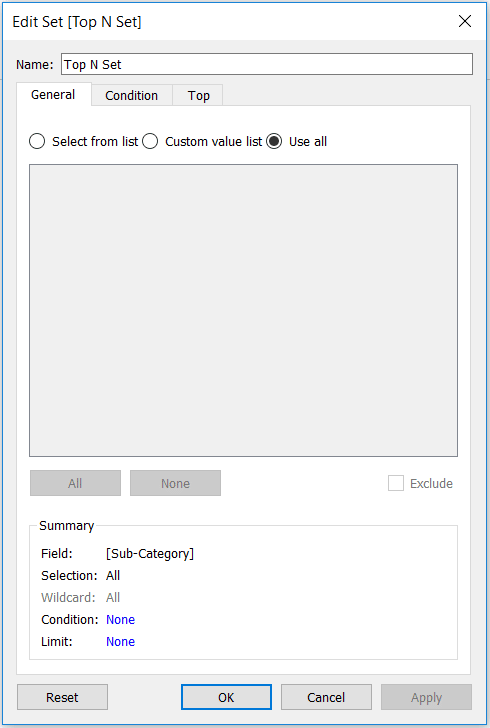
To use set actions, you need a set. So, the first step to creating this user experience is to create a set out of the Sub-Category dimension. The dimension members you include in the set at this point don’t matter too much because they will be overwritten later by the selections made in the set action.
![]()
Continue reading with a free account, or login.
Unlock this tutorial and hundreds of other free visual analytics resources from our expert team.
Already have an account? Sign In
By continuing, you agree to our Terms of Use and Privacy Policy.
I will go ahead and choose to place all the Sub-Category members in the set so, until a selection is made later, everything will be grouped into the set.
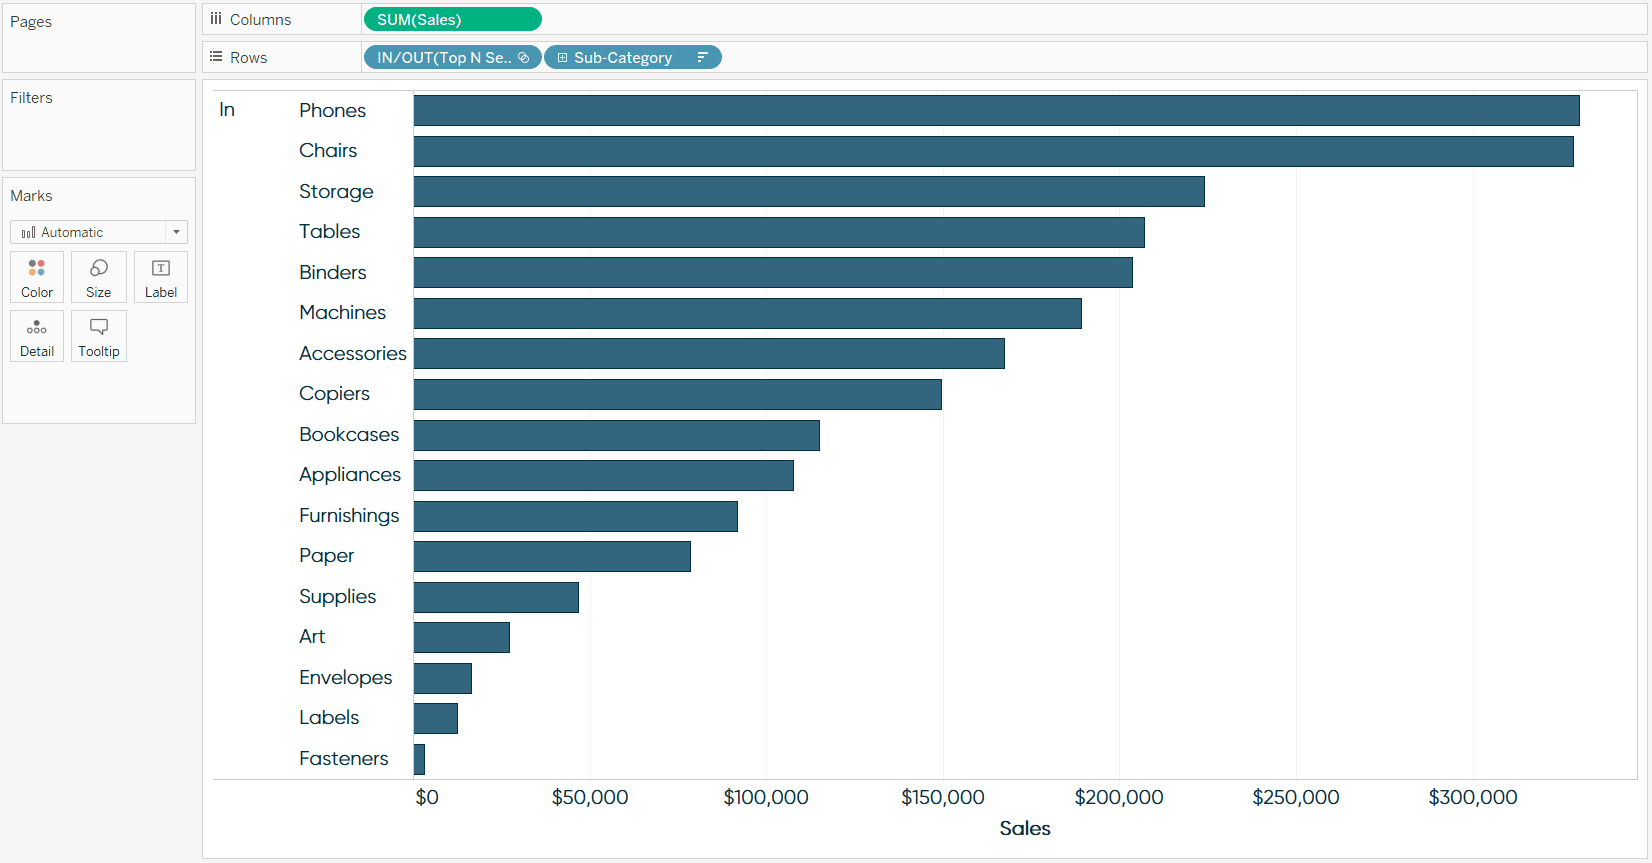
One of the ways to use Tableau sets is as a dimension. To show you how this is working, I will place the newly created Top N Set on the Rows Shelf. Like I said, because all dimension members are in the set to start out with, we just see one row showing that everything is “In” the set so far.
The top N vs. other calculated field
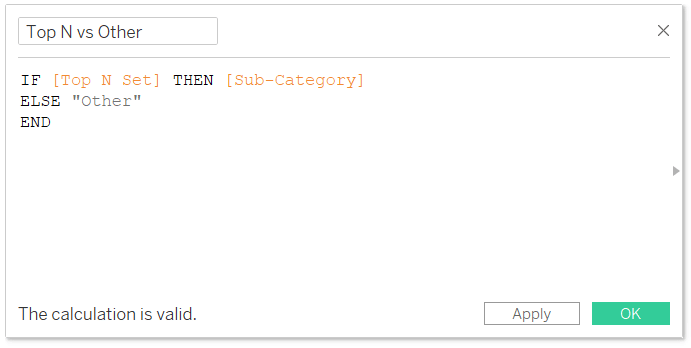
Next, we have to create a calculated field that tells Tableau to display the name of the Sub-Category if the dimension member is in the set, and to group everything else into a row called “Other”. The formula is:
IF [Top N Set] THEN [Sub-Category]
ELSE “Other”
END
Now we will replace the original Sub-Category dimension on the Rows Shelf with this newly created calculated field. When the sub-category is in the set, we will see the name of that sub-category on the bar chart. If the sub-category is out of the set, it will be grouped into one bar called “Other”. Again, we created our set so that all 17 sub-categories are starting out in the set, so we don’t see the Other bar yet.

For set actions to work, the dimension used to generate the set must be part of the view. Since we just replaced the Sub-Category dimension that was generating the Top N Set with our Top N vs Other calculated field, we need to get Sub-Category back on the view. You can do this by placing the original Sub-Category dimension on the Detail Marks Card.

Bringing the user experience to life with set actions
We’re now ready to make our dashboard and add a set action. First, add the worksheet to a dashboard, then click Dashboard > Actions in the top navigation. After clicking the “Add” button, you will see a type of action called “Change Set Values…”; this is the new set actions feature available as of Tableau version 2018.3. Here’s how my set action is set up to create the user experience I’m looking for:
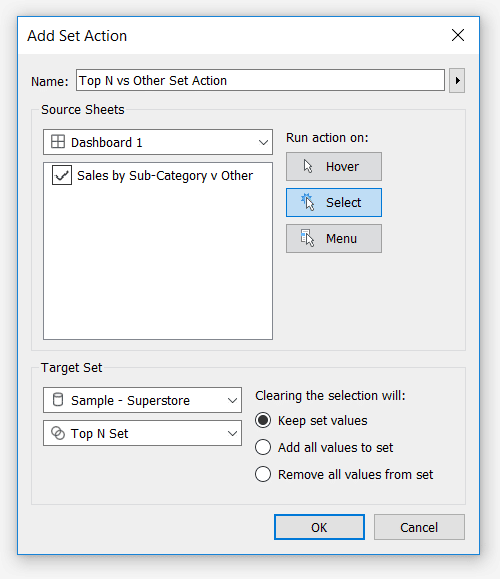
The settings for this set dashboard action are saying that if you click (i.e. select) dimension members in the one sheet on the view, they will be placed in the Top N Set from the Sample – Superstore dataset. If I clear out the selection by clicking the Escape key, the set will persist until another selection is made. Click OK to close the dashboard action windows.
![]()
Now the fun part. If I draw a box around the top five marks to select them….
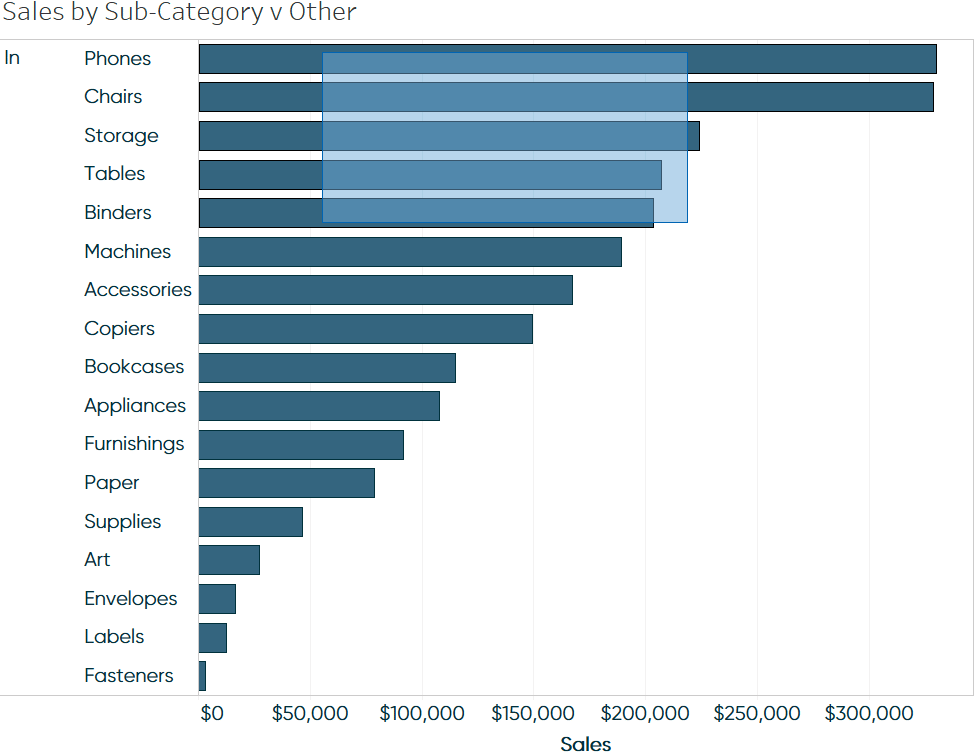
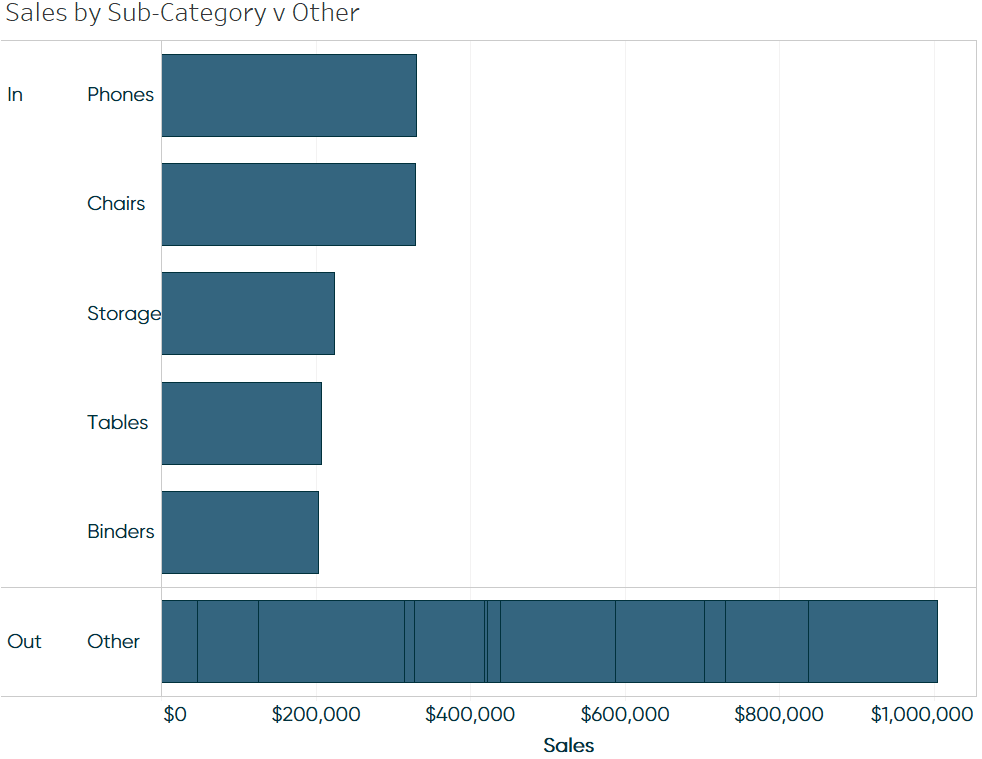
Those five marks overwrite the selections in the Top N Set we created earlier. Our calculated field then takes that set and separates it into two outcomes: (1) when the dimension member is in the set, we see the name of the sub-category; (2) when the dimension member is out of the set, it gets grouped into one row called “Other”.
Here’s how my final view looks after clicking the undo button once to reset the Top N Set, hiding the In / Out header, and selecting the top 10 to show you one more example.
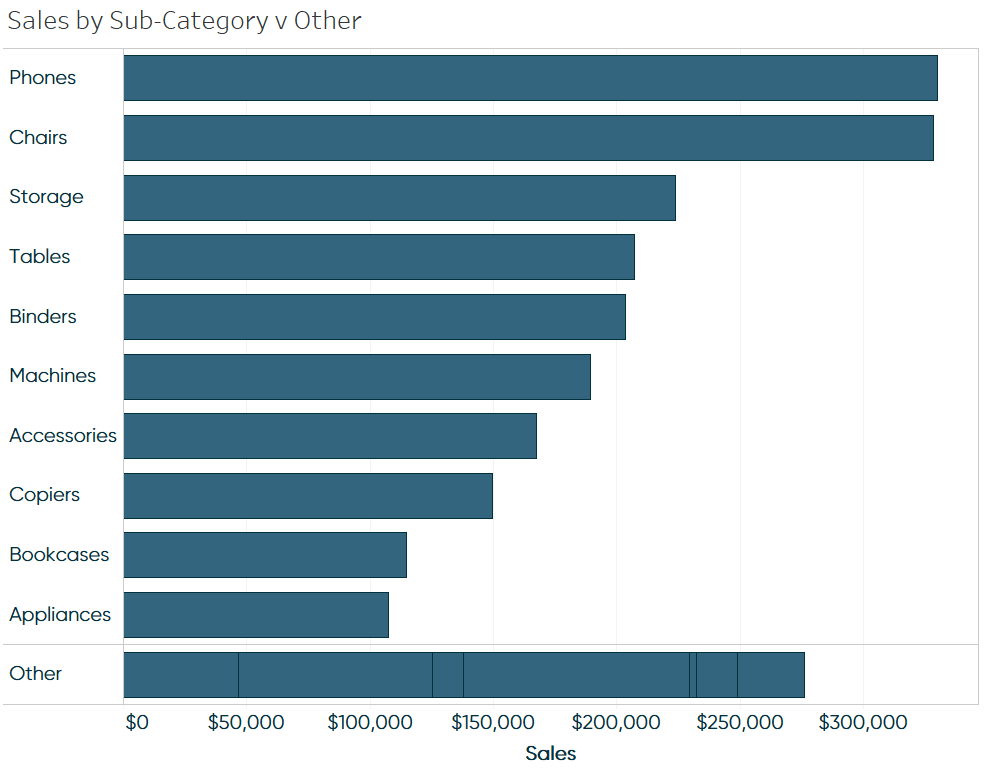
This technique has improved the focus of this view, added context that helps illustrate the magnitude of the top N, and reduced the cognitive load on my end user – all of which are helping make this analysis more effective.
Thanks for reading,
– Ryan


Written By
Ryan Sleeper
Related Content
The Definitive Guide to Tableau Sets

In this post you will learn how to: (1) create static Tableau sets, (2) create dynamic sets, (3) use sets…
How to Do Better What-If Scenario Planning with Tableau Set Controls
A long time ago, in a Tableau galaxy far away (aka 2014), I shared how to make a what-if analysis…
How to Create Persistent Comparison Sets Across Tableau Dashboards
Comparisons help us find and communicate insights in Tableau and segmentation (a type of comparison) is one of the best…