Playfair Data Launches Interactive Dashboards for NFL’s Occupational Mobility Report
Game-Changing data visualization

2023 NFL Diversity and Inclusion Report Visualizations
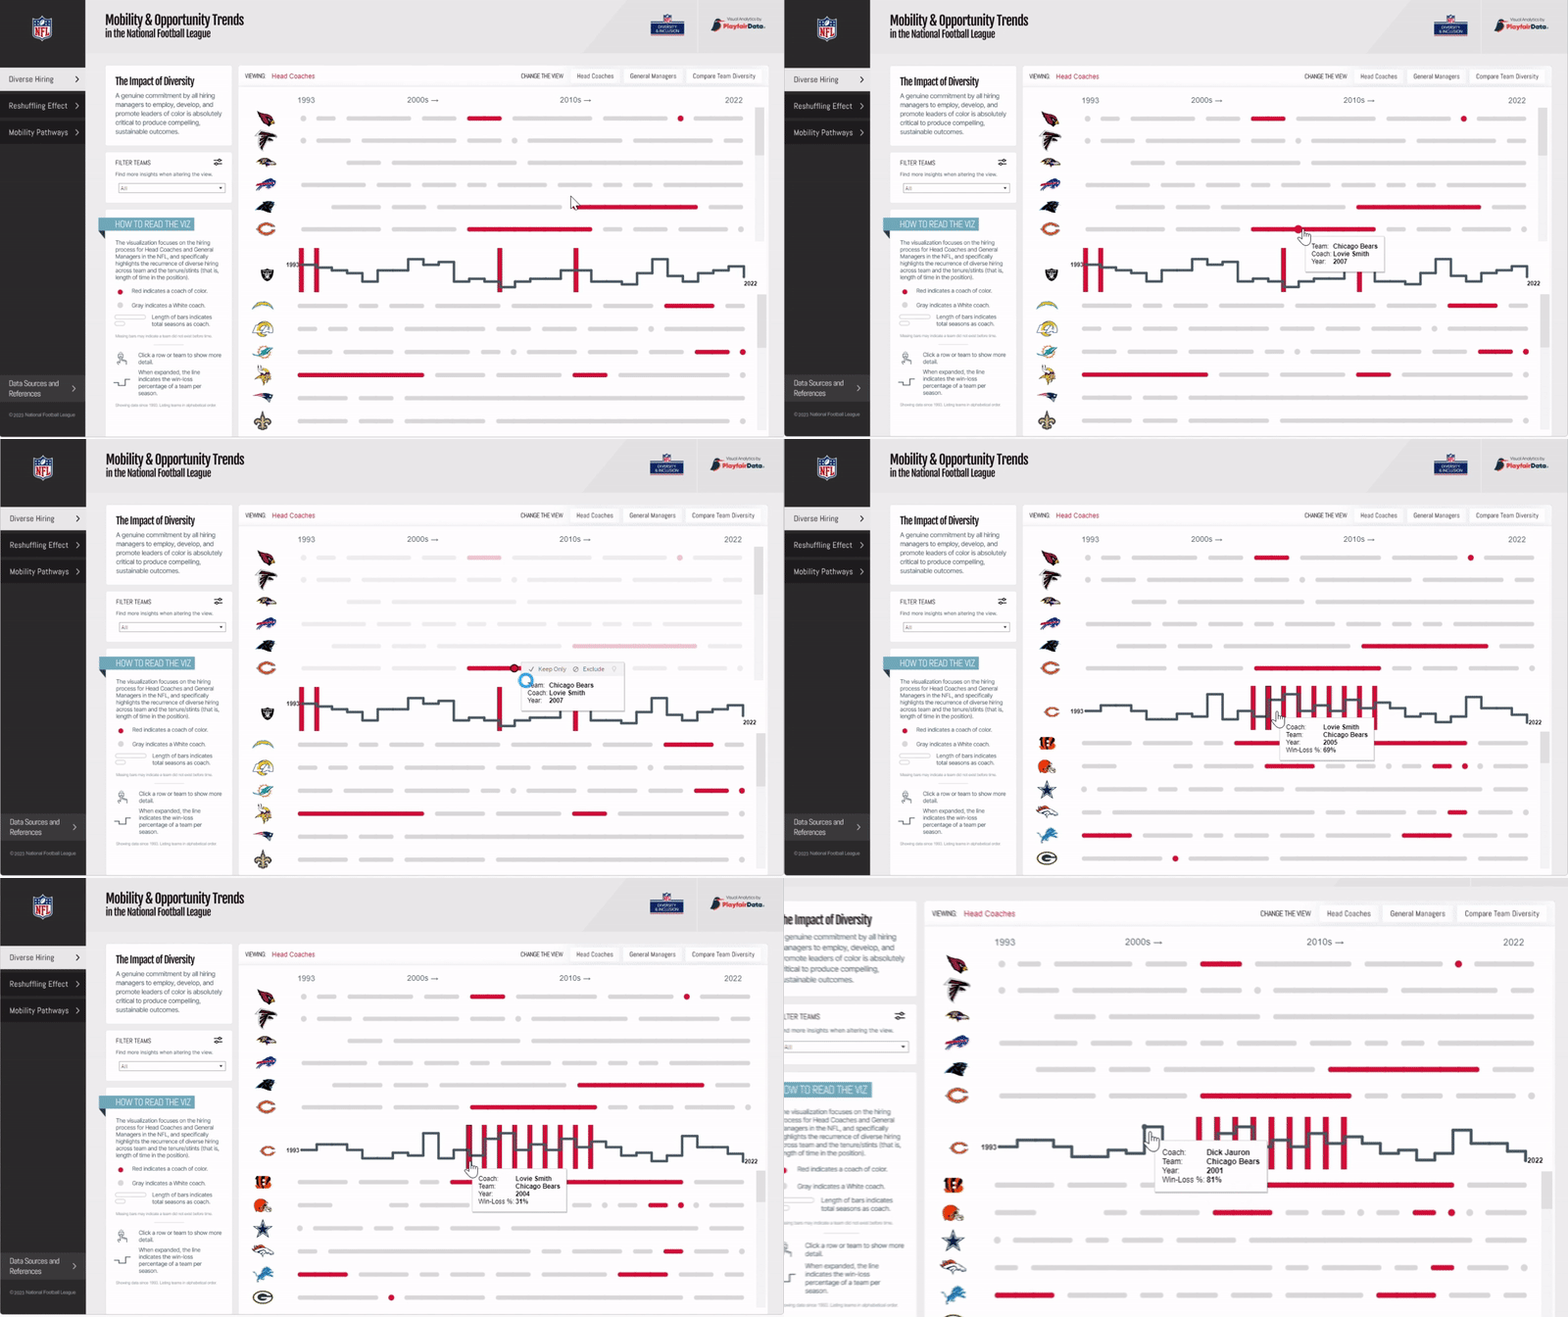
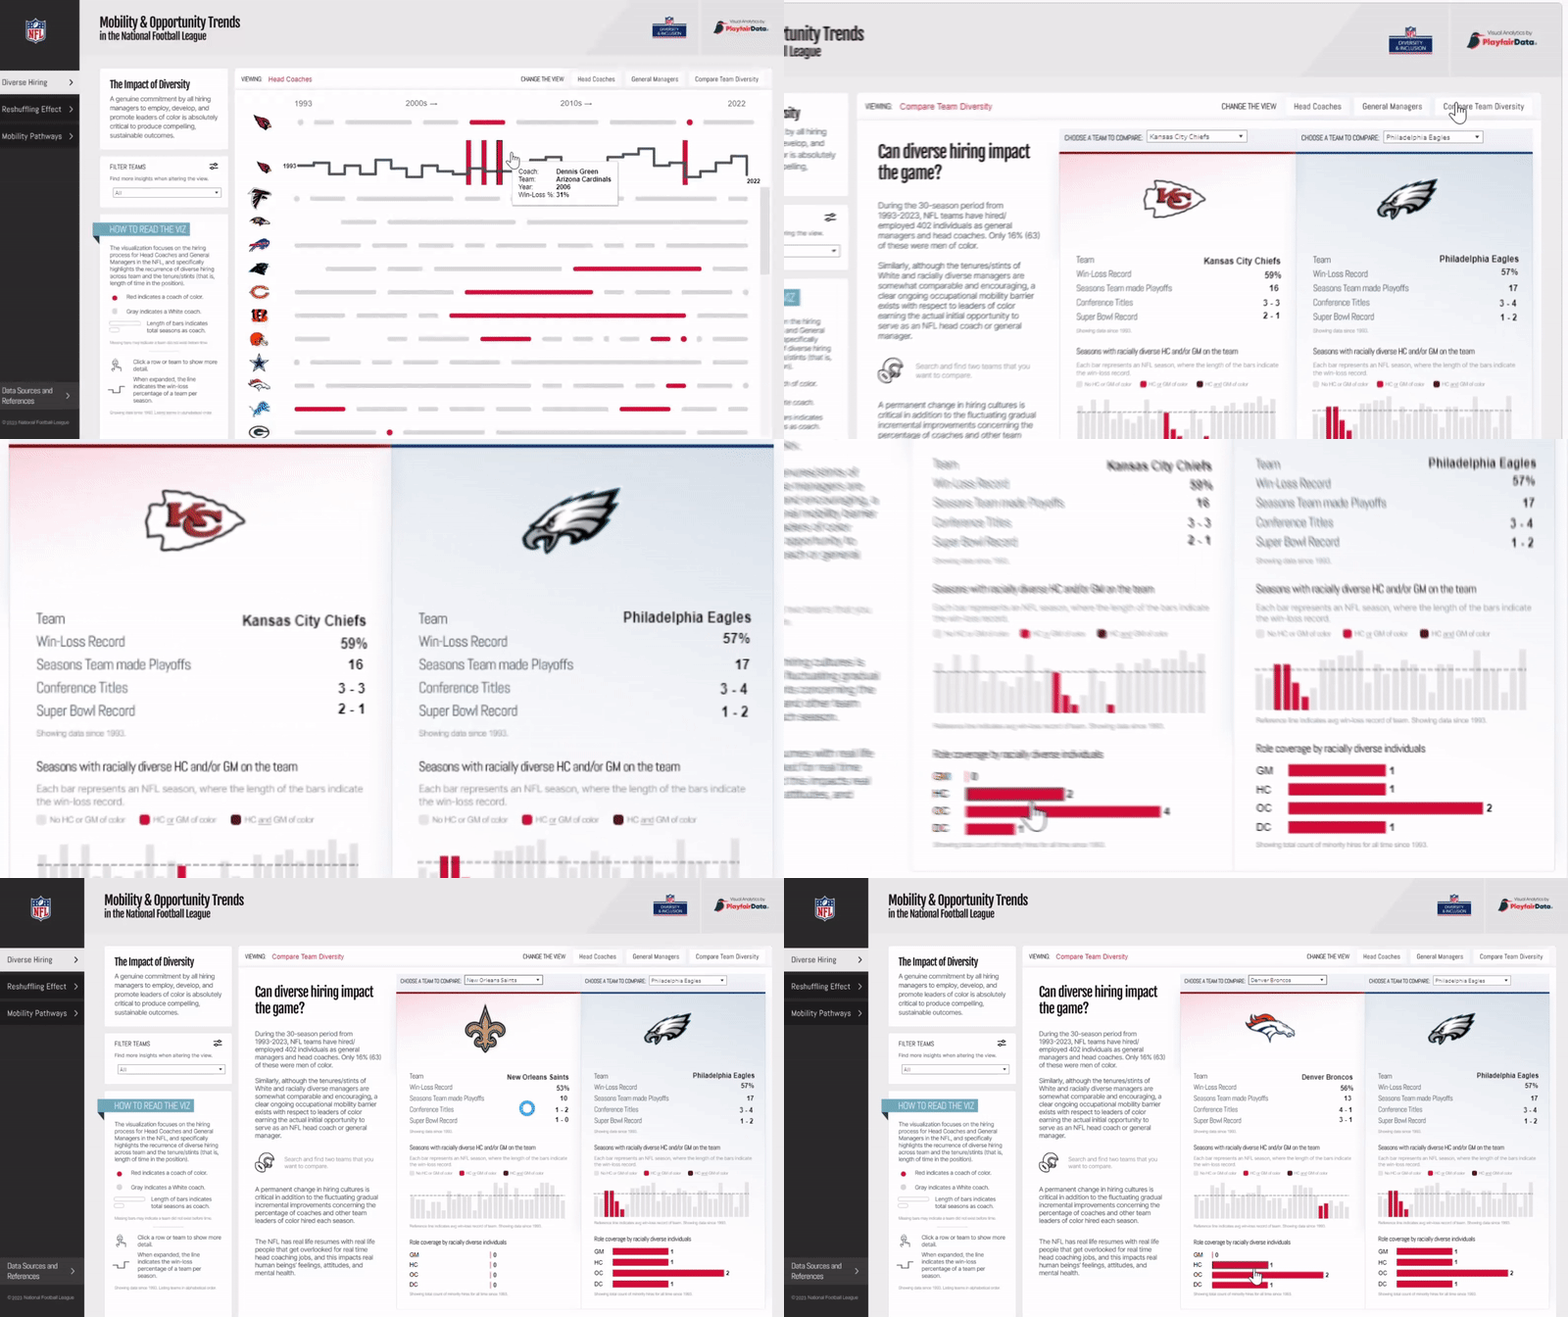
Just one week from the NFL draft, to be held in Kansas City, we’re excited to announce our involvement in the 2023 Diversity and Inclusion Report with an analysis of occupational mobility patterns within the NFL.
“Our purpose is to positively impact the world by improving how data is translated into valuable insight. Our latest project, in partnership with the NFL’s Diversity and Inclusion Report, is an excellent example of the game-changing insights we strive for when we receive a raw dataset. We are honored to have helped with such an important project.” says Playfair Data Founder and Principal, Ryan Sleeper.
The annual study, now in its 10th consecutive year, investigates potential occupational access barriers faced by racially diverse NFL coaches. In addition to analyzing head coaching positions, Principal Investigator & Lead Researcher, Dr. C. Keith Harrison, along with Researcher & Report Co-Author, Scott Bukstein, also examined occupational access barriers and mobility patterns for other key positions within NFL teams, such as general managers, offensive coordinators, defensive coordinators, and primary team position coaches.
Read more: NFL Release 2023 Diversity and Inclusion Report

A team effort
This series of visualizations is the product of a large cross-section of the Playfair Data team, including our award-winning data engineers, dashboard architects, and UX/UI designers. “We’ve had an amazing opportunity to use our skills to show the power of data and bring awareness to a very relevant topic in our society,” says Senior Visual Analytics Architect, Rafael Simancas. “We knew from the start how much visibility this tool would get and how important it is for the data to be universally understood, meaningful, and easy to use.”
“We realized that to attain a more holistic view of a coach’s career, we needed more data,” says Director of Analytics Engineering, Ethan Lang. Thanks to an “all-hands-on-deck” mindset, we brought in our team of decision scientists and data engineers to lead an effort to source more data from open sources to add not only breadth to the existing data, but a layer of depth not found in previous reports. Once we’d found the data we needed, Manager of Decision Science, Maddie Dierkes, utilized industry-leading programming techniques to quickly and effectively gather all the data together.
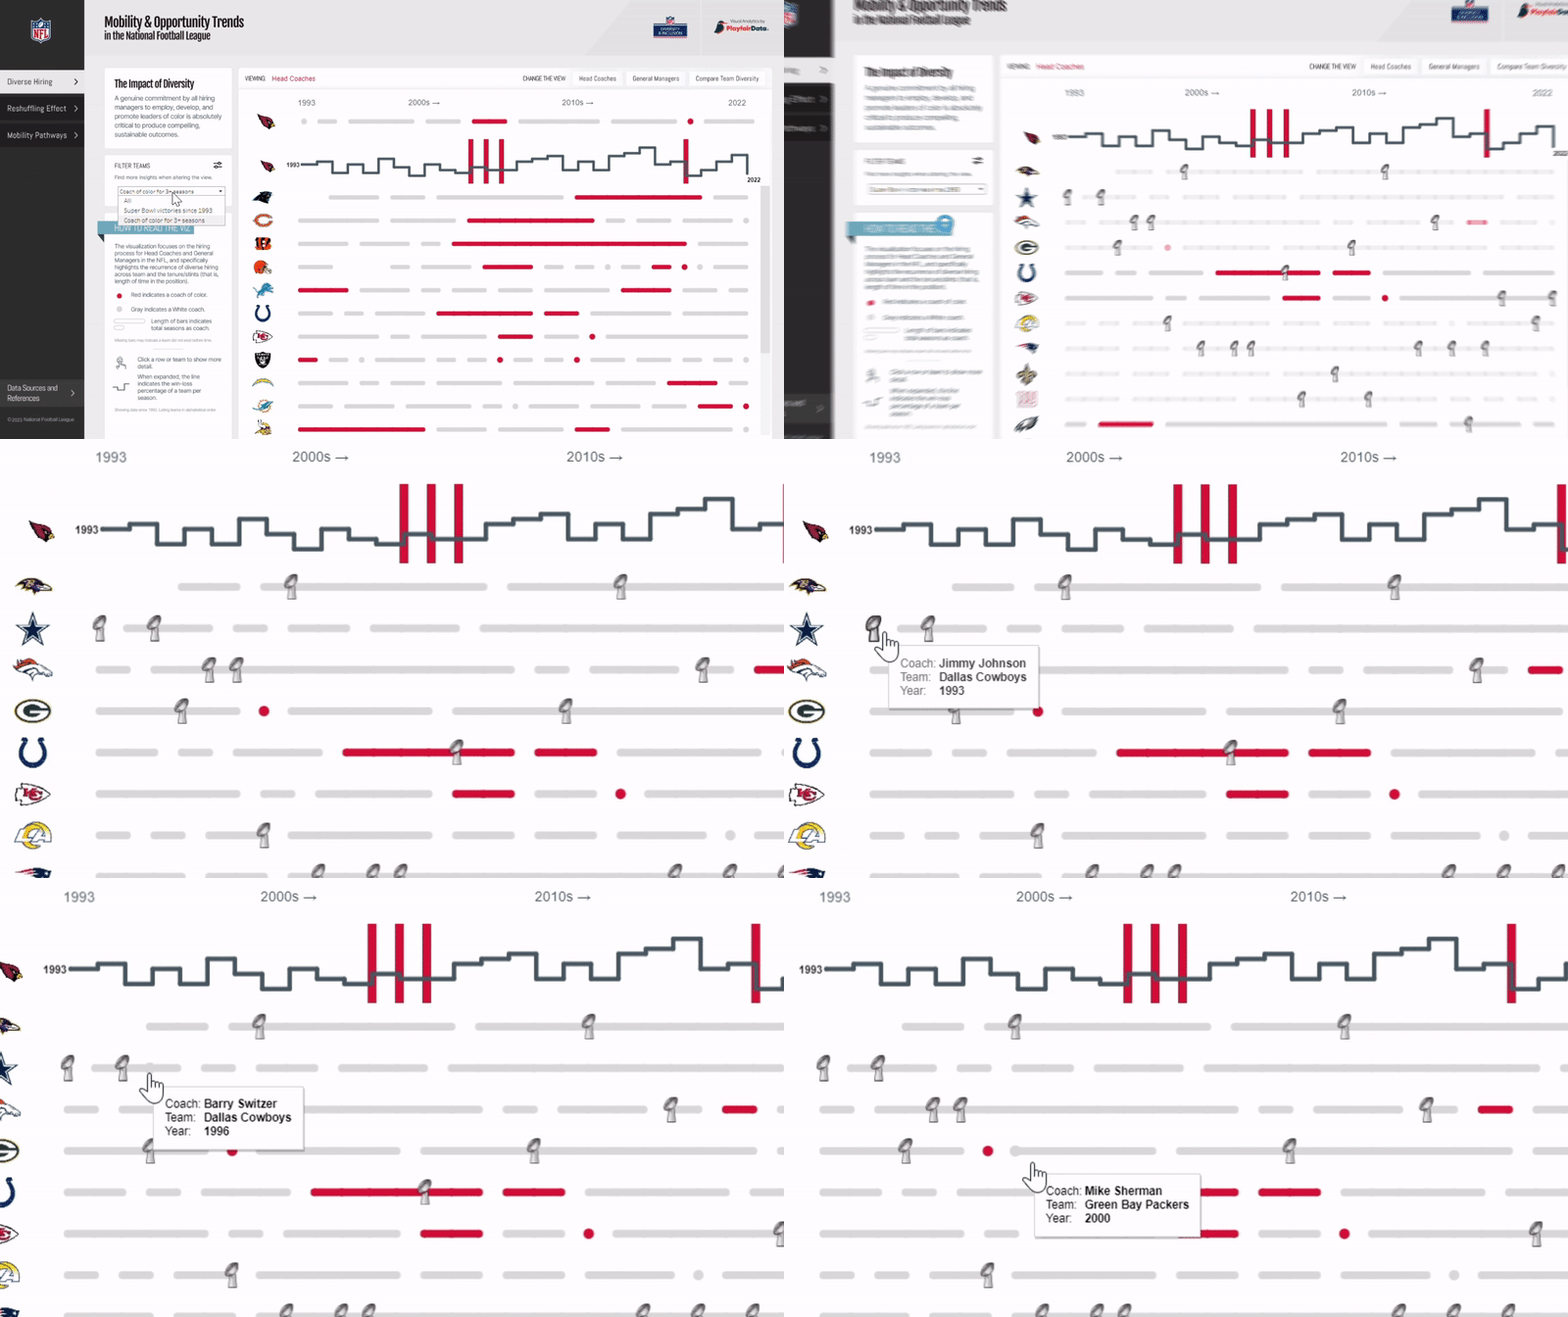
Once we obtained the raw data set, Senior Manager of Data Engineering, Ariana Cukier, consolidated it using Alteryx to provide our Tableau engineers the data they needed to begin building the product. After our team cleaned and engineered the data into the formats necessary, Visual Analytics Associate, Dan Bunker‘s extensive knowledge of Tableau led to several new innovations, including a brand new chart type. All of this while working closely with our partners to validate the data and call out any discrepancies we came across through visualization.

Regarding the project’s design, Senior Manager of Information Design, Alyssa Huff, added, “Working on a public-facing project was a fun prospect for us, since many of our visual analytics consultation projects are exclusively client-facing. It was exciting to know that not only is the report on such a meaningful topic, but also that it would be shared to a broad audience, which we took into account while doing the design work. We’re grateful to have been a part of visualizing this year’s report.”
Like many of our client projects, this year’s Diversity and Inclusion Coaching Mobility Report represents a team effort. Each of Playfair Data’s talented team members embodies innovation and award-winning expertise on their own, but together we are that much stronger. As our Founder, Ryan Sleeper, says, “That’s the value of working with us. You get an entire team dedicated to solving complex problems end-to-end.”
Partner with Playfair Data
At Playfair Data, we turn data into valuable insight. While the raw data of this report carries a powerful message and is game-changing in and of itself, we are honored to be a part of sharing this report in an approachable and accessible way. We hope these visualizations encourage growth and shared responsibility for the data found in this report. We are grateful to be involved in this project and look forward to similar opportunities in the future where we can further pursue our purpose of positively impacting the world by improving how data is translated into valuable insight.
If you’re wondering how Playfair Data can help your organization make a difference with data, it would be our pleasure to have a conversation about how we can support your data-related needs.
Related Content
Playfair Data Announces New Office in the Smart City of Lake Nona
From the heart of the country to the heart of innovation On the heels of our recent recognition by the…
Playfair Data Earns Recognitions for Excellence in Visual Analytics and Business Growth
Playfair Data is excited to announce four recognitions underscoring its excellence in the field of visual analytics and its business…
How to Do Advanced Dynamic Zone Visibility in Tableau
Released with version 2022.3, Dynamic Zone Visibility is a relatively new feature in Tableau. In a previous post, Playfair Data…
