Tableau Tip: How to Make Better Relative Date Filters
Have you ever needed to filter to the last 7 days, 30 days, 90 days, etcetera in Tableau? You’ve likely found that it’s easy to add a “relative” date filter by dragging a dimension with a data type of Date to the Filters Shelf, choosing Relative Date, then showing the filter to access the date range options. These default relative date filters are okay, but they have limitations including: (1) limited and static anchoring options, (2) no formatting options, and (3) they require manual range selection.
This post will show you how to make relative date filters in Tableau that overcome all the limitations of the default relative date filters. You will be able to set up any ranges you want and have one-click access to change date ranges on the fly.
This content is excerpted from my book, Innovative Tableau: 100 More Tips, Tutorials, and Strategies, published by O’Reilly Media Inc., 2020, ISBN: 978-1492075653. Get the book at Amazon.
How to Use Tableau Sets to Create Relative Date Filters
How to create flexible and user-friendly relative date filters in Tableau
The trick for creating relative date filters in Tableau that are flexible and more user-friendly than the defaults involves creating sets and customizing each range on the Condition tab of each set. The Condition tab within a set allows you to set up dynamic date ranges that automatically update. By the end of this post, I’ll also show you how to set up comparison date ranges and allow users to choose which date range is being used.
![]()
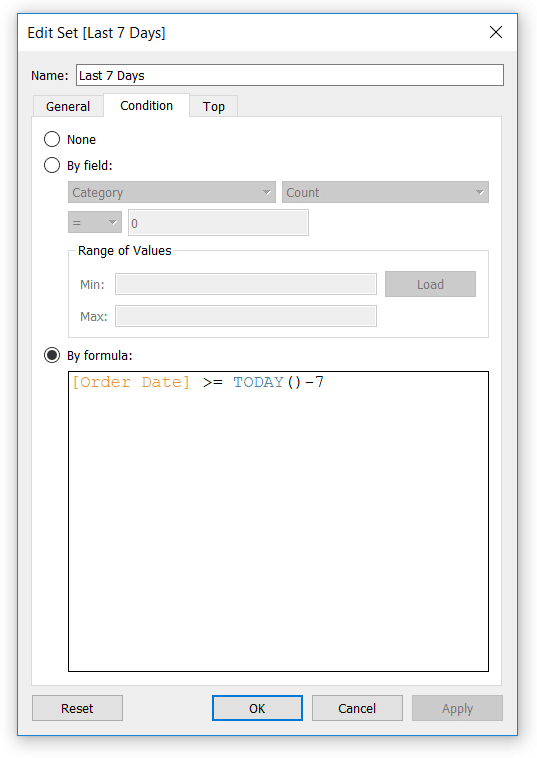
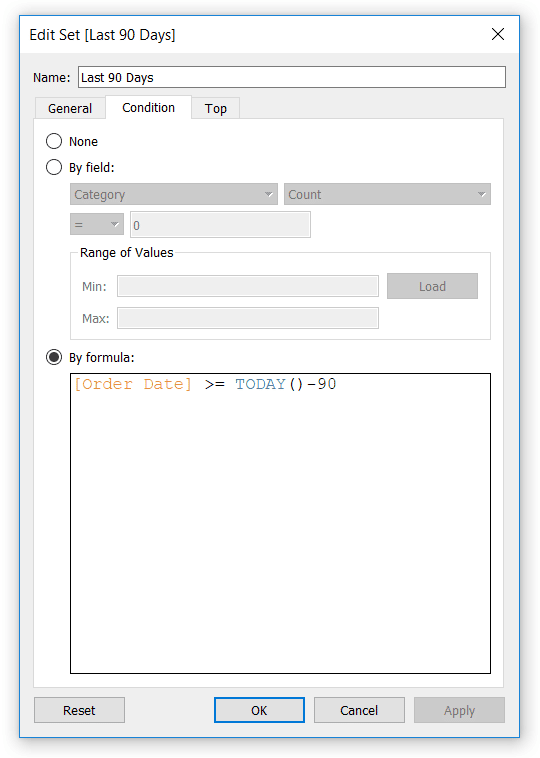
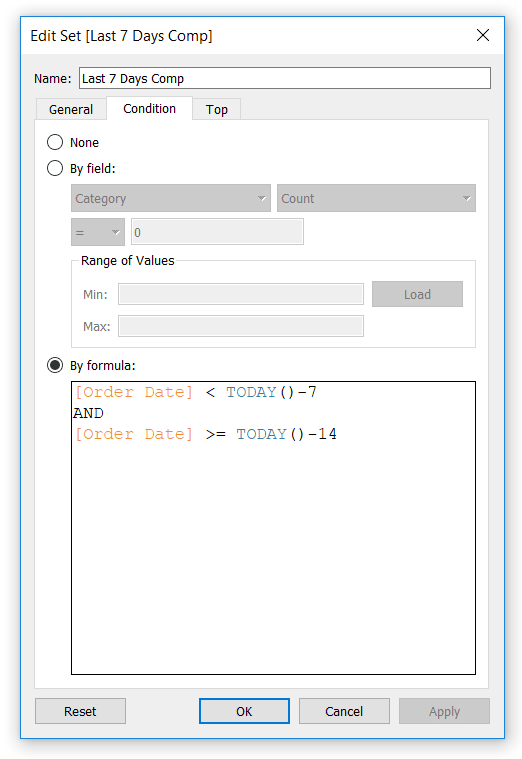
Let’s say I am writing this tutorial on July 14, 2019 and our first relative date range will be the last full seven days. Assuming our dataset only updates once per day overnight (so our newest date is 7/13/2019), the condition would be dates greater than or equal to today minus seven days.
An Introduction to Tableau Sets
Continue reading with a free account, or login.
Unlock this tutorial and hundreds of other free visual analytics resources from our expert team.
Already have an account? Sign In
By continuing, you agree to our Terms of Use and Privacy Policy.
To create this set of dates, right-click on your date field on the Dimensions area of the Data pane, hover over “Create”, click “Set…”, and navigate to the Condition tab. Here’s how the settings look for this first range using the Order Date field in the Sample – Superstore dataset (which I updated to have 2019 dates).
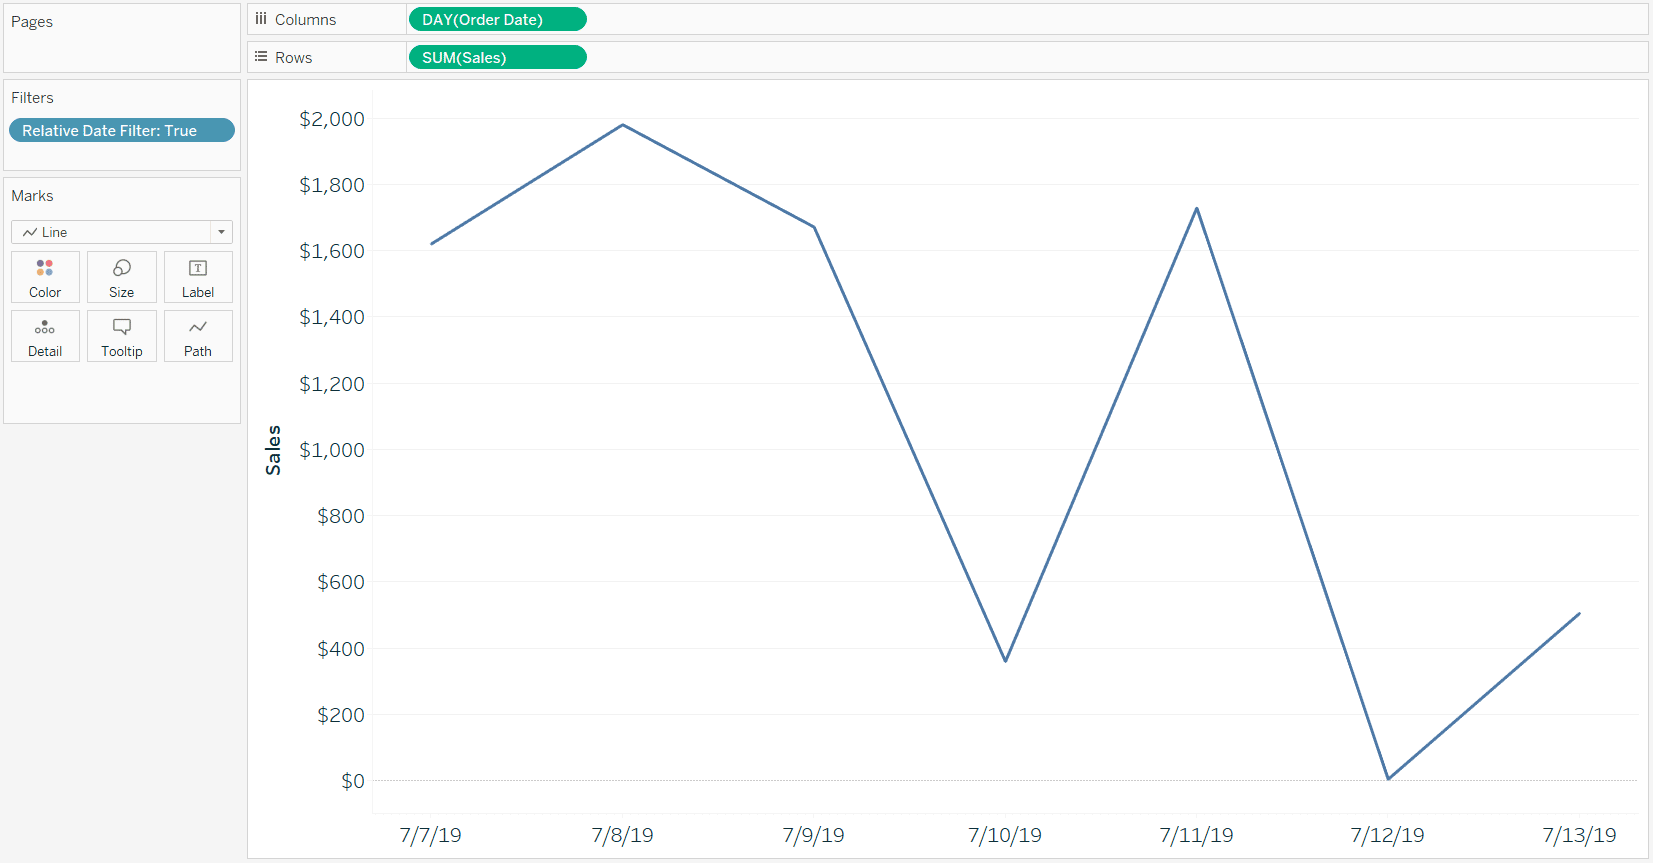
I’ll quality check that the correct date range is being computed by creating a sheet with continuous Day of Order Date on the Columns Shelf and the newly created Last 7 Days set on the Filters Shelf. Sets are Boolean, so each Order Date is either in the set or not, and when a set is placed on the Filters Shelf, the default behavior is for Tableau to only display the dimension members in the set.
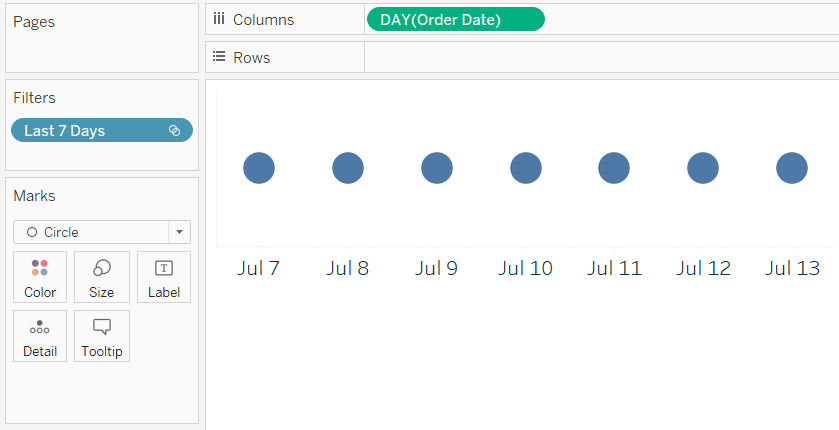
So far so good – we’ve got seven days in the range, and they’re the last seven days we’ve got data.
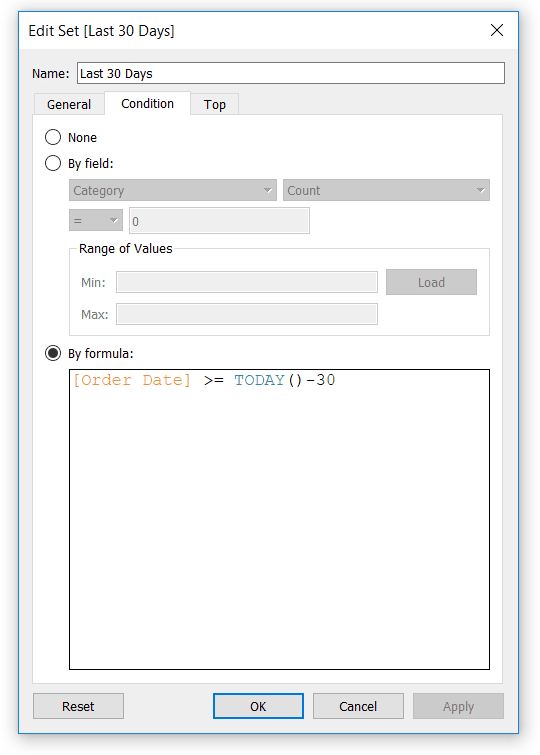
This type of relative date range we created using the Condition tab of a set can be used for any range of dates. To finish the illustration, I’ll create two additional relative date sets; one for the last 30 days and one for the last 90 days.
Relative Date Set Keeping the Last 30 Days
Relative Date Set Keeping the Last 90 Days
How to allow users to select the relative date range
Now that we have our relative date range options set up, we can allow users to decide which set is filtering the dates on the view. This works the same way as the classic Tableau tactic of allowing users to choose which dimensions and measures are being used in a view.
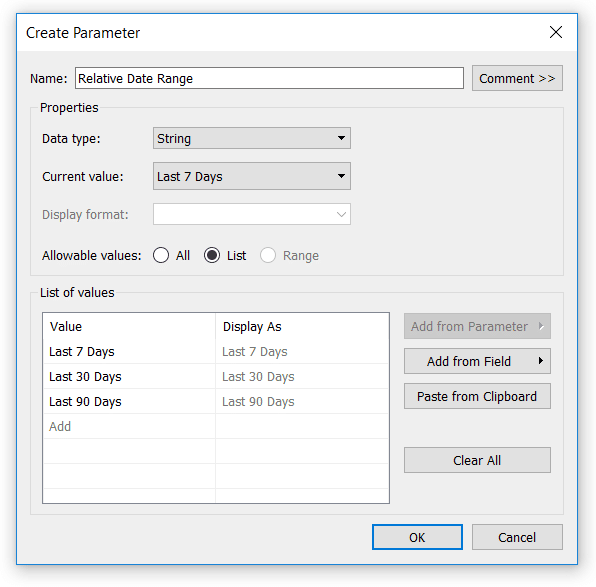
First, create a parameter with a data type of String and your list of options.
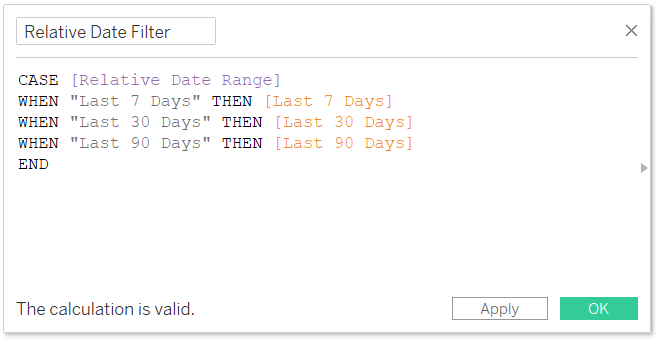
Next, create a calculated field using CASE / WHEN logic to tell Tableau which set to use when each value within the parameter is selected. Note that the outcomes on each line are the sets created during the previous section of this post.
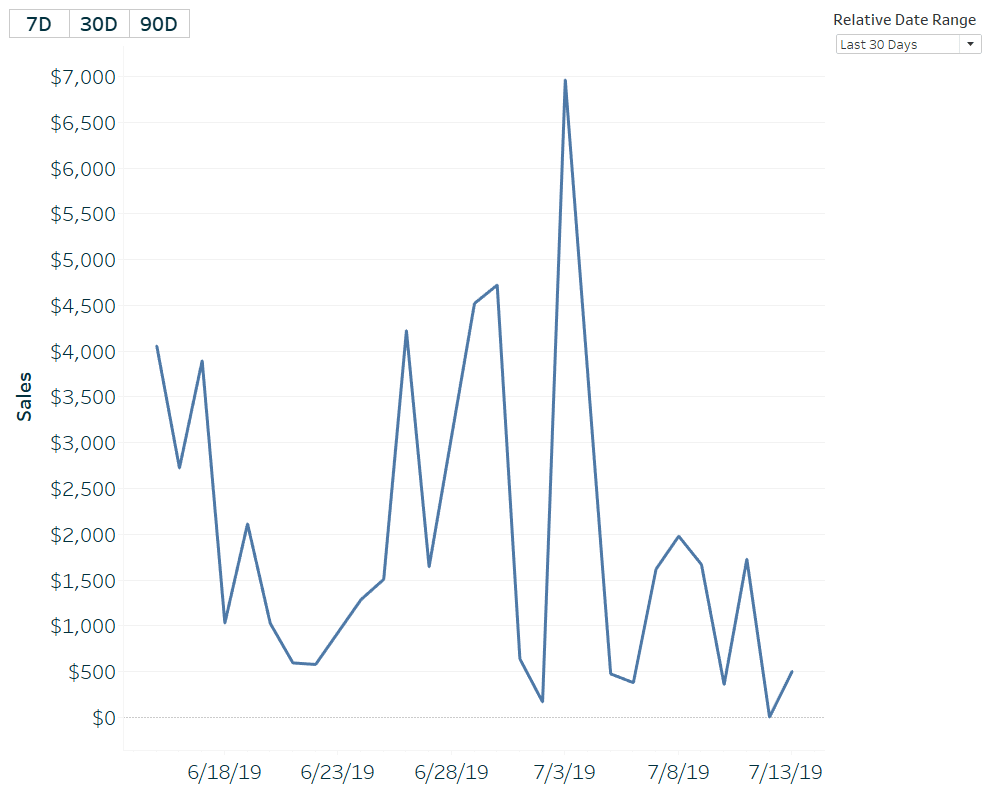
Let’s try this newly created filter out on this Sales by Day line graph built with Sample – Superstore data.
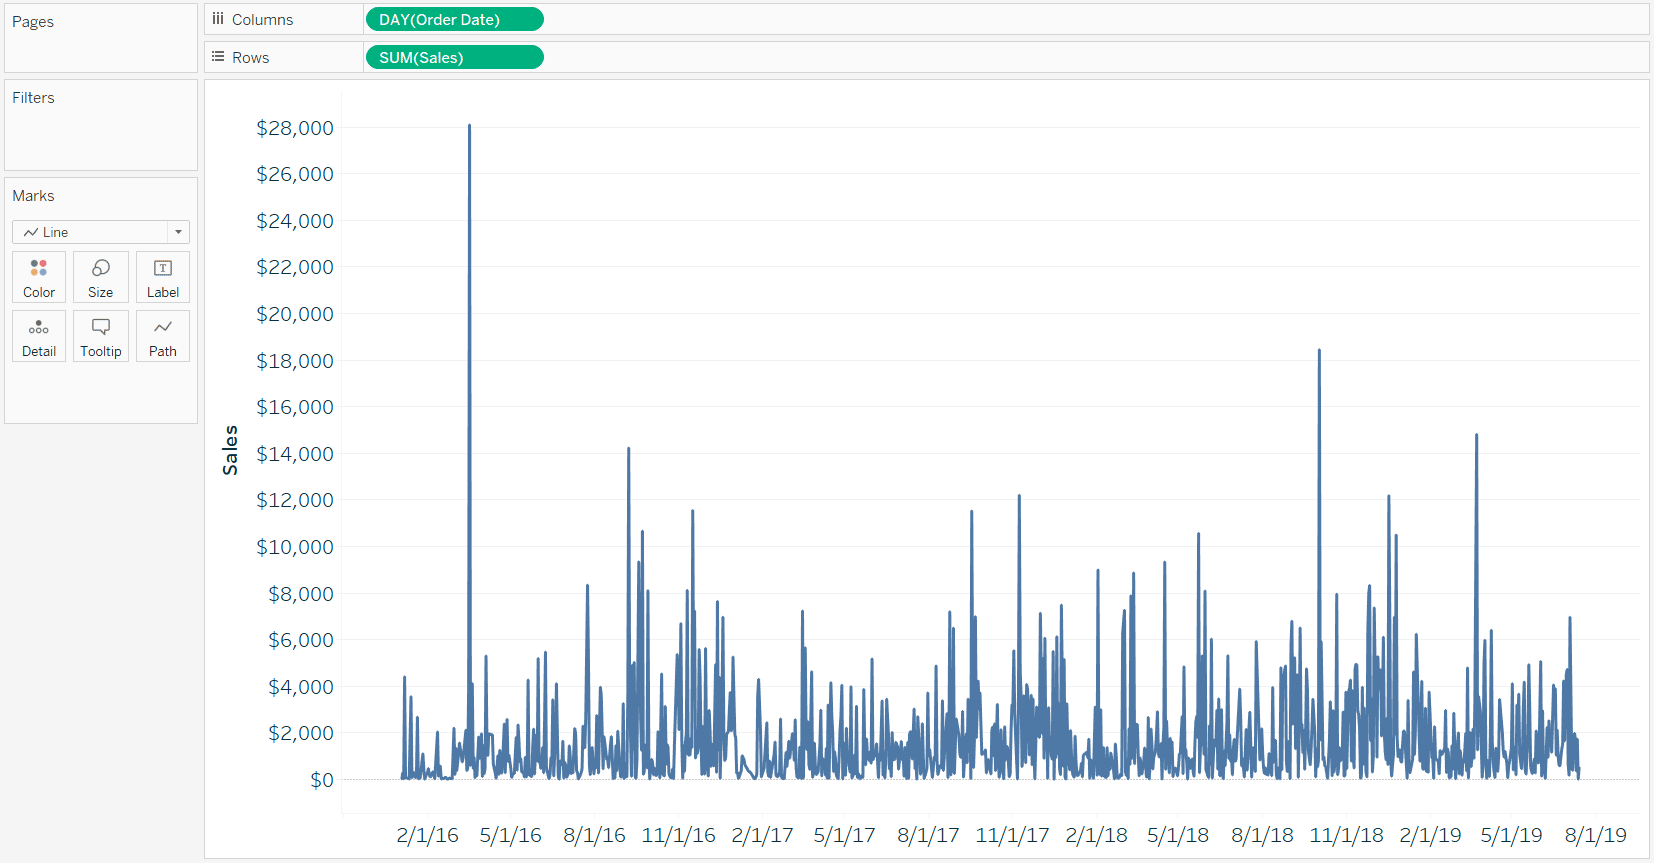
The three and a half years of daily data are making this view very challenging to analyze. If I place the Relative Date Filter calculated field on the Filters Shelf and choose “True”, we will see only the last seven days kept on the view. This is because the current value of the parameter that is feeding the calculated field is “Last 7 Days”, and when that is the selection, we are filtering on the Last 7 Days set.
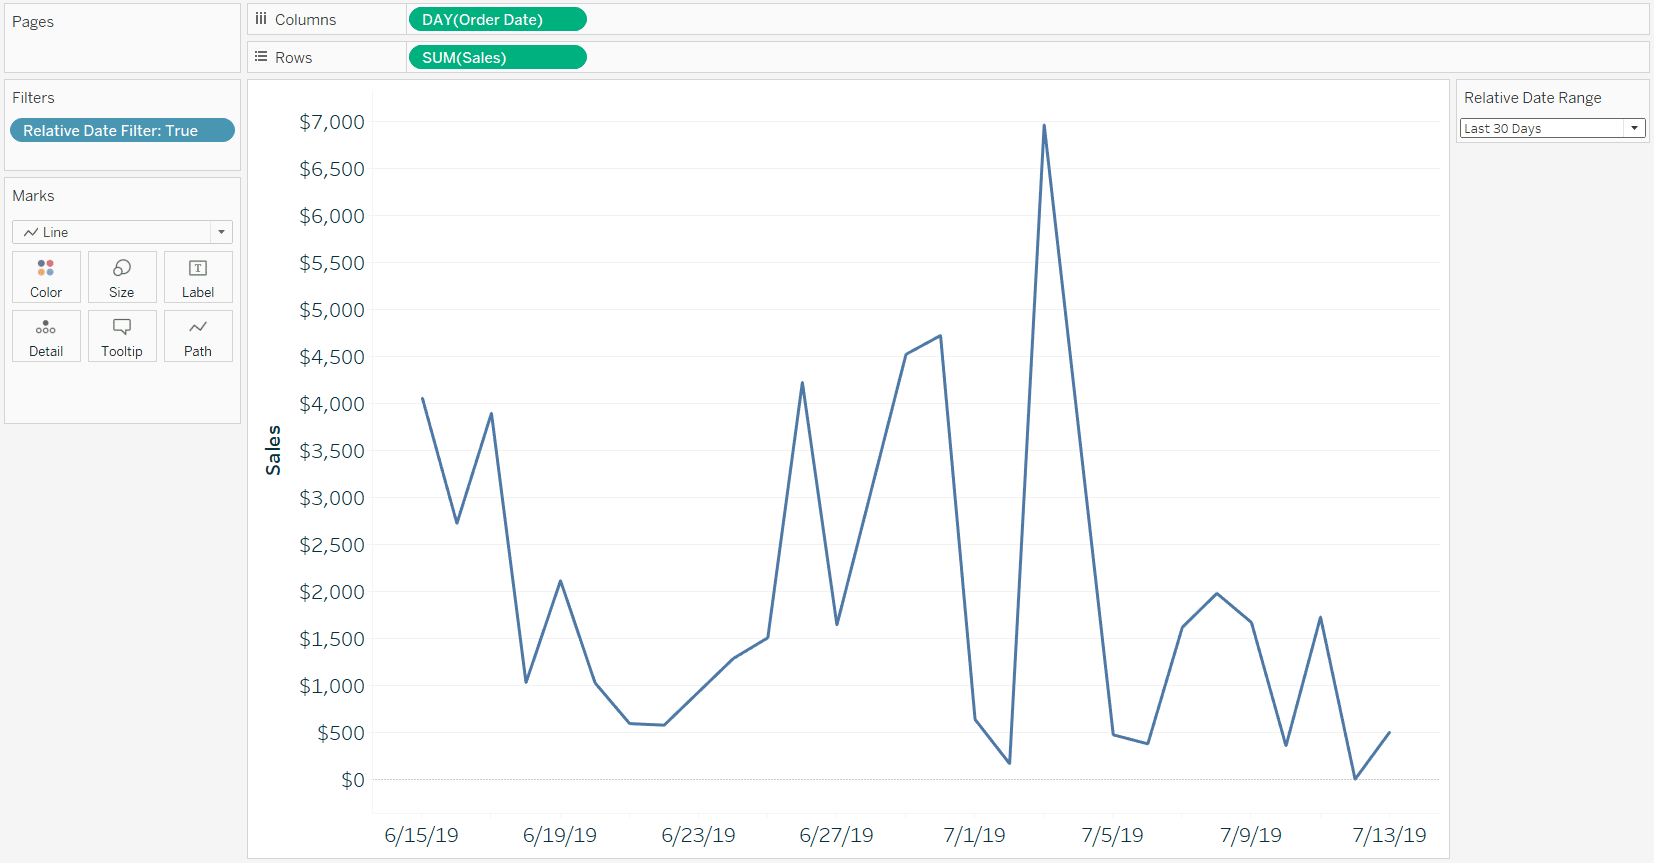
If I show the parameter control for the Relative Date Range parameter – which you can do by right-clicking on the parameter and selecting “Show Parameter Control” – the user can choose Last 7 Days, Last 30 Days, or Last 90 Days. Here’s how the view looks after updating it to Last 30 Days.
Improve the UX with parameter actions
Since we are using a parameter to filter on our relative date sets, we can use parameter actions to allow our user to change the relative date range with the click of a button!
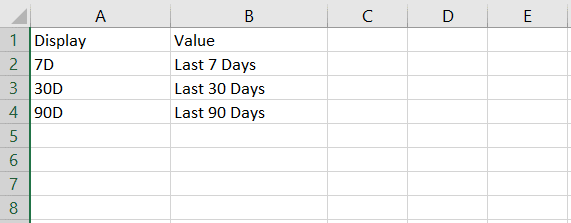
First, set up an Excel file with your list of choices. The important thing about these types of data sources that are used to create control sheets is that the Value field must be spelled the same as the values in the parameter. The Display field can be whatever text you want displayed on your navigation.
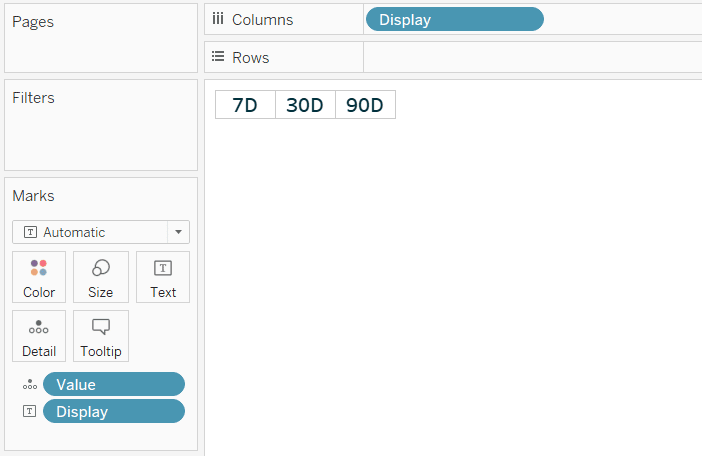
Next, connect to this Excel data source and create a text sheet that will act as our navigation. You can format this however you would like, but the Value field must be somewhere on the view for this to work during the last step.
Place both the control sheet and the chart(s) containing your relative date filter on a dashboard.
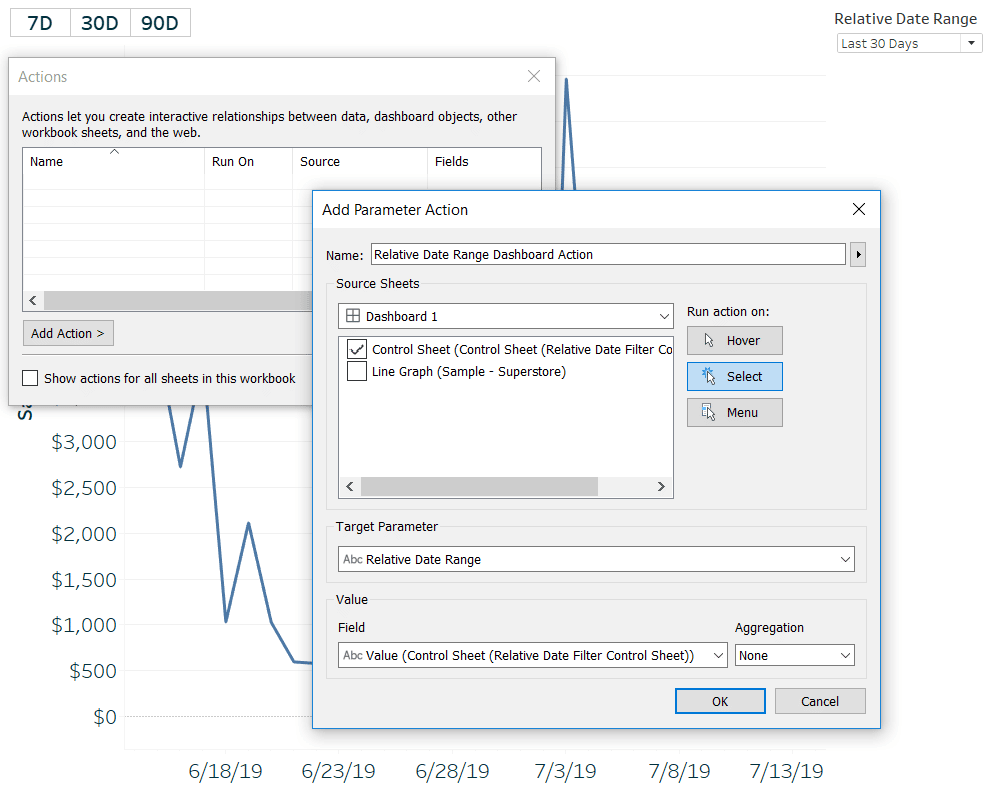
Lastly, create a parameter dashboard action by navigating to Dashboard > Actions… in the top navigation. You will need to add a “Change Parameter…” dashboard action. Here’s how my settings look if I want the selection on the control sheet to populate the allowable value of the Relative Date Range parameter that is filtering the line graph.
After accepting these settings, just clicking on one of the three relative date range options will filter the line graph! Here’s how it looks after clicking on the 90D button.
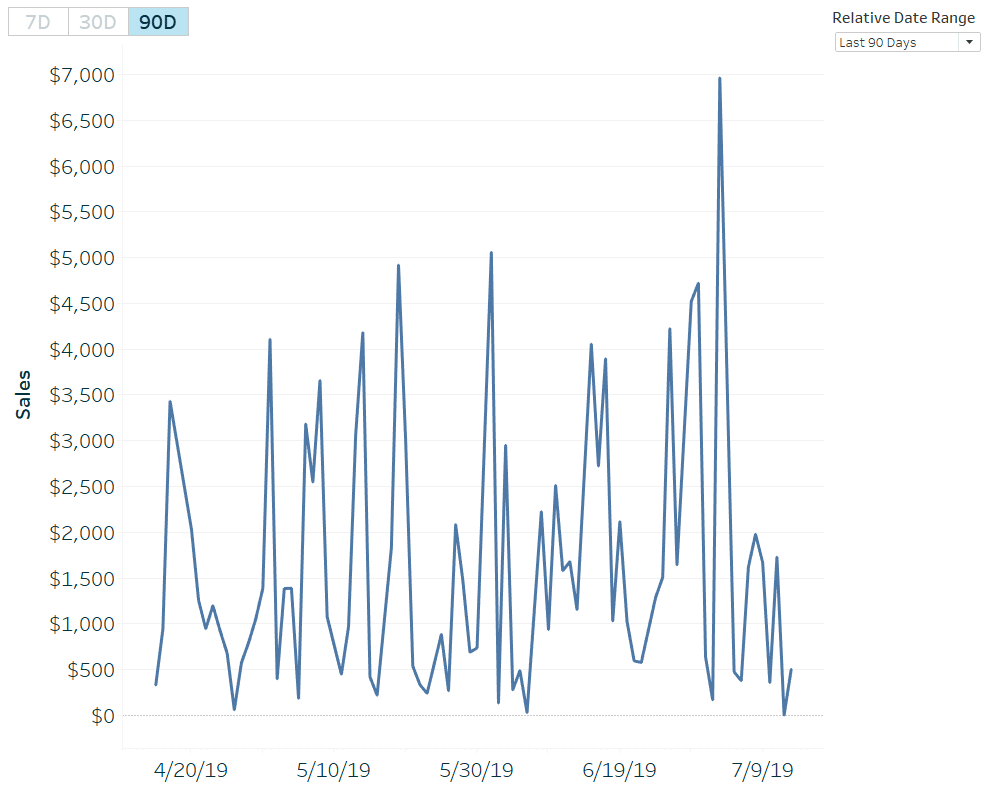
Notice that the parameter action overwrote the allowable value in the parameter control. We no longer need the parameter control at all because the selection is now being controlled by the text sheet.
How to Use Control Sheets for Better Parameter Actions
Other applications
These relative date filters can also be set up for comparison periods. For example, if you wanted to create a set of dates for the seven days immediately preceding our Last 7 Days set, the condition would be:
If you were to create a calculated field tied to the Relative Date Range parameter like we did in the Relative Date Filter calculated field above, the current value of the parameter would instantly filter both your current relative date ranges and their respective comparison ranges. These comparisons can be used to create one of my favorite dashboard elements, the current versus comparison index callout.
One more thought on how these improved relative date filters can be used. The code shared throughout this post uses today’s date as the anchor. The TODAY() function will dynamically update the values in the set based on the current date. However, you can also use the DATE function to hardcode or even parameterize the anchor.
![]()
Let’s say you wanted to analyze the performance leading up to Christmas Day. The condition for the relative seven days set would be:
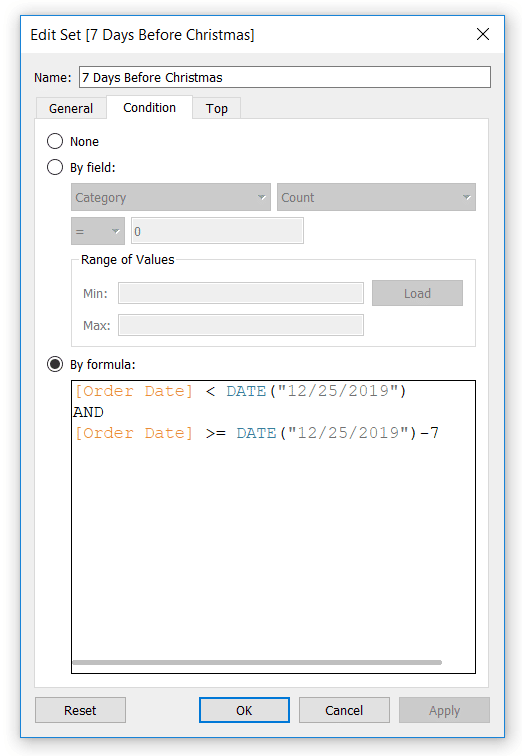
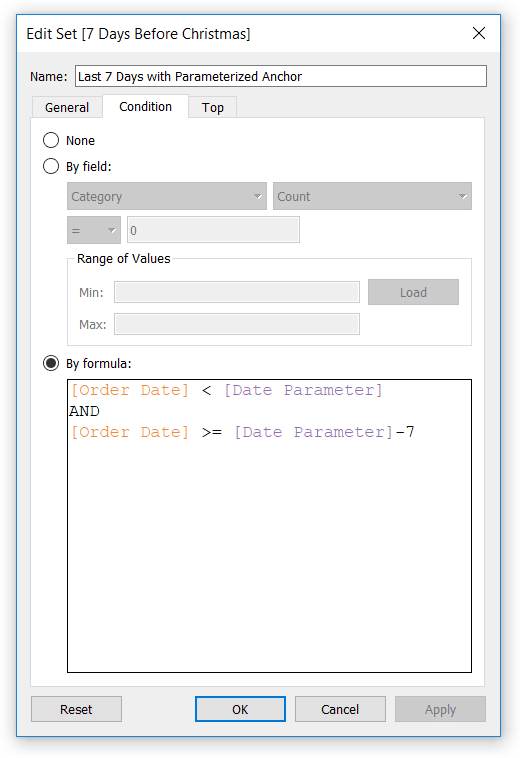
You could also replace DATE(“12/25/2019”) in this example with a date parameter that allows the user to choose any anchor they want!
Thanks for reading,
– Ryan


Written By
Ryan Sleeper
Related Content
The Definitive Guide to Tableau Sets

In this post you will learn how to: (1) create static Tableau sets, (2) create dynamic sets, (3) use sets…
How to do Dynamic Date Selections in Tableau

In a lot of business cases, you are doing analysis based on common units of time such as: weeks, months,…

Ryan Sleeper
Get more from your line graphs with this advanced tactic for equalizing dates Dates are tricky to work with in…