Toggle Visuals With Bookmarks in Power BI

Bringing a Power BI report to life through interactivity is a great way to improve a report’s user experience. What better way to do so than to use bookmarks to dynamically show or hide elements on a report page? Introducing interactivity in your reports isn’t the only benefit of using bookmarks to toggle visuals – using bookmarks can also improve how a user digests the information in your reports by only showing the necessary components.
When you have a report page with multiple tables and visuals that display different information, it can be difficult to decide which ones need to go. Using the power of bookmarks, you don’t have to remove any of them! Bookmarks allow you to quickly improve a report’s look and feel without sacrificing any important visuals. By the end of this tutorial, you will be able to create interactive, user-friendly reports that use bookmarks to dynamically change the information on your report pages.
Bookmarks: Background info
Bookmarks in Power BI are used to save the current state of your report. Think of a bookmark in Power BI like a screenshot. When you add a bookmark, you save the current state of a report including elements like visuals, filters, and slicer settings. There are two types of bookmarks available in Power BI: report bookmarks and personal bookmarks. Report bookmarks save a report’s state for all users and are available in Power BI Desktop and the Power BI service. Personal bookmarks allow you to save a report’s state for yourself. They are exclusive to the Power BI service. Report bookmarks are saved with the report itself when it is distributed, but personal bookmarks are not. This tutorial will focus on report bookmarks in Power BI Desktop.
Continue reading with a free account, or login.
Unlock this tutorial and hundreds of other free visual analytics resources from our expert team.
Already have an account? Sign In
By continuing, you agree to our Terms of Use and Privacy Policy.
Fortunately, the functionality of bookmarks is pretty straightforward. You filter the data on a report page and click ‘Add’ in the Bookmarks pane to save the filtered state on your report page. It’s as simple as that. While this functionality may seem like that’s all bookmarks can do, the true power of bookmarks in Power BI Desktop comes from using them in combination with the Selection pane. With the Selection pane, you’re able to customize bookmarks and quickly toggle between them – providing an interactive experience for your report users.
Knowing your way around the bookmark settings is essential for optimizing your bookmarks because the standard settings aren’t useful in every situation. I’ll explain the settings below.
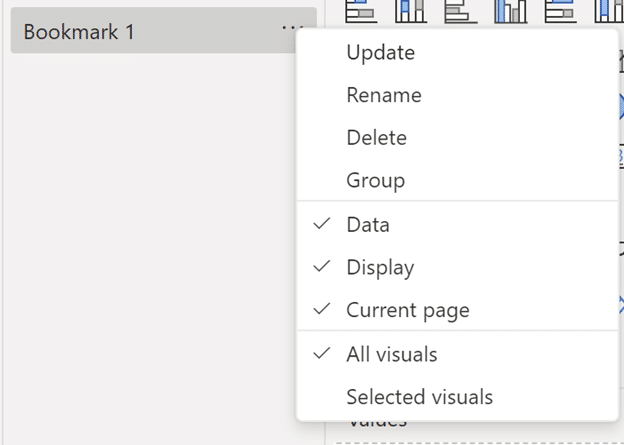
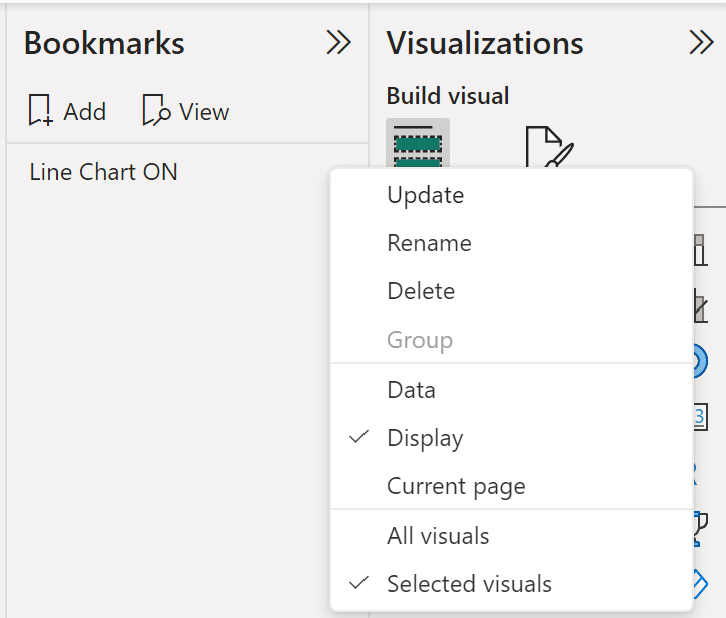
The above image shows the default bookmark settings. I’ll go through them one by one.
- Data includes filters and slicer selections, so if a report page has a few different filters and slicers set, their state will be saved.
- Display has to do with a page or visual’s visibility. Visibility settings, such as the ability to spotlight a visual, are captured with Display.
- The Current page setting saves the page that was visible when the bookmark was created.
- The All visuals setting includes all visuals on the page when the bookmark is created, while the Selected visuals setting includes only visuals selected in the Selection pane. For maximum interactivity and minimizing page and report load speeds, The Selected visuals setting is usually recommended.

I’ll use this background information to add bookmarks to an existing Power BI report to improve user experience. This tutorial builds off of Nested Parameters in Power BI Desktop. I suggest reading it first and downloading the AdventureWorks dataset it uses to construct the report yourself. To jump right into where I am in this tutorial, please download the .pbix file.
Layering a column chart visual in Power BI Desktop
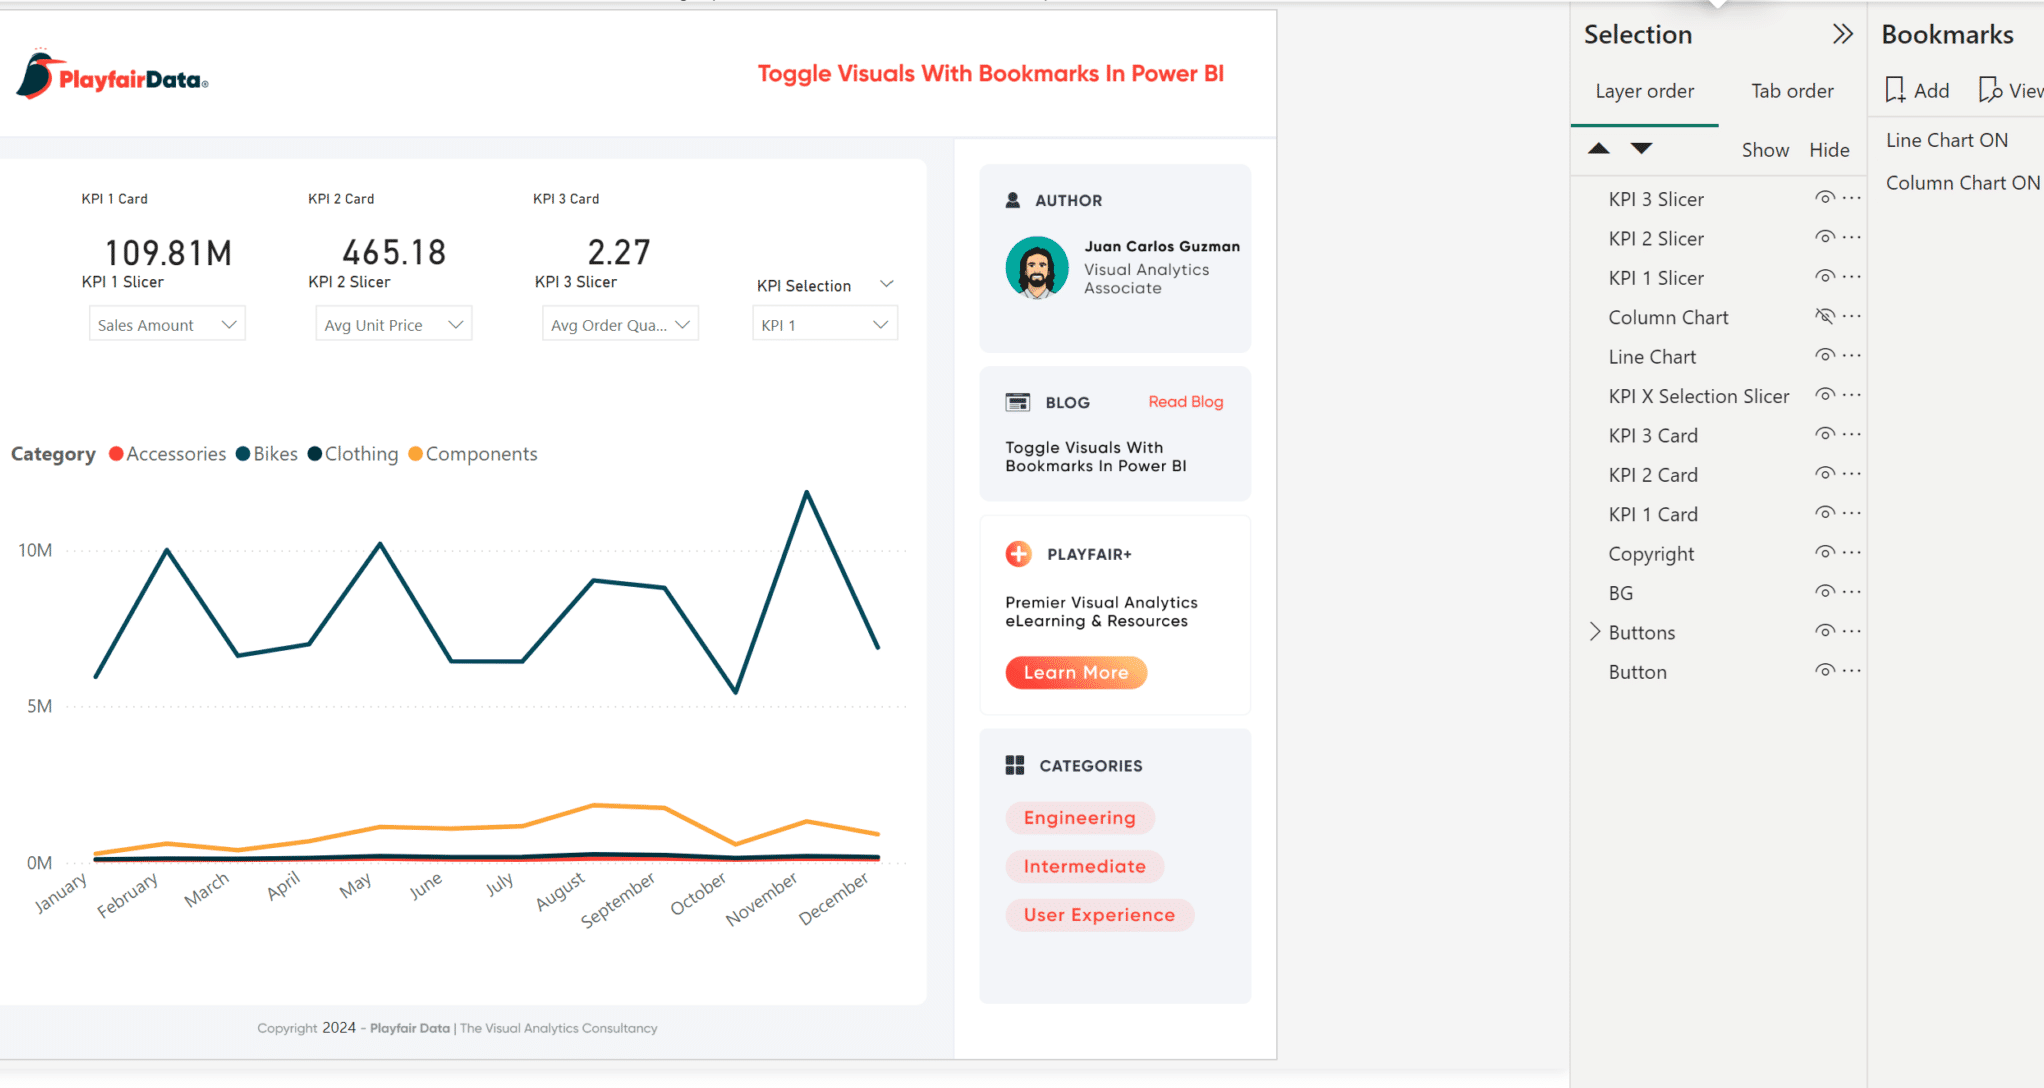
First, add a stacked column chart visual to the current report page. In the Visualizations pane, select the stacked column chart visual to add it to the report page. Then, add Country from the SalesTerritory table to the x-Axis and the KPI X Selection measure to the y-Axis. Now add Category from the Products table to the Legend. Now click on Format visual → General → Properties → Size and Position to match the current line chart visual exactly. You want to layer it right on top of the line chart.
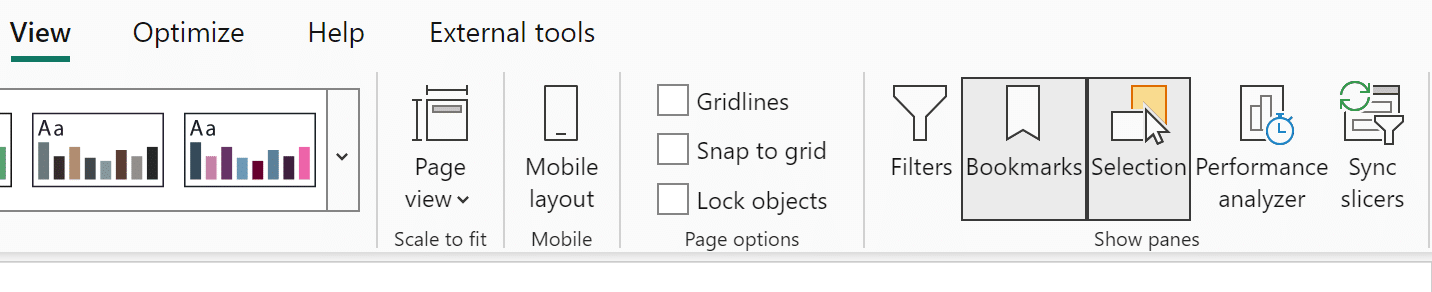
Once you complete the above steps, you should not be able to see the line chart visualization. The stacked column chart visual should be the same height and width as the line chart visual, and it should be placed at the same horizontal and vertical position. Now, from the View ribbon, click on Bookmarks and Selection to open up the Bookmarks and Selection panes. These two panes are the foundation of how to toggle visuals with bookmarks in Power BI.
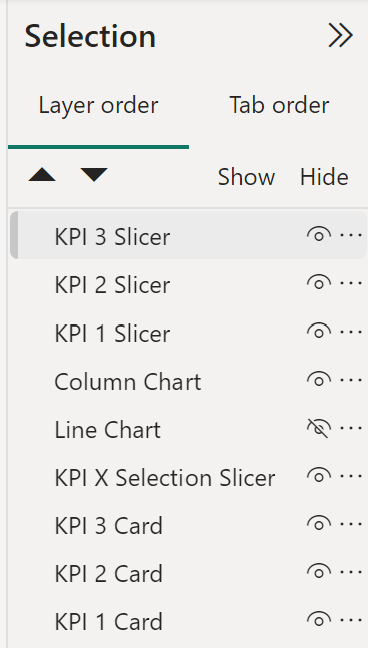
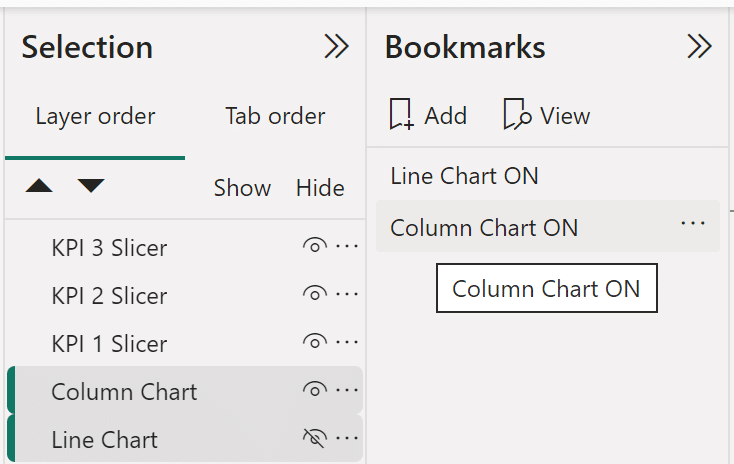
In the Selection pane, the elements on a report page are named generally as Slicer, Text Box, image, etc. The name for each visual in the Selection pane matches the visual’s individual title. You can change a visual’s title in the Format visual pane, and this title change will automatically reflect in the Selection pane. If you don’t change a visual’s title, the default title will describe the visual with the measures and columns included in it. Without clicking on a visual on the report page, it’s impossible to tell which visual is which.
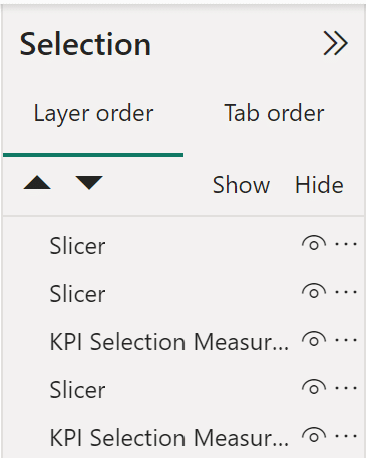
Since the Column and Line chart visuals have very similar titles, I recommend renaming them for clarity. Double-click the name of the visual in the selection pane to change it. While in the Selection pane, I’ll also rename the slicers, KPI cards, and title text box. In a complicated report with multiple text boxes, images, shapes, or other elements, it’s best to create a naming convention, or at least be more descriptive with the naming of these elements in the Selection pane to stay organized.
Creating report bookmarks in Power BI Desktop
Now that I’ve organized myself in the Selection pane, I can begin creating bookmarks. Open up the Bookmarks pane from the View ribbon. I want to toggle the report page between the column and line charts. To do so, I need two bookmarks, one for each visual. Click ‘Add’ to create the first bookmark. Next, click on the three dots for this first bookmark to change the bookmark settings. The only settings I want to check are Display and Selected visuals. I’ll rename this bookmark to “Line Chart ON”. Click on the eye icon for the column chart in the Selection pane to hide it. Since the only two items being toggled on this report page are the column and line visuals, I need to Ctrl+Click the line and column charts in the Selection pane.
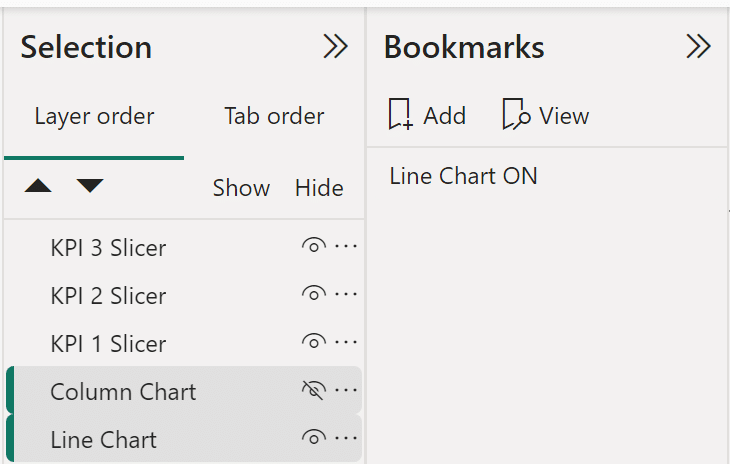
If you Ctrl+Click before hiding the column chart, make sure to Ctrl+Click the column chart again, since hiding it can remove it from your current Ctrl+Click selection. The last step in creating a bookmark is to update the bookmark. With the two chart visuals selected, click back on the elipsis in the “Line Chart ON” bookmark, and click ‘Update’.
To create the second bookmark, repeat the above process. I’ll call this one “Column Chart ON”. The only difference here is that I will hide the line chart visual in the Selection pane instead of the column chart visual.
Click ‘Update’ to save the second bookmark. Now you can toggle between the two bookmarks and watch your report page update. In practice, you can be as creative as you want with bookmarks, showing and hiding multiple elements at a time.
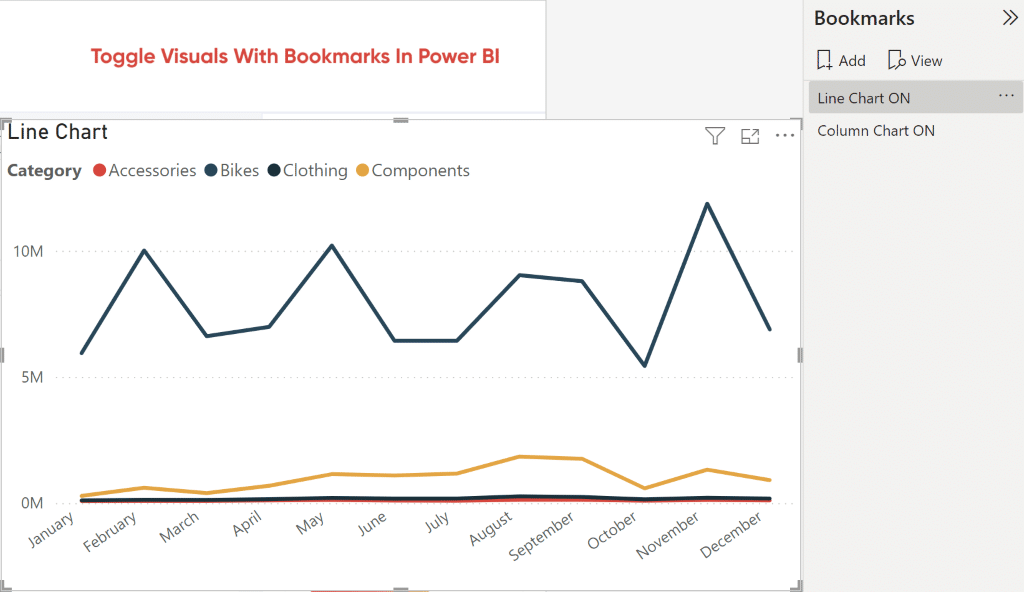
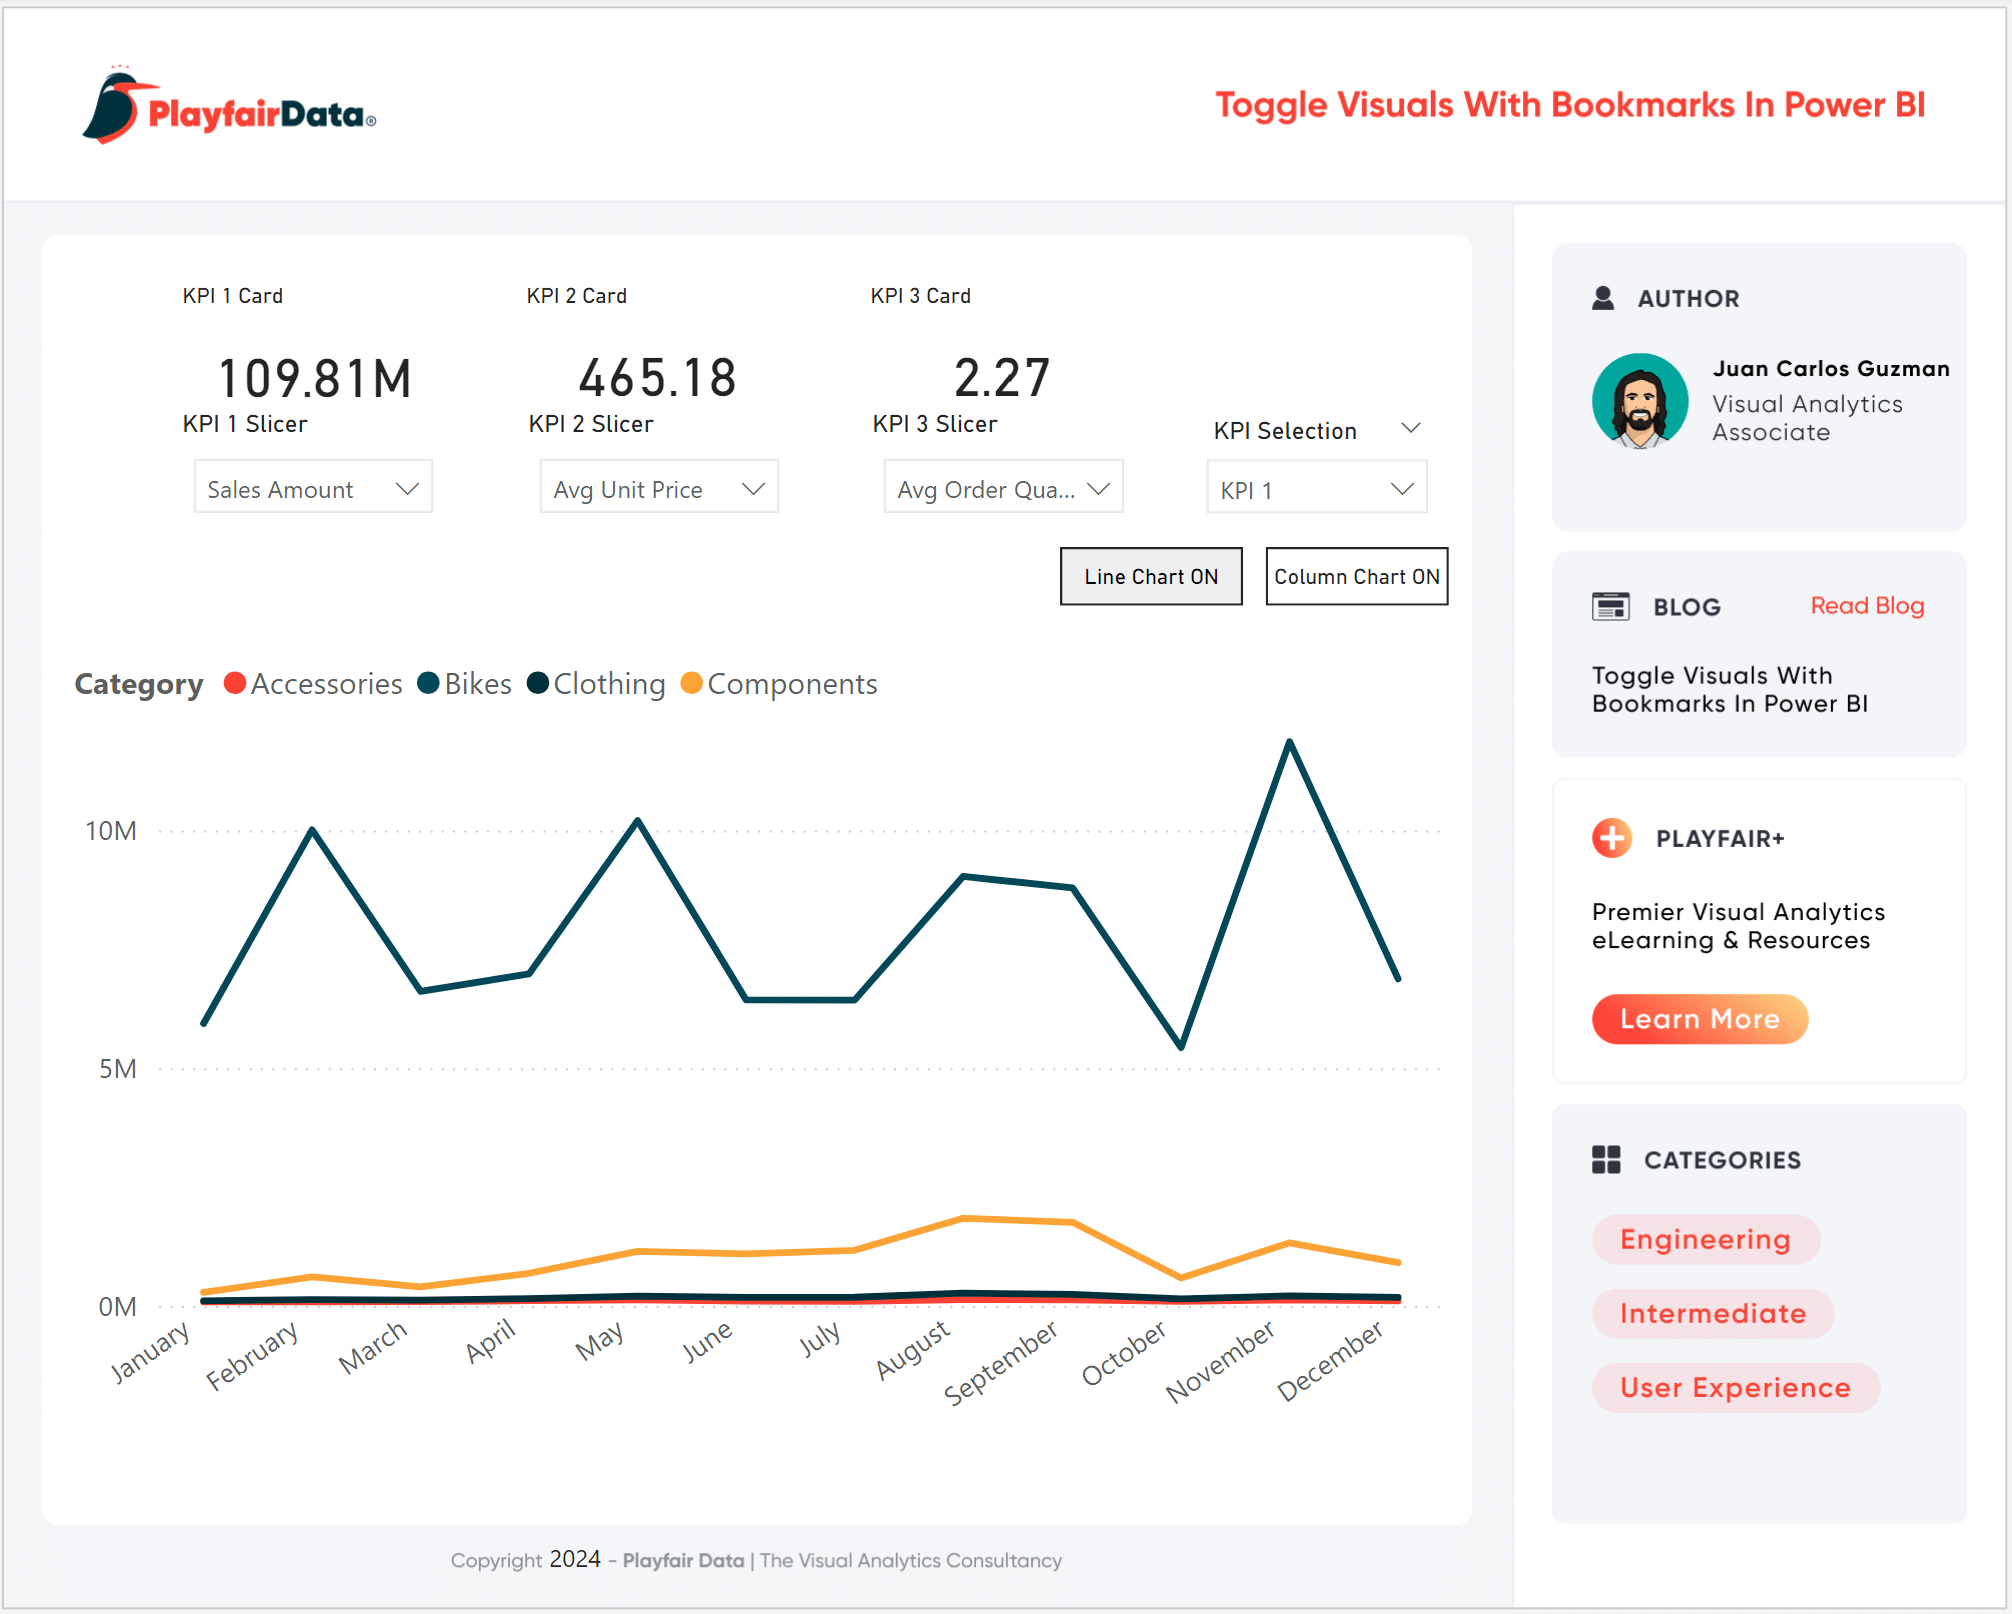
Here is the report with the “Line Chart ON” bookmark toggled.
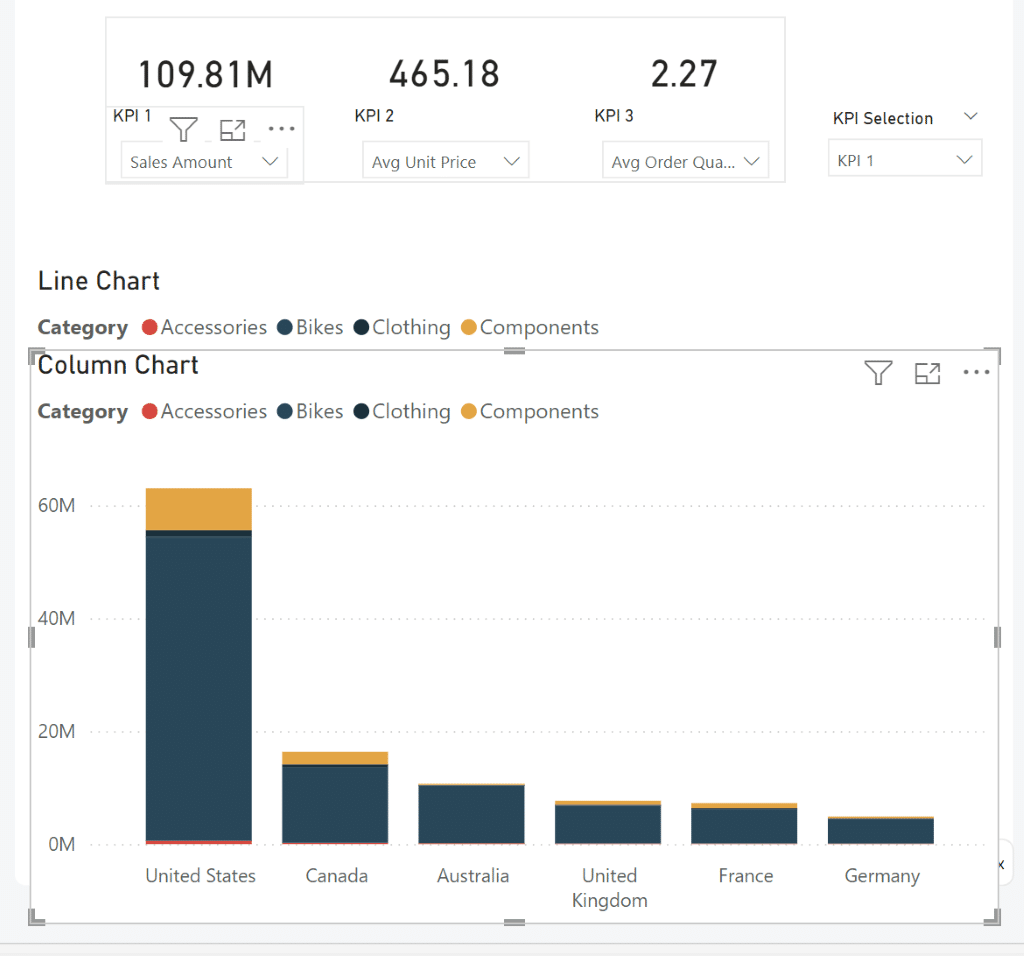
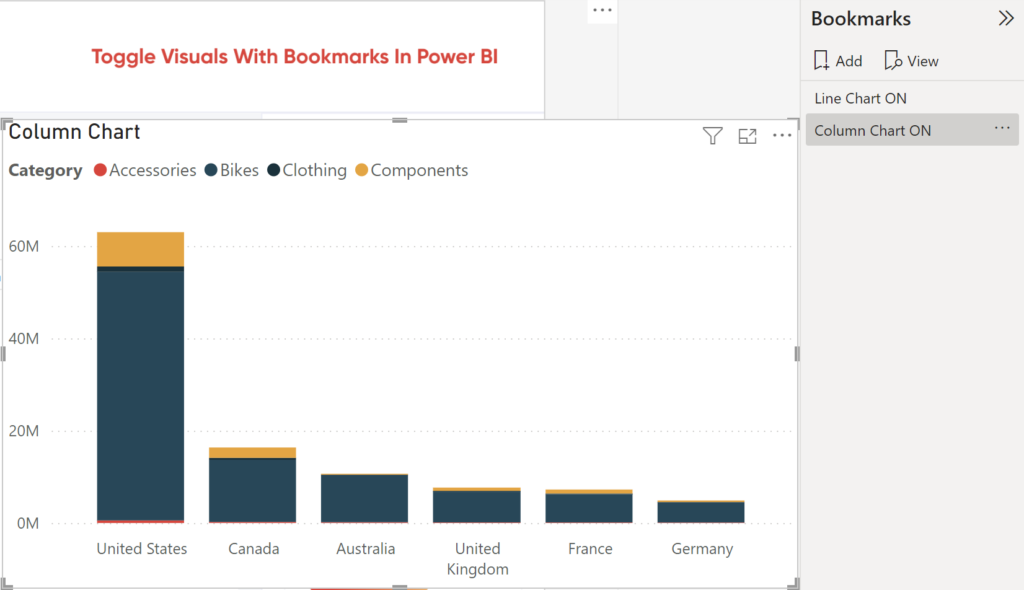
Here is the report with the “Column Chart ON” bookmark toggled.
Improving the UX of report bookmarks in Power BI Desktop
Having to keep the Bookmarks and Selections panes open to interact with a report isn’t ideal because they affect your page’s size and scaling. A bookmark navigation button is a quick way to improve your report’s user experience. Instead of having a user open the Bookmarks pane in the service to interact with a report, they can simply click the bookmark navigator button to toggle between bookmarks.
From the Insert tab, click on the Buttons dropdown, and click on Navigator → Bookmark navigator.
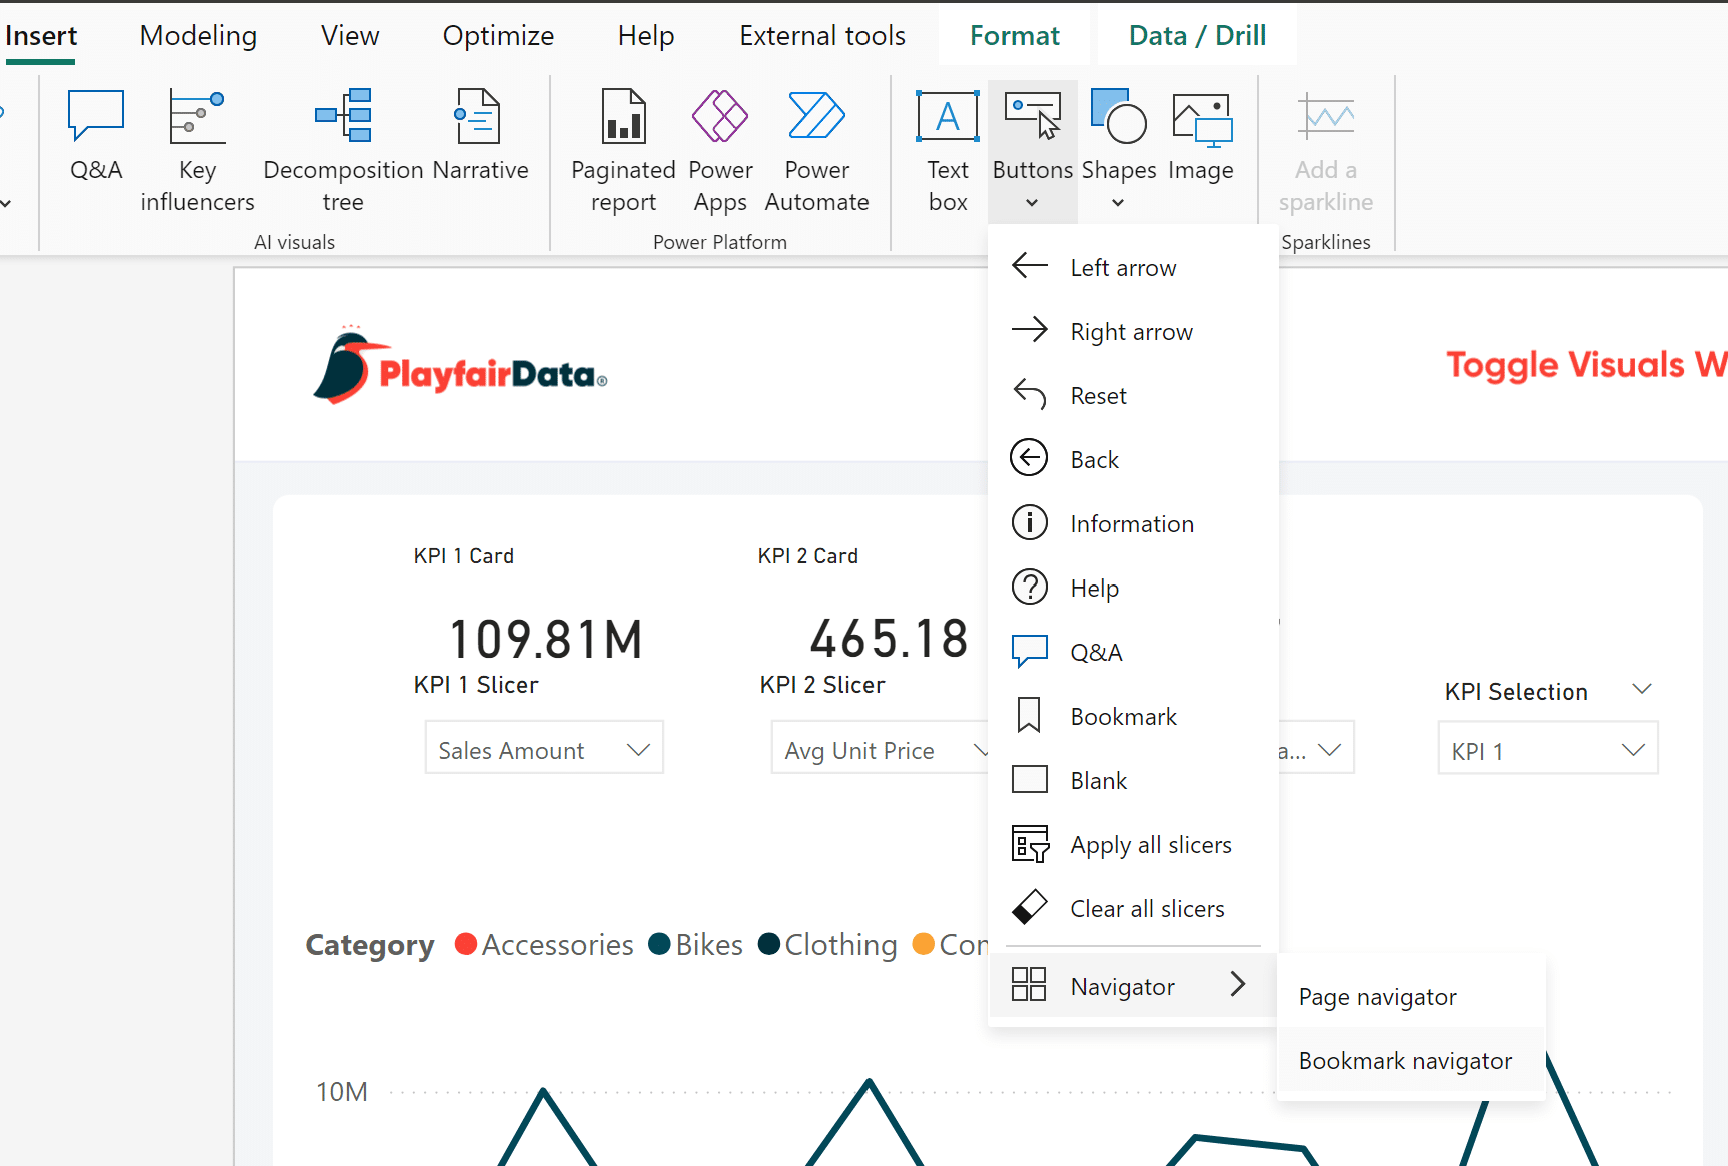
Format the Bookmark navigator button to suit your needs.
This bookmark navigation button provides a better user experience than the Bookmarks pane and it takes up minimal space on the report page. In this tutorial I’ve discussed bookmark basics, how to toggle an element’s visibility using the Bookmarks and Selection panes, and how to improve a report’s user experience by adding a navigation button.
Thanks for reading,
Juan Carlos Guzman

Written By
Juan Carlos Guzman

Peer Review
Matt Snively
Sr. Manager, Analytics Engineering
Related Content
An Introduction to Parameters in Power BI
Parameters are user-generated values that define how a system can operate. We can use parameters in Power BI to grant…

Dan Bunker
Enhance Dashboard UX with Dynamic Zone Visibility In this tutorial, Dan explains Tableau’s dynamic zone visibility feature and how it…
3 Ways to Make Lovely Line Graphs in Power BI
If you read the first installation in this series on how to make Power BI bar charts more engaging, this…