Visual Analytics Trends for 2024

Portions of this post originally appeared on LinkedIn. Follow us on LinkedIn for frequent updates on visual analytics trends and Playfair Data developments.
“The dashboard melted, but we still have the radio.” This Modest Mouse lyric got me thinking about visual analytics trends and the future of the practice – here are a few of my current thoughts:
First, dashboards are not “dead” as I’ve seen proclaimed on LinkedIn and even used as the basis of a marketing campaign for a successful BI software company (who also happens to proudly show a dashboard in literally the first image on their website).
For better or worse – as not everything can be measured and there can be unintended consequences when focusing on the wrong measurements – “what gets measured gets done (or managed).” I have several dashboards that I use daily to monitor the health of our business and I know wholeheartedly that we would not be as successful without them. They are not going away.

Instead, dashboards and visual analytics trends are evolving.
Of course, AI / GPT will disrupt the way we do analytics, but I view its potential as a complement / efficiency-booster for analysts (see below), and not a replacement of analysts. Sure, it may replace how we quickly answer ad-hoc questions, but somebody still has to ask the questions.
I view data visualization as an artform, so I’m not convinced these latest tools will ever be able to replace the strategic insight required going into a visual analytics project, the empathy required for discovery during the project, and the storytelling to maximize the effectiveness of its distribution – much less be able to do all that any time soon.
More practically speaking, I’m admittedly skeptical that most enterprise data is ready for these tools, which will make them largely unusable in the short term without thorough human vetting on the backend. This makes me think of televisions that have the ability to project 4K, and soon to be 8K, resolution, with little and no live content actually produced in those respective resolutions. One aspect of the technology is years ahead of the other.
Next, “details on demand” will become “dashboards on demand”. I’m seeing an increasing visual analytics trend to provide rich analyses on demand, beyond the raw data or a single explanation of what’s driving performance. Users will need almost dashboards about dashboards and/or the ability to do their own deeper analysis. Perhaps the aforementioned AI tools can help in this area.
Finally, embedded visual analytics across all devices / applications will continue to grow in parallel to the need to make data-informed decisions more accessible in a world of exploding data size and complexity.
My interpretation of the song referenced above is about being optimistic when you experience a loss of control. Sometimes it may feel like rapidly-evolving technology, competitive landscapes, and stakeholder needs are causing some loss of control, but I’m optimistic about the future of visual analytics – it has lasted 237 years and counting.
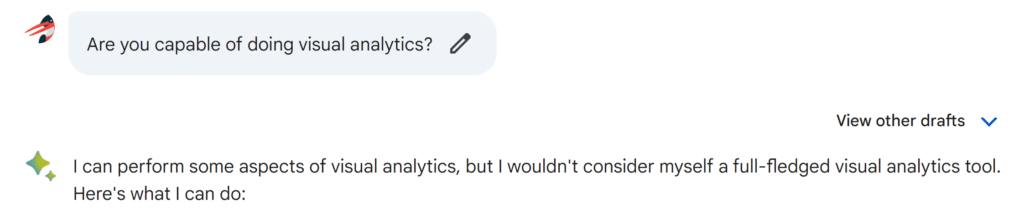
We asked AI if it’s capable of doing visual analytics – here’s what it said
We have been researching visual analytics applications of ChatGPT, ChatGPT Code Interpreter, and Google’s Bard chatbot. As of the release of Gemini Pro, Bard appears to be the early front-runner – particularly outperforming the competition in enterprise-focused area applications.
So, I thought I would ask Bard if it’s capable of doing visual analytics.
Continue reading with a free account, or login.
Unlock this tutorial and hundreds of other free visual analytics resources from our expert team.
Already have an account? Sign In
By continuing, you agree to our Terms of Use and Privacy Policy.
- Data Exploration and Visualization:
- I can access and process data from various sources, including structured and unstructured formats.
- I can generate basic visualizations like charts, graphs, and maps.
- I can identify patterns and trends in the data using statistical methods.
- I can provide summaries and summaries of the data in natural language.
- Interactive Analysis:
- I can accept user queries and filter the data accordingly.
- I can answer questions about the data based on my understanding of the visualizations.
- I can highlight specific data points or areas of interest upon request.
These can be extremely helpful starts to a meaningful analysis, particularly the lightning-fast creation of summaries in natural language. That is, IF, the underlying data is clean and trusted enough, which seems to be a deal breaking limitation with no solution in sight. Bard went on to list its own perceived limitations:
“However, there are some limitations to my capabilities:
- I don’t have the capabilities to create highly customized or interactive visualizations.
- My analysis is primarily based on statistical methods and my understanding of the data, not on visual perception and reasoning.
- I may struggle with complex datasets or tasks that require advanced visual analytics techniques.”
May struggle with complex datasets or tasks requiring advanced visual analytics techniques – don’t they all? At the risk of sounding like too much of a contrarian or being stuck in my two-century old ways (i.e. bar chart, line graph), here are some ideas the Playfair Data team has for applying AI in visual analytics and data visualization.
12 ideas for applying AI to visual analytics
- Upload a dataset to ChatGPT’s Code Interpreter and have it identify outliers.
- Create basic / static data visualizations. Google’s Bard can create line graphs, bar charts, pie charts, scatter plots, heatmaps, box plots, and maps, among others. It also had this to say when asked if this was an exhaustive list, “I’m always learning and exploring new techniques, so feel free to challenge me with your data and we can discover the best way to bring it to life visually!”
- Use Midjourney to inspire dashboard layout, design, and user experience.
- Generate custom color palettes that can be integrated throughout dashboards and data products.
- Use AI to do your design research and generate mood boards that can be used for creative inspiration.
- Data collection via (ethical) web scraping.
- Structuring data for complex visualizations. Some charts like custom polygon maps and diverging bar charts cannot be made in visual analytics software like Tableau and Power BI without some restructuring of the data. Try telling ChatGPT what you are attempting to do and get suggestions on the best format for the data.
- Upload a data schema and have AI create mock datasets that can be used during development.
- Analyze a dataset and generate natural language summaries / key insights.
- Compare two datasets for quality control.
- Point you to learning resources for visual analytics-related coding languages such as Python and D3.js.
- Use AI to detect bias, ethics dilemmas, and/or accessibility compliance.
This is AI’s summarized response when asked whether it is capable of doing visual analytics:

If you’re looking for a partner to implement any of the ideas above – or if you have a complex dataset or require advanced visual analytics techniques – establish your visual analytics plan with Playfair Data.
Thanks for reading,
– Ryan

Written By
Ryan Sleeper
Related Content
Celebrating 5 Years of Playfair+ with 5 Sneak Previews
Playfair+ members (and potential members) – Thank you for your support of our premier visual analytics eLearning platform. Five years…
Year in Review, Top 10 Playfair+ Tutorials of 2023

It’s hard to believe that another year has gone by and 2024 is just around the corner. While we are…
Playfair Data Earns Recognitions for Excellence in Visual Analytics and Business Growth

Playfair Data is excited to announce four recognitions underscoring its excellence in the field of visual analytics and its business…