Celebrating 5 Years of Playfair+ with 5 Sneak Previews

Playfair+ members (and potential members) –
Thank you for your support of our premier visual analytics eLearning platform. Five years ago this month, Playfair+ was started to create a community to help us fulfill our purpose of positively impacting the world by improving how data is translated into insight – and have you ever. Now with over 15,000 members – including those from 71 of the current 100 largest companies in the United States – members like you have made an immeasurable positive impact on the world around us.
At Playfair, we love to celebrate accomplishments and reflect on milestones; always in the spirit of continuous improvement. So instead of reviewing how far we’ve come and how we got here, I’m celebrating our first five years by sharing a sneak preview on some of the biggest highlights you can expect in the next five.
New and improved member dashboards
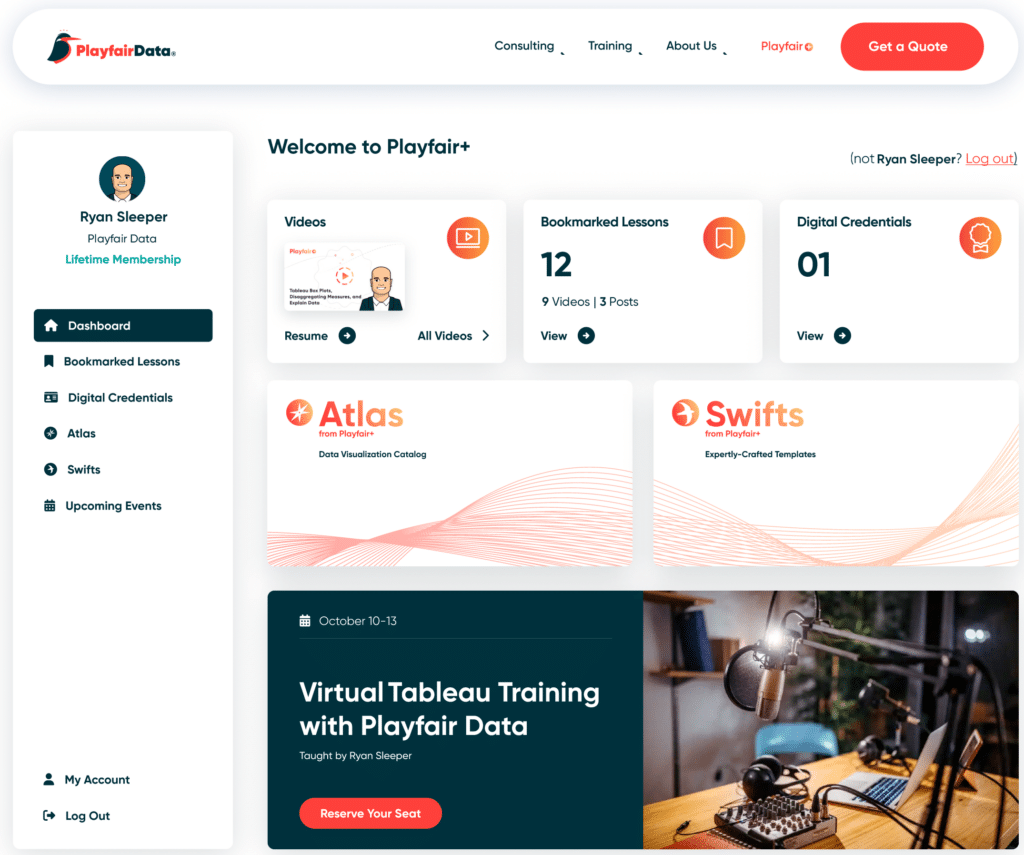
When Playfair+ started as Playfair Data TV five years ago with just 26 videos, it made sense to focus account dashboards on how to get the most out of our video offerings. This meant you were able to access all videos, bookmark videos, and make basic account updates. Then in 2022, we upgraded the Playfair Data sites and introduced digital credentials which also found their way to the member dashboard.
Since then, Playfair+ member benefits have exploded with the launch of (1) Atlas, a first-of-its-kind data visualization catalog, (2) Swifts, expertly-crafted dashboard templates built directly from the award-winning consulting team at Playfair Data, (3) the full integration of our library of 400+ written and video tutorials, and even more.
To keep up with this momentum, I am thrilled to announce the release of our brand-new member dashboard which we believe finally provides a proper home for everything Playfair+ has to offer.
Expected: September 2023
Diversifying courses and instructors
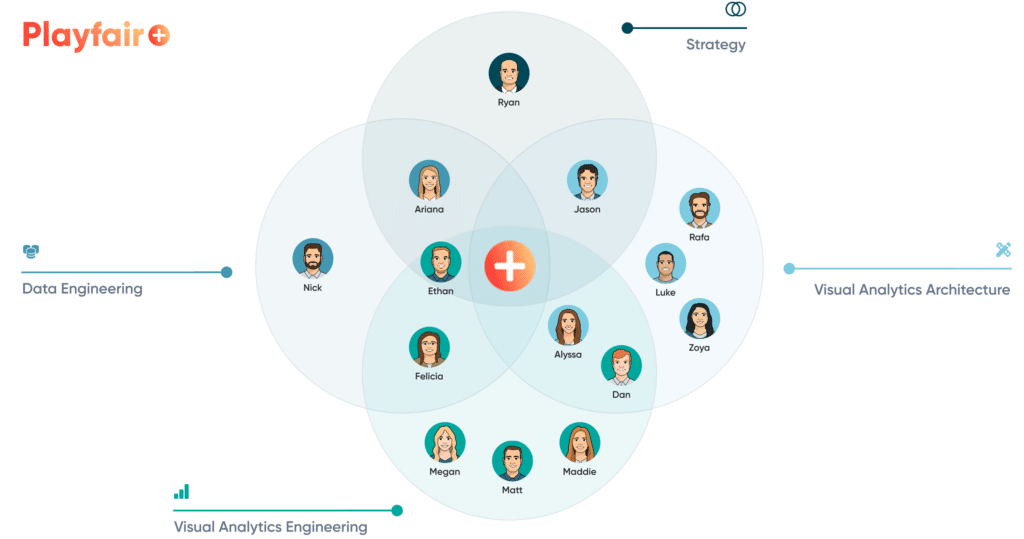
With three Tableau books – and a fourth on the way – our team has a lot of Tableau tips and tricks to share. And while we are still betting on Tableau being a leader in the visual analytics space for the foreseeable future, there is so much more that goes into translating data into insight. The talents of our Playfair+ instructors span analytics strategy, business analysis, decision science, data engineering, user experience design, and, of course, data visualization.
That’s why you have already seen the expansion of our exams and digital credentials to include Advanced Analytics Practitioner and Data Engineering Practitioner. We have also diversified our written tutorial categories to include design, data engineering, and storytelling, among others. In the coming months, you can expect video complements to accompany this diverse portfolio of visual analytics tutorials – and from the specialists in those areas.
Expected: Now – November 2023
Expansion of Swifts
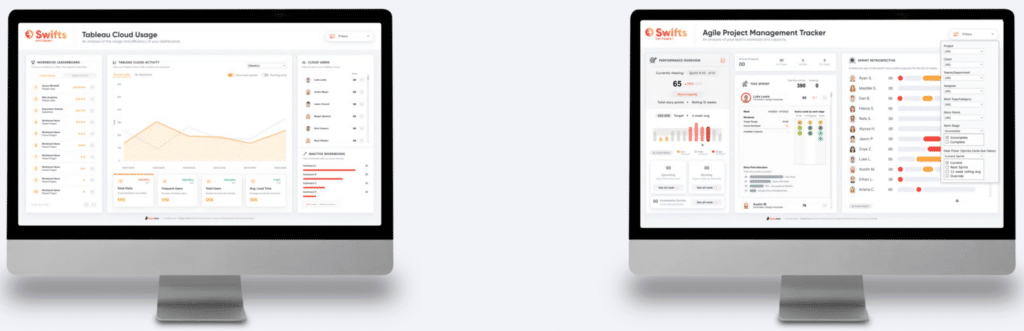
Arguably the biggest value addition to the portfolio of Playfair+ benefits came earlier this year in the form of Swifts, which are Tableau workbook and data workflow templates built by the team of experts at Playfair Data. These templates are built with the same level of quality you can expect when we build pilot dashboards for your company. You simply download the templates, plug in your own data, and you have world-class dashboards in your toolbelt.
Earlier in 2023, we introduced both the Asana Project Management and Tableau Cloud Usage Swifts, and we plan to continuously identify common analytics challenges so we can create Swifts to solve those challenges. We have a backlog of ideas spanning time management to paid media reporting, and we are currently in development of a Google Analytics 4 Swift.
“GA4”, which every company was required to switch to in July 2023, has come with a new learning curve and challenges in creating trusted reports that analysts rely on to optimize their businesses. So, the team at Playfair is taking the guesswork out of Google Analytics data and will deliver a Swift that allows users to effortlessly create a variety of charts out of any fields.
Expected: August 2023
Corporate memberships and the introduction of Guides
Our popular live Flagship course has been running strong for over six years; both in-person pre-COVID-19 and since in a virtual environment. But it can be challenging for companies to block two to four days to send their entire team, which in turn makes it challenging to keep their entire team at the same level of visual analytics expertise. We’ve been looking for ways to scale the enablement potential of Playfair+ and believe the solution is corporate memberships.
Companies with teams of ten or more will soon be able to add their entire team to the Playfair+ platform, ensuring everyone has access to the same techniques applied at Playfair Data, digital credentials to demonstrate expertise, and best-in-class dashboard templates that teams can apply to their own use cases. Corporate members will even have the option to have their company name displayed on every team member’s account dashboard.
Further, for an optional ten-hour engagement, Lifetime members can have the Playfair+ team create a Guide for each dashboard we create together. Guides help you maintain dashboards by providing handpicked tutorials relating to your projects. Deliverables include visual documentation, brand guidelines, and customized links to Playfair+ tutorials.
Expected: August 2023
Atlas updates to include Playfair Data innovations
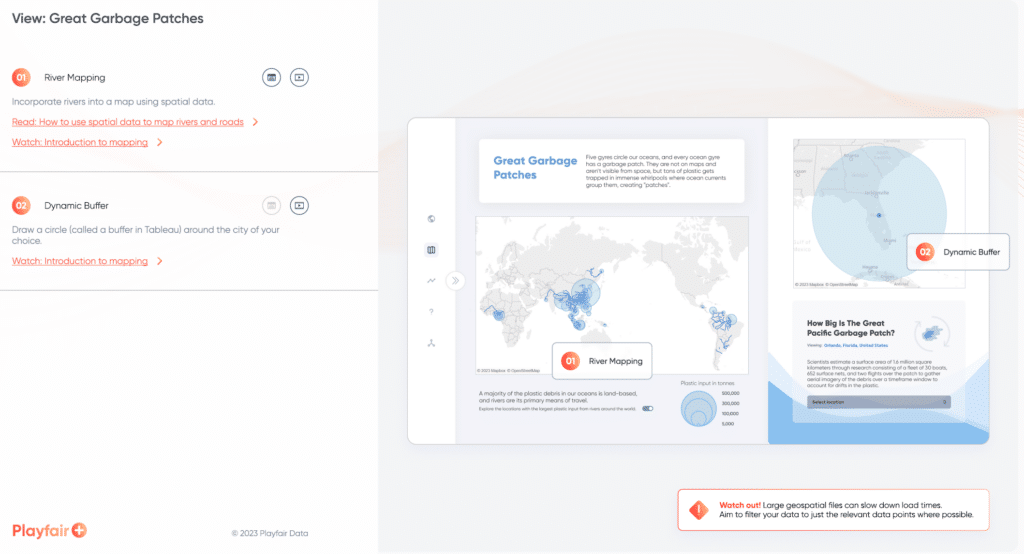
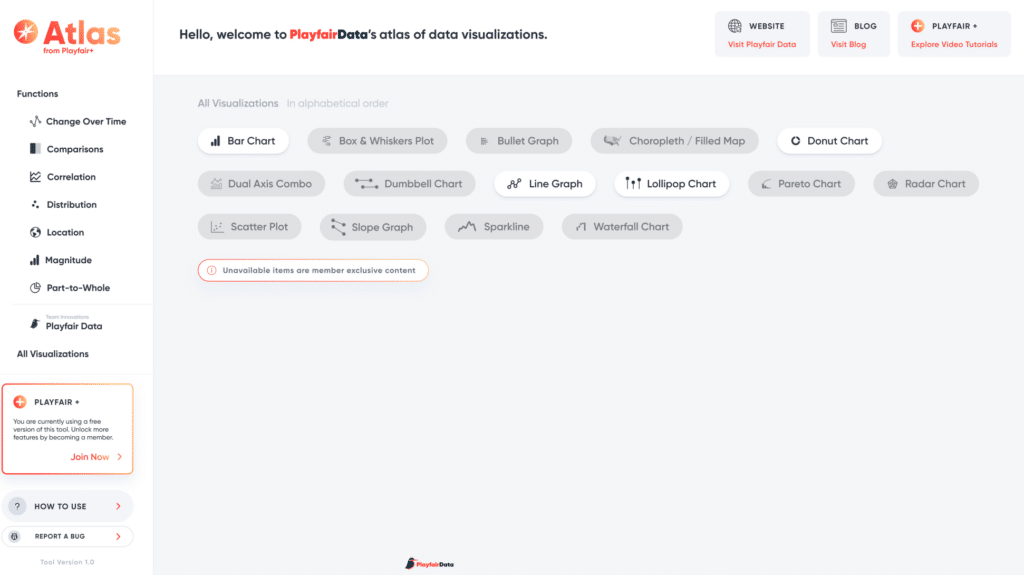
Last year, Playfair+ introduced Atlas, an interactive catalog of data visualizations. In addition to the design, user experience, and best practices you’ve come to expect from our team, what sets Atlas apart is: (1) users can plug in their own data to implement each visualization as efficiently as possible, and (2) customized links – to Playfair+ content, of course – to outline in detail how to create every visualization. To further establish Atlas as the go-to visual analytics resource in the industry, we are currently integrating a section dedicated to Playfair Data creations.
Following the inspiration of our company’s namesake, William Playfair – inventor of the bar chart, line graph, area graph, and pie chart – Playfair Data has always tried to push the envelope of what’s possible with visual analytics. Over the years, Playfair Data has developed many visualization innovations and even new chart types, including leapfrog charts, polygon scatter plots, Sankey bump charts, and Pilula charts, among others. What better home for these visualizations and tutorials than Atlas?
Expected: August 2023
In closing, thank you. Five years ago, offering a lifetime membership to an eLearning platform was unheard of. Even crazier, we offered beta invites at half price. Our earliest members paid $100 USD, have never been charged another dime, and are still enjoying the mounting benefits of our platform. It may have seemed too good to be true at the time, so I thank you for trusting us to provide the best return on your investment in the industry. I knew we were just scratching the surface on what we would provide to our members.
For those considering membership, I feel the same way today as I did five years ago. It’s my personal mission to positively impact the world with visual analytics, and I have no doubt Playfair+ will be an invaluable resource for the next five years and beyond.
Thanks for reading,
– Ryan

Written By
Ryan Sleeper
Related Content
Playfair Data Earns Recognitions for Excellence in Visual Analytics and Business Growth

Playfair Data is excited to announce four recognitions underscoring its excellence in the field of visual analytics and its business…
Introducing Atlas from Playfair+
Playfair Data, the leading provider of visual data analytics solutions, today announced Atlas, a new library of chart types for…
Playfair Data Announces New Office in the Smart City of Lake Nona

From the heart of the country to the heart of innovation On the heels of our recent recognition by the…