3 Ways to Conditionally Format Numbers in Tableau
There are many needs to conditionally format numbers in Tableau. I’ve previously covered how to dynamically change the prefix and suffix of selected measures, how to automatically change number units (i.e. K, M, B), and how to display varying decimal places dependent on value size.
This post consolidates some of this thinking and shares three of the most common tactics for conditionally formatting numbers in Tableau. You’ll learn how to use Tableau’s existing formatting capabilities to quickly display alt code characters and emojis for different types of changes, how to conditionally control the size and color of text, and how to apply different number formatting based on a parameter selection.
How to Dynamically Format Numbers in Tableau
How to use alt code characters to conditionally format three different outcomes
For the first example, we will use Tableau’s default formatting capabilities to display a character of our choosing when the outcome is positive, a second character when the outcome is negative, and a third character when an outcome cannot be computed (or is NULL).
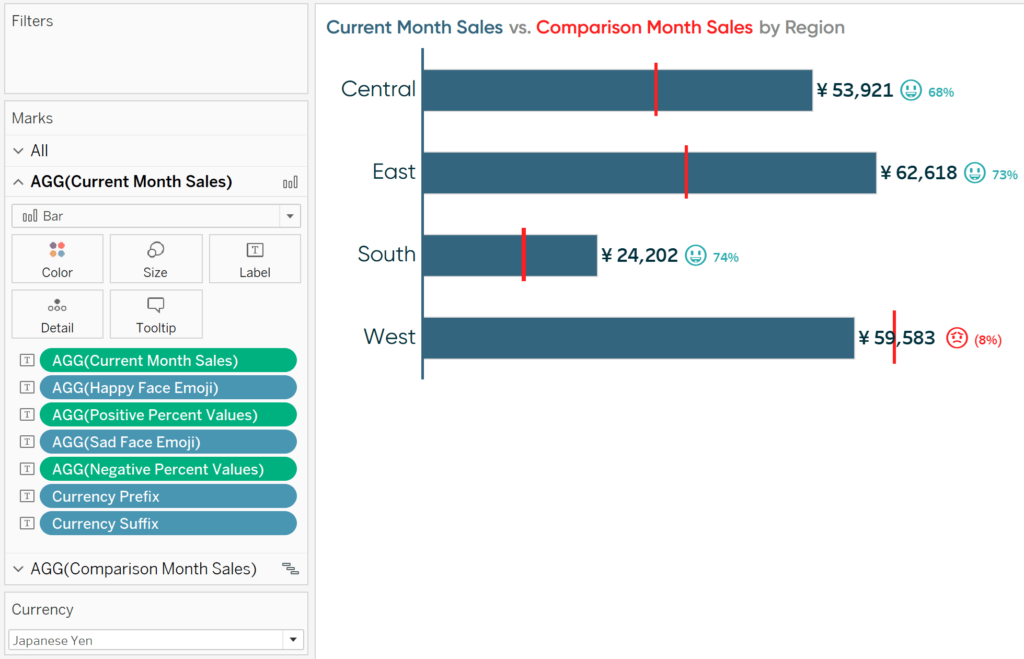
For all the examples in this post, we will be making changes to this Current Month vs. Comparison Month by Region bullet graph. I’ve currently selected October vs. July in the Sample – Superstore dataset.
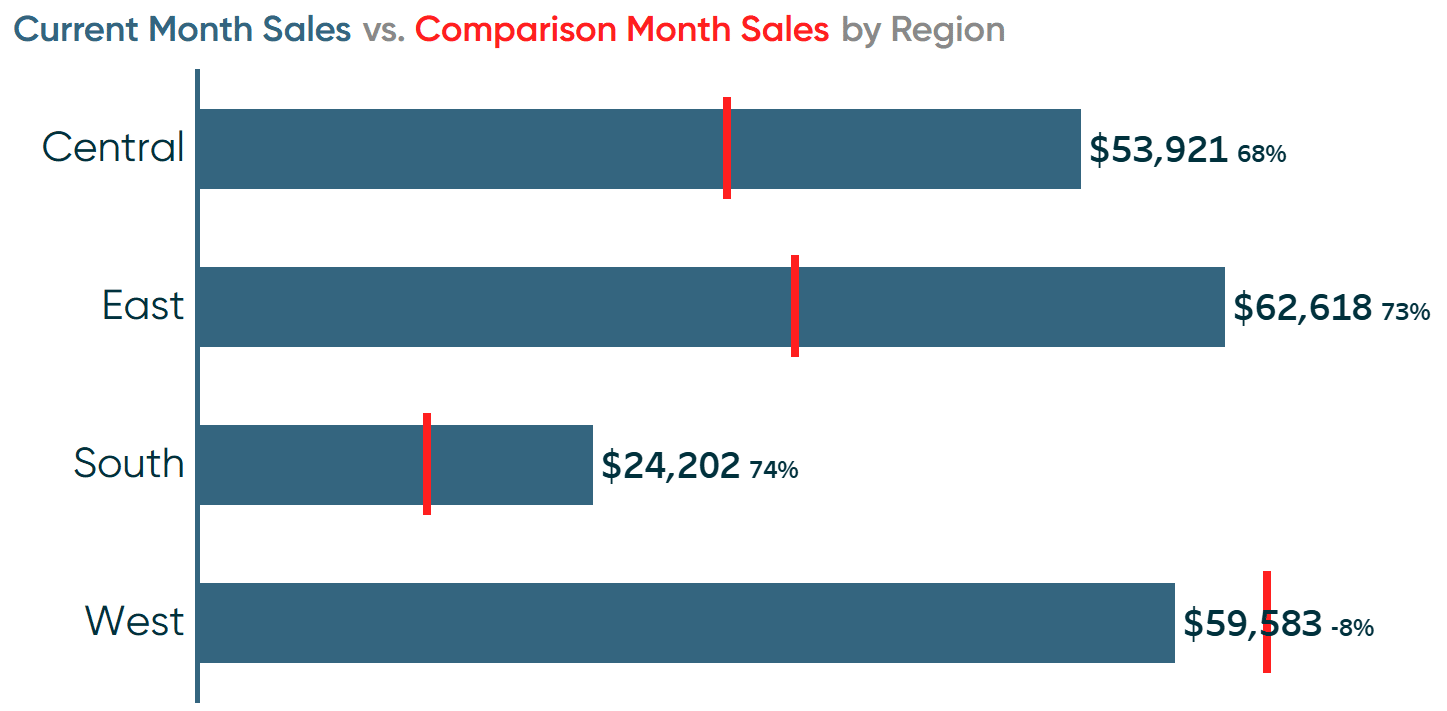
The labels of each bar are displaying the current performance for each region followed by the period over period change in percent terms. However, it is not clear what the percentages represent, especially when the changes are positive. The percentages could represent percent of total, percent of goal, percent of the year that has passed, or something else entirely.
![]()
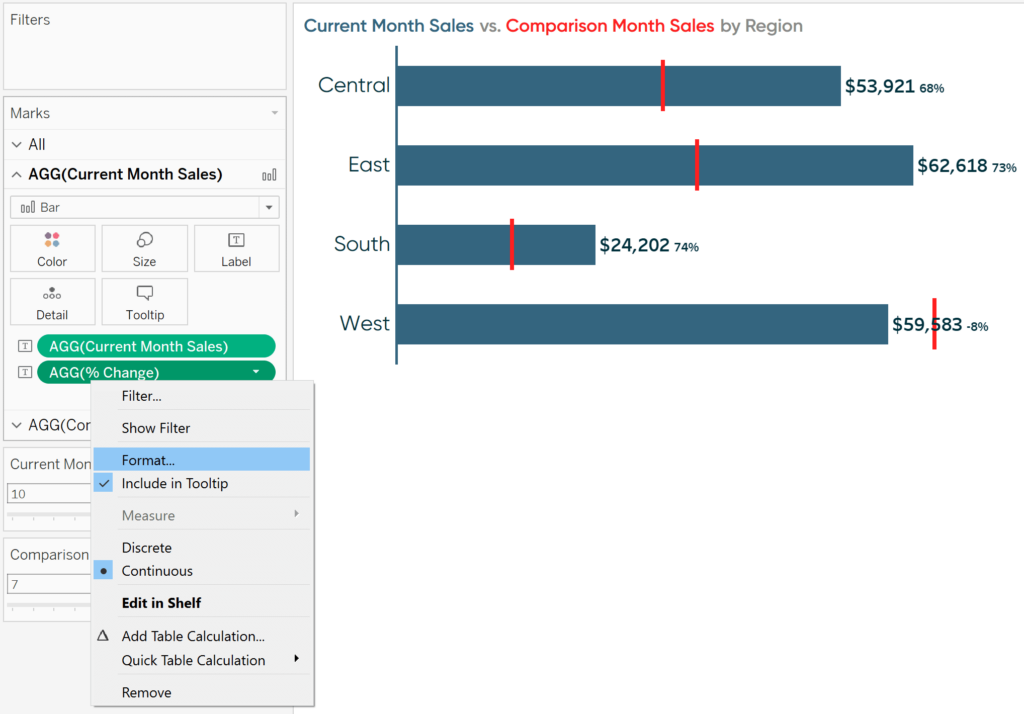
To help imply that the changes are either positive or negative, at a minimum, I’d like to add a plus sign before the positive values. To change the format of a specific measure on the view, right-click its pill and choose “Format…”.
Continue reading with a free account, or login.
Unlock this tutorial and hundreds of other free visual analytics resources from our expert team.
Already have an account? Sign In
By continuing, you agree to our Terms of Use and Privacy Policy.
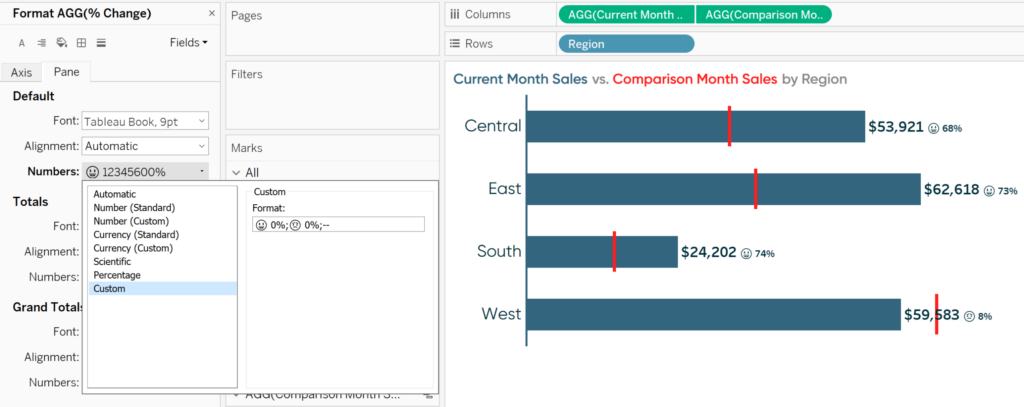
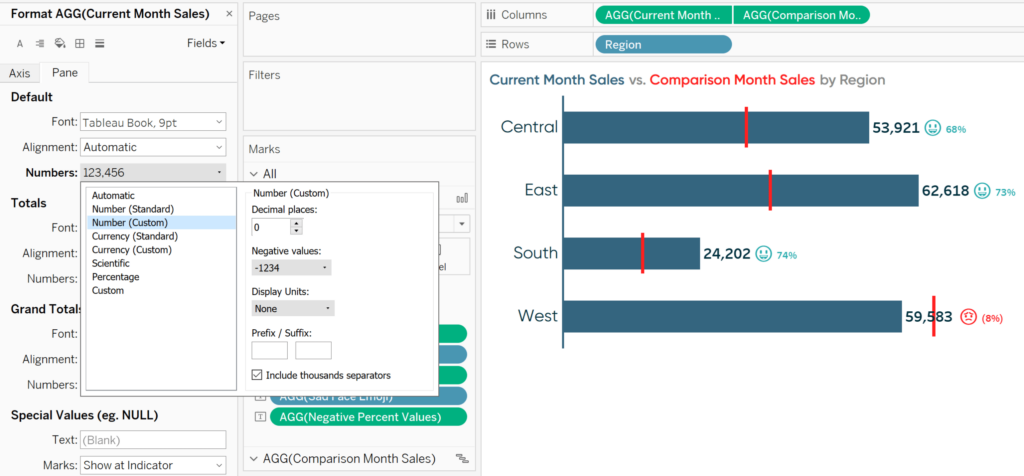
This will open the Format pane where you can modify the format of the measure on the axis and/or within the pane (i.e. the numbers on the chart itself). The chart I’m using does not have an axis, so I will modify the dropdown called “Numbers” on the Pane tab.
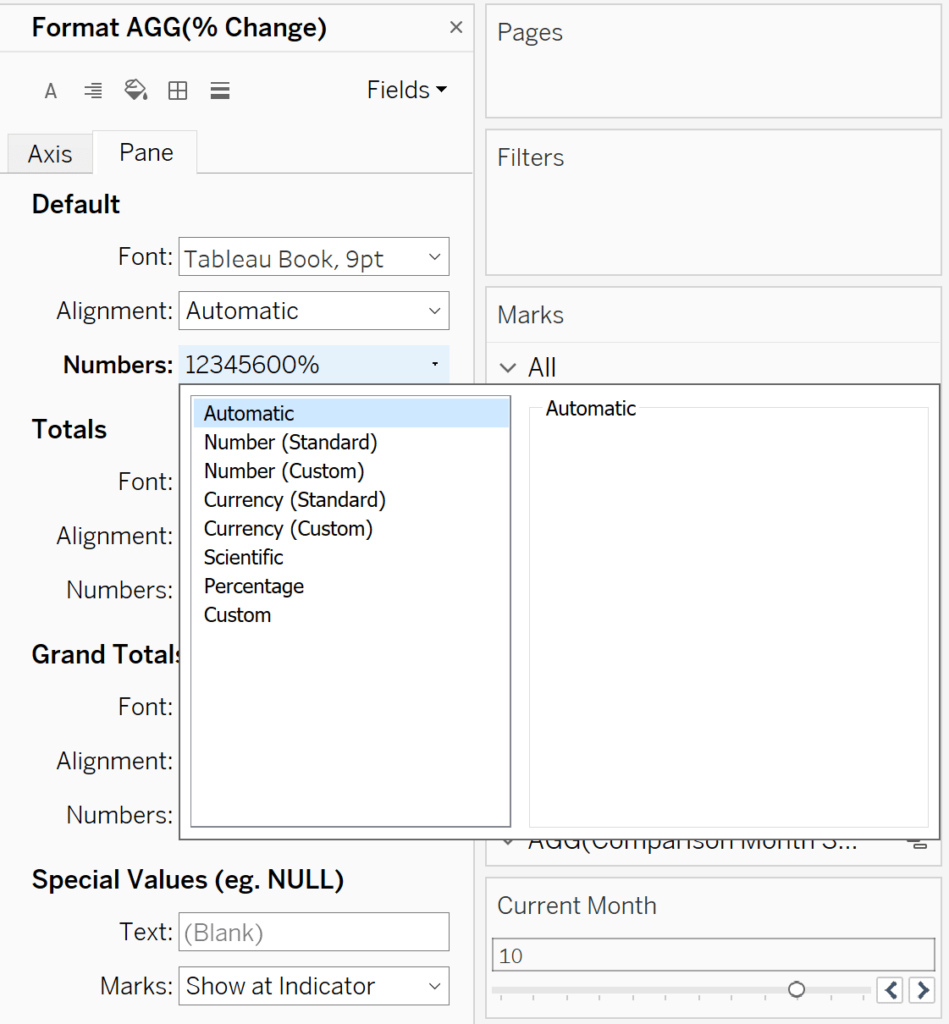
From here, if you navigate to the Custom options, the first format you type in the open “Format:” text box will be displayed when the measure is positive, the second format you type will be displayed when the measure is negative, and, optionally, the third format you type will be displayed when the measure is neither positive or negative.
Measure formats should be separated by the semicolon punctuation mark (;). Here’s how my custom formatting looks if I want to display a plus sign before positive values followed by a percent sign and no decimal places, a negative sign before negative values followed by a percent sign and no decimal places, and two dashes when the value is null, or neither positive or negative.

If you would always like a measure to start out formatted a specific way when it is added to a new view, you can also set the “default formatting” of a measure by right-clicking on it in the Measures area of the Data pane on the left, hovering over “Default Properties”, and choosing “Number Format…”.
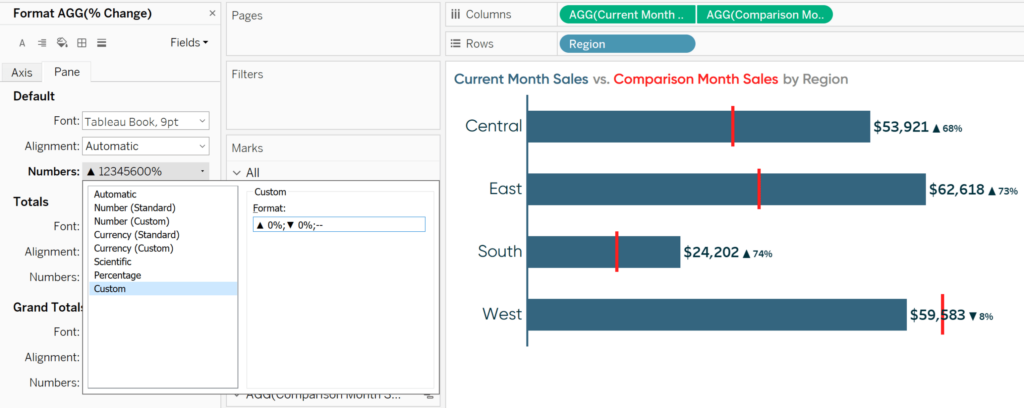
The technique outlined to this point is also how you can conditionally display an up triangle (▲) for positive changes and a down triangle for negative changes (▼). You would simply replace the plus sign with the up triangle and negative sign with the down triangle.
To do so, you can either copy and paste the symbols from this tutorial, or you can create the symbols with alt codes. The up triangle is created by holding down the alt key while you type the number 30; the down triangle is created by holding down the alt key while you type the number 31.
Here’s how my view looks after customizing the number format with alt code characters.
But did you know you can format measures with any alt code character including emojis? Here’s how my view looks after customizing the number format with a happy emoji (alt+128515) for positive changes and a sad emoji (alt+128543) for negative changes.
I’ve experienced mixed success with typing alt code characters directly into Tableau – especially when using emojis – so your best bet is to copy and paste the emojis of your liking. For example, alt+1 (☺) works great, but others sometimes result in unexpected characters.
Format the size and color of measures in Tableau
In the latest view, the happy face implies something positive happened and the sad face implies something negative happened. To drive the point home, I may want to double-encode the symbol so it not only dynamically changes between its positive and negative characters, but is also colored based on if the change was positive or negative.
Further, the emojis are relatively small and challenging to decipher. I would prefer the emojis be larger, but leave the size of the percent values as is.
Both requirements pose a challenge because, by default, measures in Tableau share the same format, whether they are positive or negative. So, I could change the size of the measure to make the emojis larger, but then the percent values would also be larger. I could change the color of the measure to blue because most of the changes were positive, but the emoji and percent value for the West region would also be blue even though its change was negative.
The trick for getting around this so you can conditionally format both the size and color of measures is to create a calculated field for each component of the text you want to conditionally format.
If you use the Immediate IF (IIF) function, you can set up each calculated measure to only display when a certain criterion is met (i.e., a positive change). Since each measure will create its own text on the chart, they can be formatted independently.
I can make the happy face emojis blue and a larger size than the percent values, the sad face emojis red and a larger size than the percent values, the positive percent values blue, and the negative percent values red. That’s four different formats for what is perceived to be one measure by the audience.
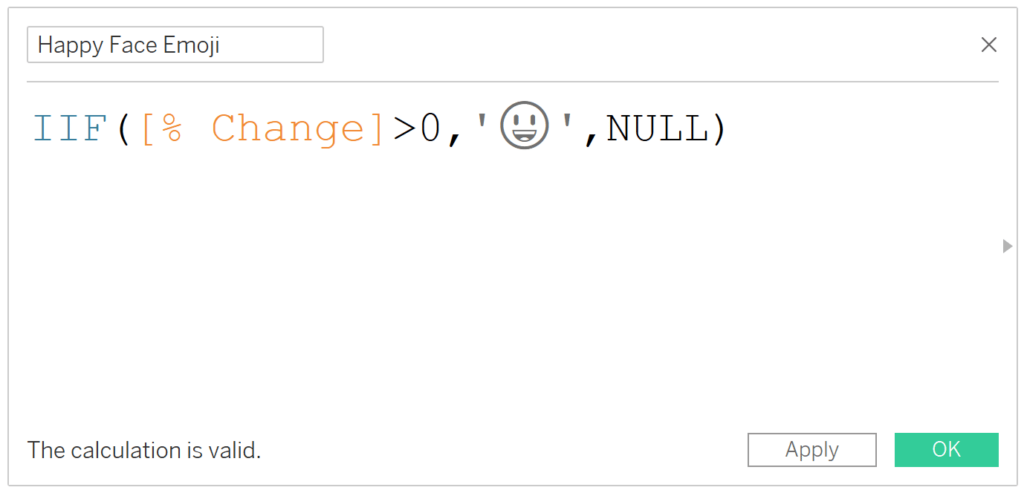
Here are the series of calculated fields I would need to create this experience:
Happy Face Emoji
IIF([% Change]>0,’ ‘,NULL)
Positive Percent Values
IIF([% Change]>0,[% Change],NULL)
![Positive percent values calculation is "IIF([% Change] > 0, [% Change], NULL)"](https://playfairdata.com/wp-content/uploads/2020/03/Positive-Percent-Values-Tableau-Calculated-Field-1024x492.png)
Sad Face Emoji
IIF([% Change]<0,’ ‘,NULL)
![Sad face emoji calculation is "IIF([% Change]<0,' ',NULL)"](https://playfairdata.com/wp-content/uploads/2020/03/Sad-Face-Emoji-Tableau-Calculated-Field-1024x491.png)
Negative Percent Values
IIF([% Change]<0,[% Change],NULL)
![Negative Percent Values calculation is "IIF([% Change]<0,[% Change],NULL)"](https://playfairdata.com/wp-content/uploads/2020/03/Negative-Percent-Values-Tableau-Calculated-Field-1024x490.png)
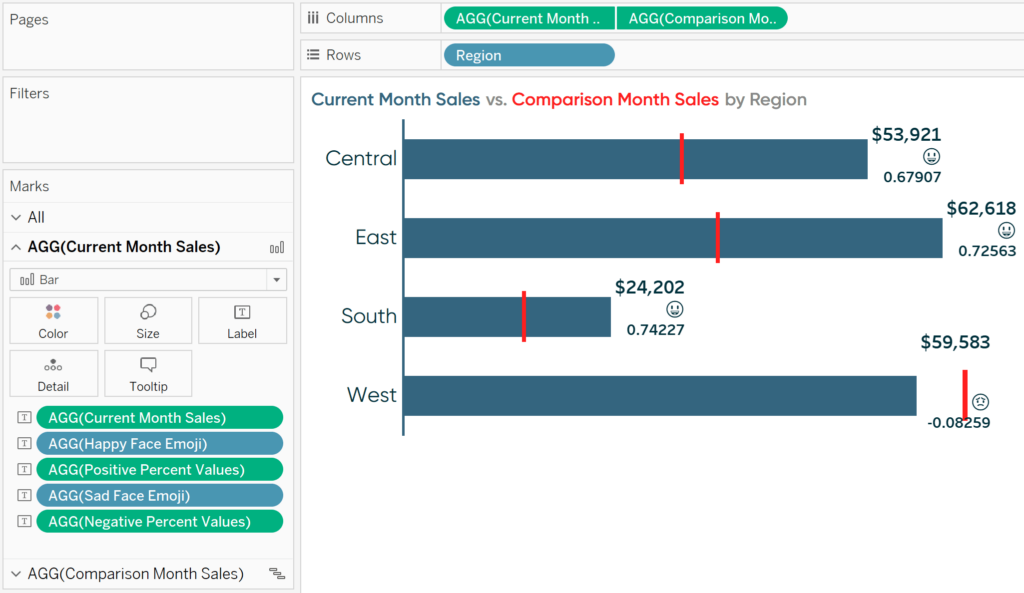
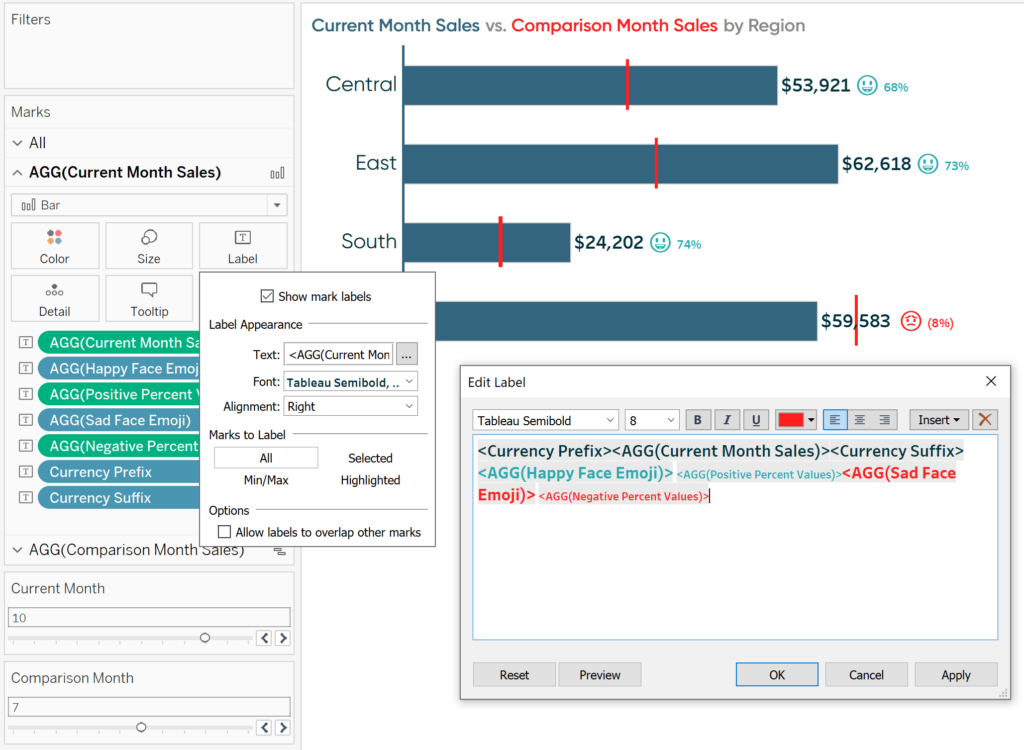
Once you have created a calculated field for each element you want to independently format, place them all on the Label Marks Card (or wherever you are wanting to see the fields).
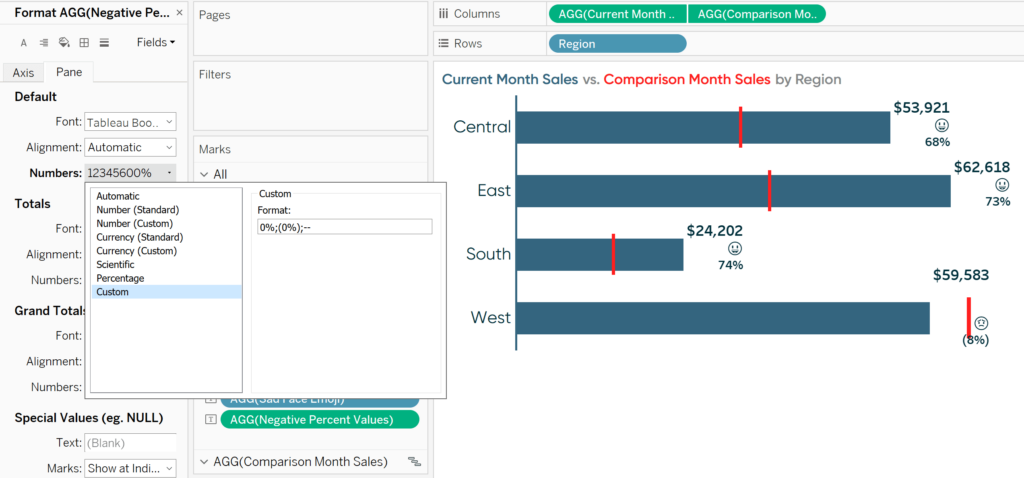
Each of the fields pictured on the Label Marks Card are independent, so I can change their formatting independently. This time, I’ll change the custom formatting of the percent values to “0%;(0%);–” and leave the emojis as is.
Here’s the reason this works. Now that I’ve got all the independent fields on the Label Marks Card, I can click on the Label Marks Card to alter the fields’ size and color independently.
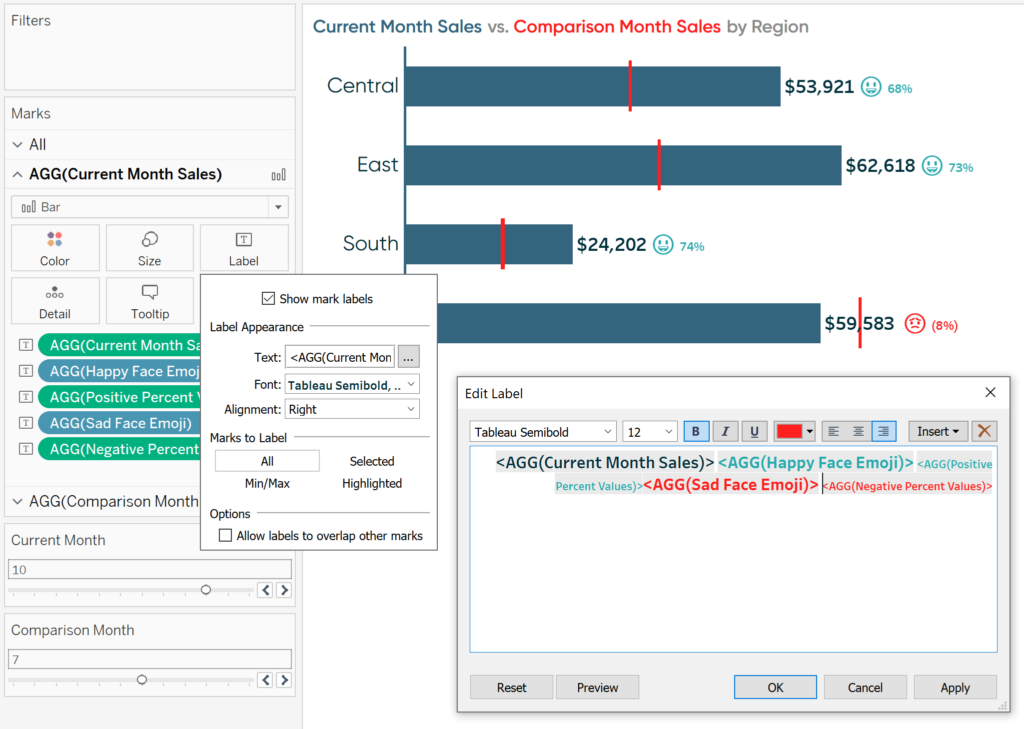
See the chart in the background? Since we used a series of IIF statements to compute each result, only the appropriate fields appear for either a positive or negative change!
How to format measures based on a parameter selection
As mentioned in this post’s introduction, I’ve shared before how to dynamically change a measure’s prefix and suffix. This tactic works great when you are parameterizing a measure selection and is the most flexible conditional formatting option.
This same technique works perfectly when you are working with multiple currencies and allowing a user to select the currency via a parameter. By default, measures can only share one format, but what if you have US Dollars (i.e., $1), Canadian Dollars (i.e., $ 1; note the space between the symbol and value), Canadian Dollars in French Canadian provinces (i.e., 1 $), and Japanese Yen (i.e., ¥ 1).
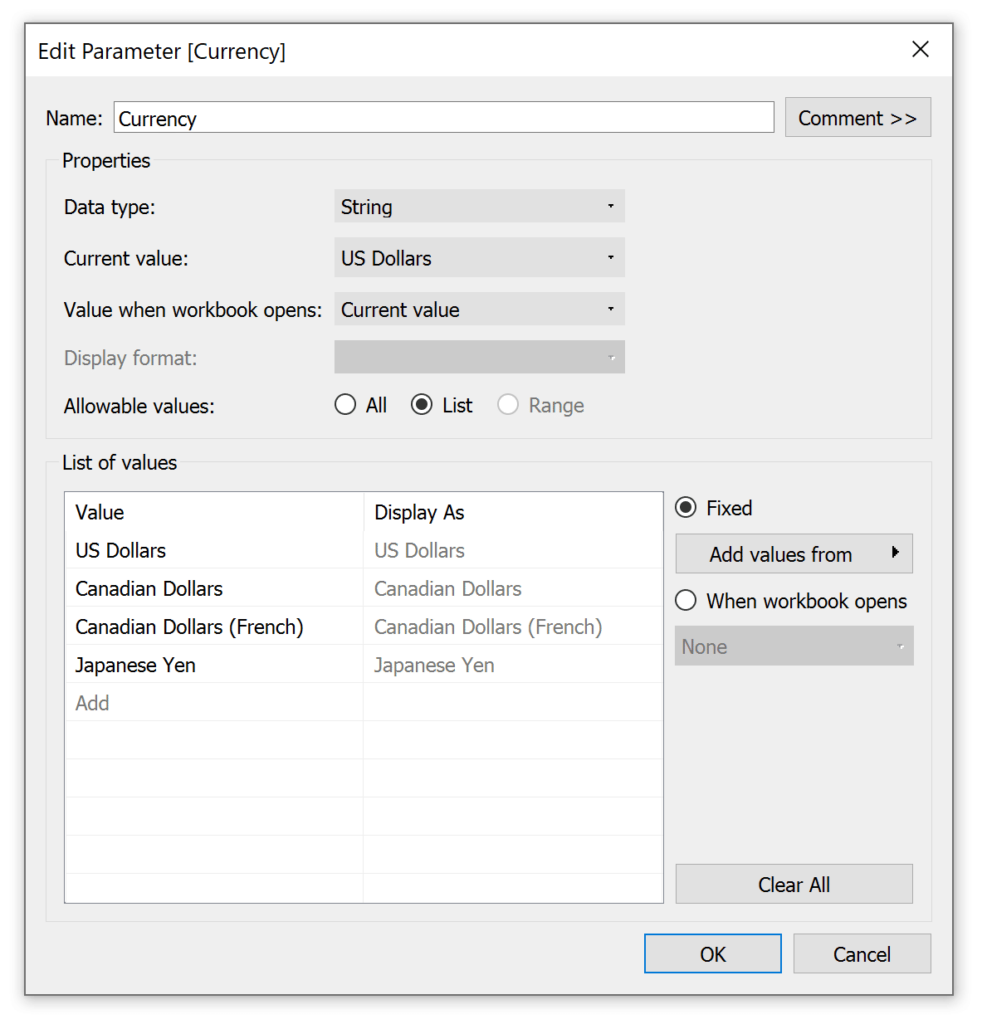
To conditionally format the currency formatting based on the currency selected, start by creating a parameter with each of your currency names.
Next, create one calculated field for the prefix (i.e., the symbol that will be shown before the currency value) and another for the suffix (i.e., the symbol that will be shown after the currency value).
![]()
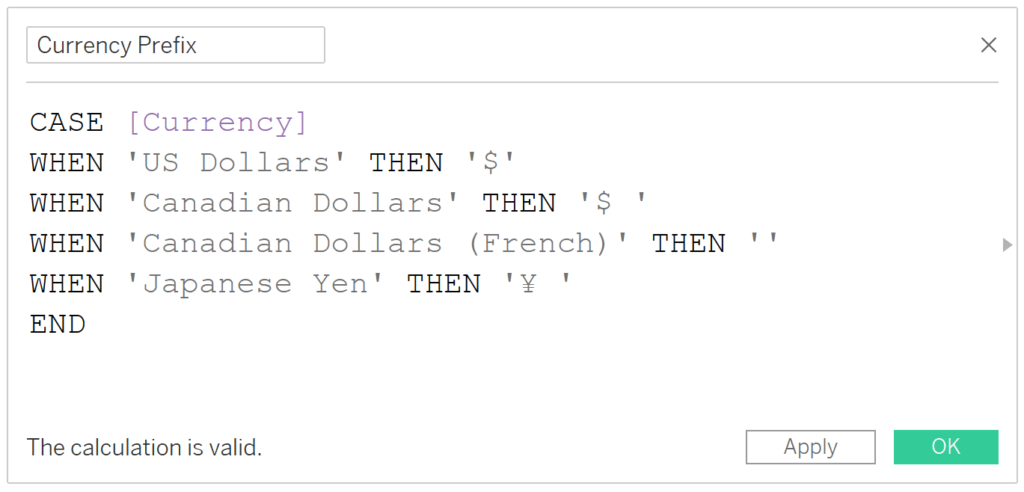
It’s in these calculated fields that you’re giving Tableau instructions for what to display when each value is selected in the parameter. For my Prefix calculated field, US Dollars get a $ sign with no space, Canadian Dollars get a $ sign with a space, Japanese Yen gets a ¥ sign with a space, and Canadian Dollars (French) get no prefix. The formula is:
CASE [Currency]
WHEN ‘US Dollars’ THEN ‘$’
WHEN ‘Canadian Dollars’ THEN ‘$ ‘
WHEN ‘Canadian Dollars (French)’ THEN ”
WHEN ‘Japanese Yen’ THEN ‘¥ ‘
END
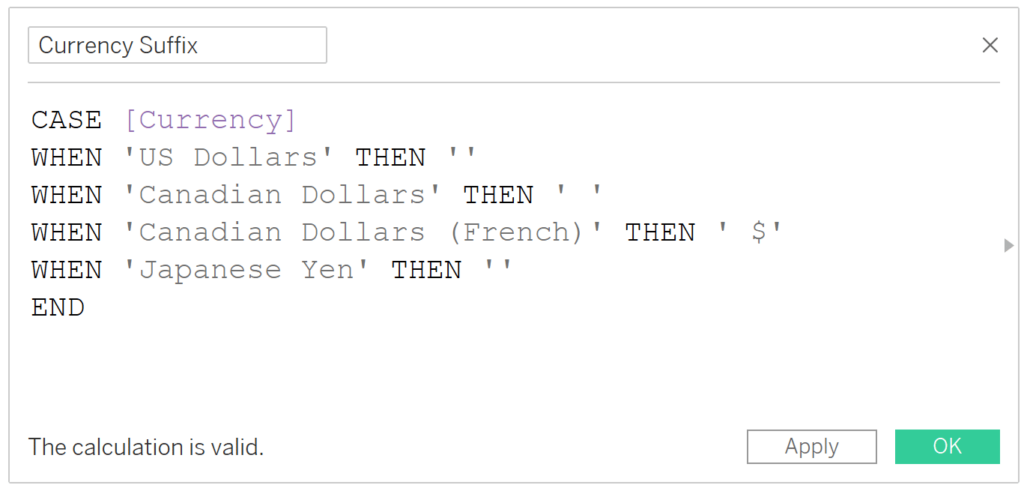
For my Suffix calculated field, only Canadian Dollars (French) get a $ sign following the value. Everything else does not have a suffix, so I am just displaying two tick marks which won’t display anything.
CASE [Currency]
WHEN ‘US Dollars’ THEN ”
WHEN ‘Canadian Dollars’ THEN ‘ ‘
WHEN ‘Canadian Dollars (French)’ THEN ‘ $’
WHEN ‘Japanese Yen’ THEN ”
END
Since we are only displaying a suffix for one of the parameter values this time and nothing for everything else, this formula can also be written as:
IIF([Currency]=’Canadian Dollars (French)’,’ $’,NULL)
When implementing this approach, the currency symbols are controlled by the parameter selection and not part of the measure itself. So, before I add these fields to the view, I’m going to change the format of the currency already on the labels to Number (Custom) with no decimal places.
Note the dollar signs on the bar labels went away.
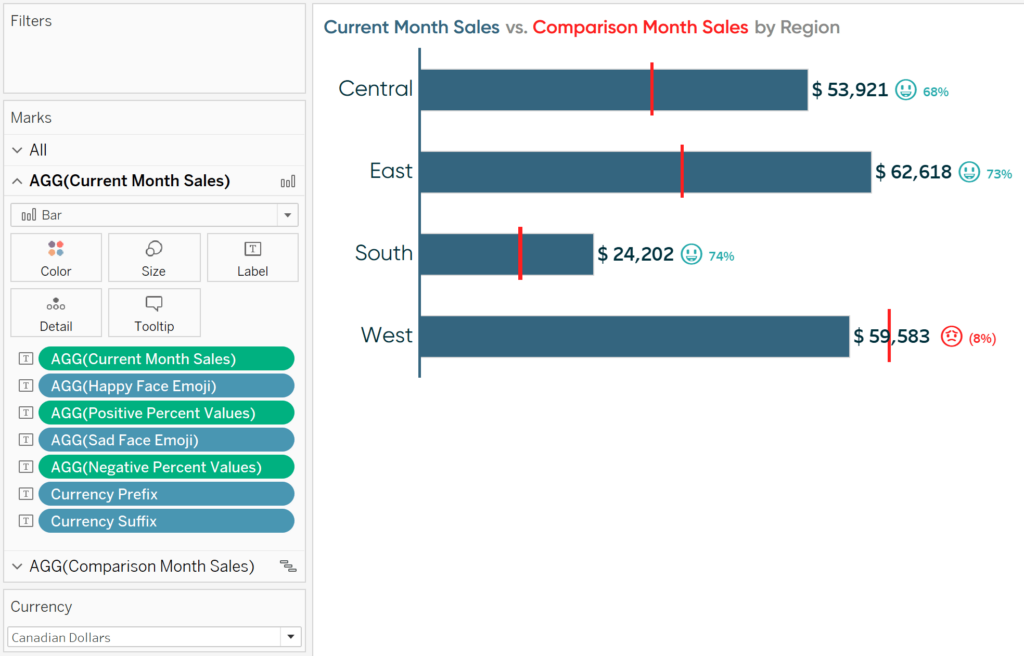
Now I will add the newly created Currency Prefix and Currency Suffix calculated fields to the Label Marks Card. Just like the second tip in this post, once something is on the Label Marks Card, I can click into the card and copy and paste the fields exactly where I want on the label. I’ll place the prefix right before the Current Month’s Sales value and the suffix right after the Current Month’s Sales value with matching formatting.
As you can see in the background of this image, since US Dollars is the current selection in the parameter, there is a $ sign prefix and no suffix. If I change the parameter value to Canadian Dollars, we see a $ sign with a space before the value and no suffix.
If I choose Canadian Dollars (French), the $ sign moves to the suffix.
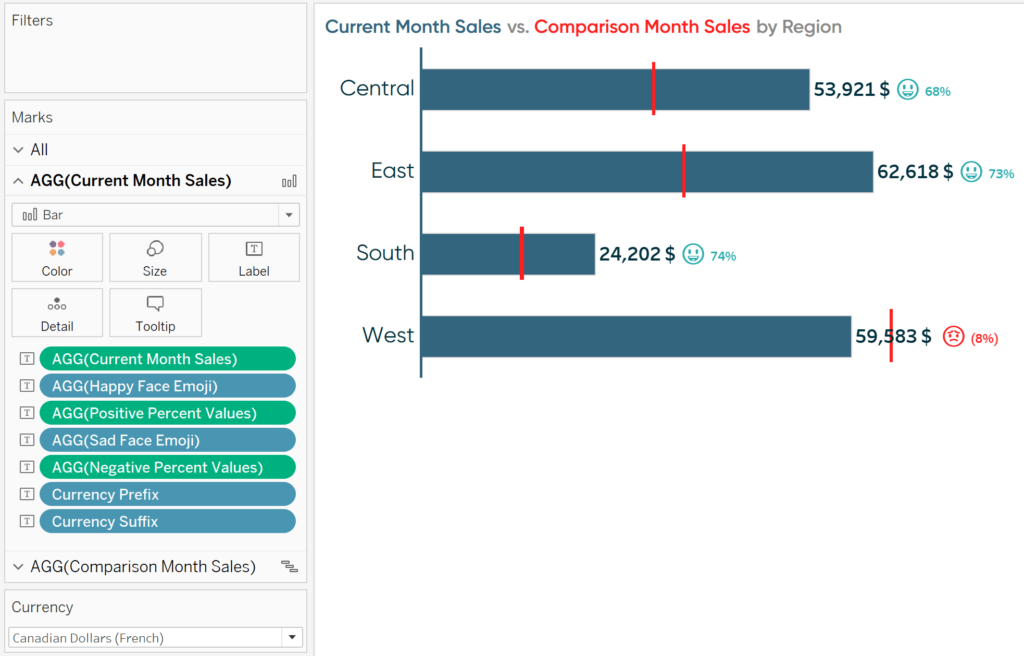
If I change the parameter value to Japanese Yen, the suffix goes away again, and we see a ¥ sign as a prefix.
For more thoughts on currency conversion, read Solutions from Tableau Training: How to Deduplicate Joined Rows.
Thanks for reading,
– Ryan


Written By
Ryan Sleeper
Related Content
How to Do Currency Conversion in Tableau with Google Sheets

With many organizations operating in different countries, the topic of currency conversion becomes more important for data visualization specialists. Despite…

Ryan Sleeper
3 ways to take command of Tableau number formatting Learn how to (1) easily format positive and negative changes with…
Ryan Sleeper
Round to Two or Four Decimals Based on Measure Values See how to dynamically round numbers to two decimals when…