Power BI Service vs Power BI Desktop

What’s the first thing you think of when you hear the words, “Power BI”? Is it Power BI Desktop or the Power BI service? Both platforms have major differences but some commonalities in functionality. Their differences are what allow both the Power BI service and Power BI Desktop to work together in harmony. The Power BI service has report and dashboard creation capabilities, but it is best known and most widely used for the publishing and sharing phase of the visual analytics process. Power BI Desktop is most widely used for data engineering and reporting. Throughout this post, we’ll discuss the important features of the Power BI service vs Desktop.
Power BI Desktop is Microsoft’s free data analysis, visualization, and reporting tool. Power BI Desktop is incredibly powerful, but it is best used in combination with the Power BI service to publish and share the reports you create in Power BI Desktop. But if you were only to use one of the two platforms, how would they fare? Power BI service vs Desktop isn’t really the best race since the platforms are designed to work together, but I think this still provides for a useful comparison.

Before we continue, an important note to make is that Power BI Desktop can be used by anyone, but your Power BI license type limits your capabilities in the Power BI service. There are three main license types: Fabric (free), Power BI Pro, and Power BI Premium Per User. Free licenses allow users to create reports and dashboards, but only for their own use. Power BI Pro and Premium Per User licenses enable users to collaborate in different workspaces, and share their work with users with the same license capabilities, or free users (limited to Premium Per User licenses).
Power BI Reports vs Dashboards
Continue reading with a free account, or login.
Unlock this tutorial and hundreds of other free visual analytics resources from our expert team.
Already have an account? Sign In
By continuing, you agree to our Terms of Use and Privacy Policy.
Power BI service
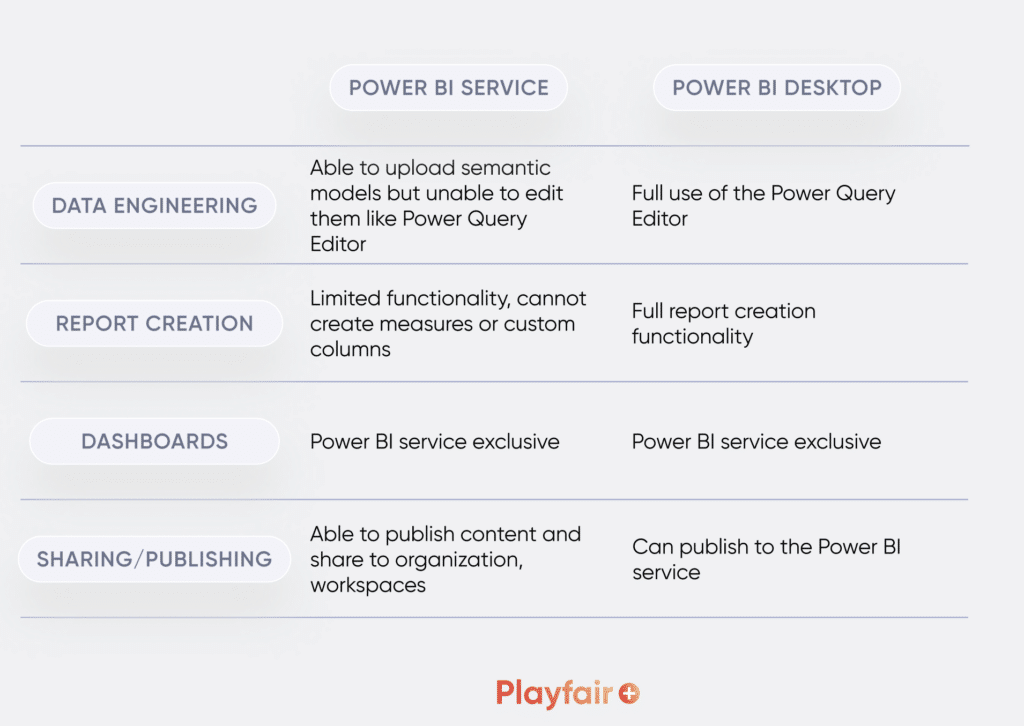
The Power BI service isn’t exactly known for its report creating capabilities, but instead, Power BI service’s true strength lies in its ability to distribute reports. One of its most useful features that enables sharing is dashboards, which is a Power BI service exclusive. Dashboards often present highlights or insights from complex reports uploaded to the service.
Since the service’s main function isn’t creating reports, it offers limited report creation and data modeling capabilities. It leaves the full report creation functionality to Power BI Desktop. The Power BI service allows you to take data, often directly from Power BI Desktop, and push it to users in your workspaces. Apart from uploading files into workspaces for you and your colleagues such as reports, data models, and creating dashboards from those files, the Power BI service allows you to create apps – packaged versions of the content you upload in workspaces. These apps can have custom permissions set and can be published to a small selected group or your entire organization.
Power BI Desktop
The free desktop application we all know and love offers robust data engineering, modeling, and visualization options. The Power Query Editor is incredibly powerful, and being able to edit queries in the middle of your analysis instead of having to open a different platform to edit and then reupload your data is an underrated capability. In Power BI Desktop, you can use the DAX language to its fullest. Utilizing DAX allows you to create measures and custom columns – features that are not available in the Power BI service. Additionally, utilizing the Power Query M formula language allows you wide customization options for your data in the Power Query Editor. Apart from DAX and M, another area where Power BI Desktop excels is being able to create visuals using Python scripts directly in Desktop. On the visual side of things, you can import custom report themes into Power BI Desktop in JSON format.
Tableau vs. Power BI: A Quick Start Guide Comparison
Now that we’ve discussed features limited to the Power BI service and Power BI Desktop, what are things that both platforms can do?
Both the Power BI service and Power BI Desktop can create reports with different visualizations and filtering options. Both the service and Desktop allow you to implement row level security to restrict access. The last main thing that they can both do is allow you to easily share your creations. While the service is specifically designed with sharing in mind, you can always save and send .pbix files from Power BI Desktop.
A good way to compare the uses of the Power BI service vs Desktop is to ask yourself, what are you using the Power BI platform for? If you’re looking for the ability to create complex and fully customized reports, Power BI Desktop may be best for you. If your end goal is a fairly simple report or dashboard that doesn’t have a lot of customization but requires distribution on a wider level, you likely will find yourself using the Power BI service. If you want to create a report that is very complex and also needs to be distributed to a wider audience, you’ll make use of both Power BI Desktop and the Power BI service.
Who are you?
Are you an analyst looking for interesting data to help explain behavior? Are you a C-level executive looking for quick insights to provide direction to the business? How you use the Power ecosystem depends on your role and your needs.
Vital Question 1: Who is the Audience?
As an analyst, you’re more likely to spend your time in Power BI Desktop, which will allow you to engineer data to fit your needs with the Power Query Editor, create complex measures in DAX, and bring visuals together to tell a story for your stakeholders. Once you’ve finished creating a report and are ready to hand it off, you’ll likely upload your report into the Power BI service for coworkers, or anyone with appropriate workspace access, to view.
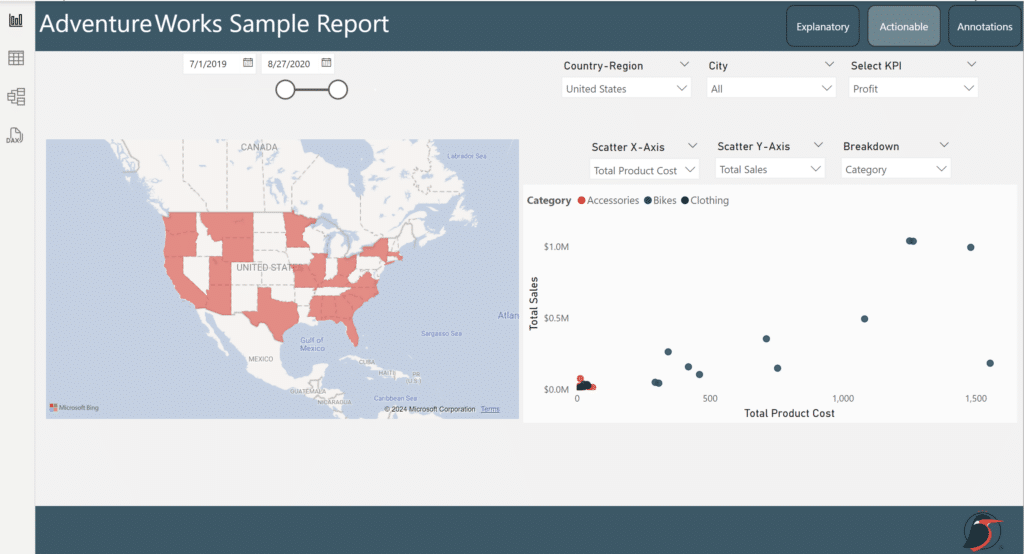
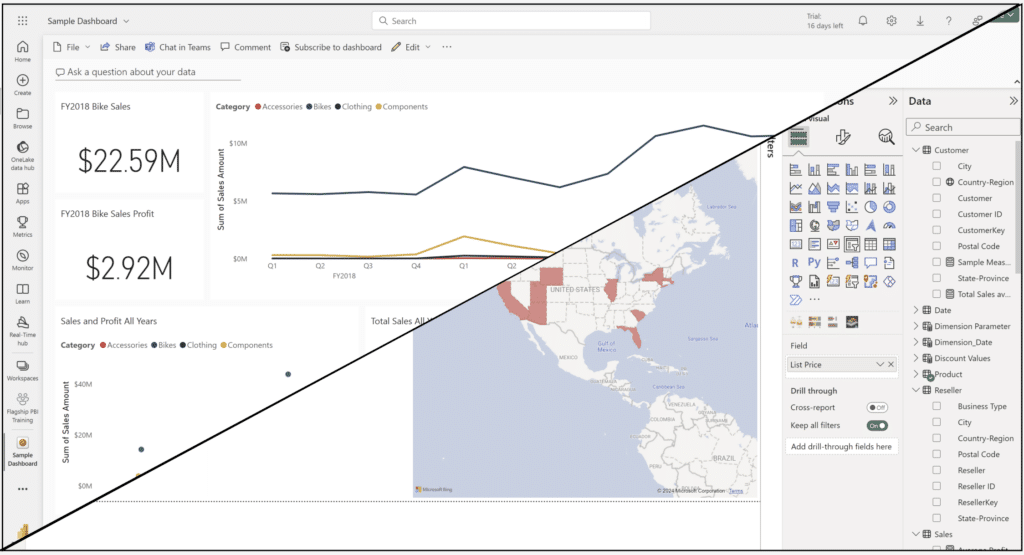
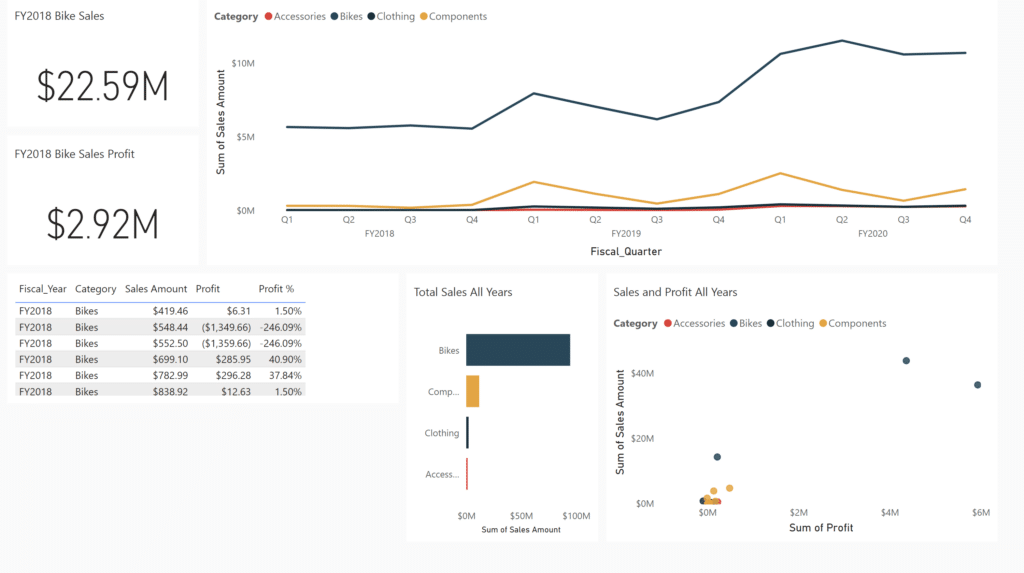
This is a report you might create in Power BI Desktop as an analyst to generate useful insights to push to coworkers and management. An executive likely won’t have visibility to inner workings of this report, but rather only the high-level results seen in the report itself.
If you’re higher up on the analytics ladder and need insights, you’re likely more of a viewer than a creator. You’ll likely have access to organizational workspaces and will look at the finalized product, be it a semantic model, report, dashboard, or app to direct your business.
While these use cases are relatively simplified, they emphasize the important features of the Power BI service and Power BI Desktop. Both are very solid tools, but when you harness the best of both worlds, you’re able to create and publish to your heart’s (or organization’s) content.
Thanks for reading,
Juan Carlos Guzman

Written By
Juan Carlos Guzman

Peer Review
Matt Snively
Sr. Manager, Analytics Engineering
Related Content
An Introduction to the Power BI Power Query Editor
With the Power BI Power Query Editor, the data engineering world is at your fingertips. You can shape data to…
An Introduction to Parameters in Power BI
Parameters are user-generated values that define how a system can operate. We can use parameters in Power BI to grant…
3 Ways to Make Beautiful Bar Charts in Power BI
Despite many new challengers over the years in the world of data visualization, bar charts have remained one of the…