Simple Fonts: Mastering Font Essentials in Figma

Choosing the right font or combination of fonts can significantly influence the overall style and perception of your dashboards. The typeface you choose for a business dashboard will likely not be the same as the one you would choose for a dashboard about your favorite horror movies or the history of the printing press. There are even long-running memes about fonts and font choices (just Google “Comic Sans memes” if you don’t know what I’m talking about).
Additionally, the styling you apply to your font can make a big impact. Is the text bold or italicized? What size are the titles? Is the data visualization text condensed or spacious? By the end of this post, you’ll learn the essentials for choosing typefaces and utilizing them in Figma to create dashboards where simple fonts are an asset rather than a distraction.
Quick start guide to font terminology
Before we get into Figma, let’s clarify some key terms related to fonts. A typeface, sometimes called a font family, includes a unified design of letters, numbers, and symbols such as punctuation marks that are suitable for print or digital applications. Examples of typeface include Times New Roman, Arial, or Calibri. For instance, the brand typeface for Playfair Data is Gilroy.
![]()
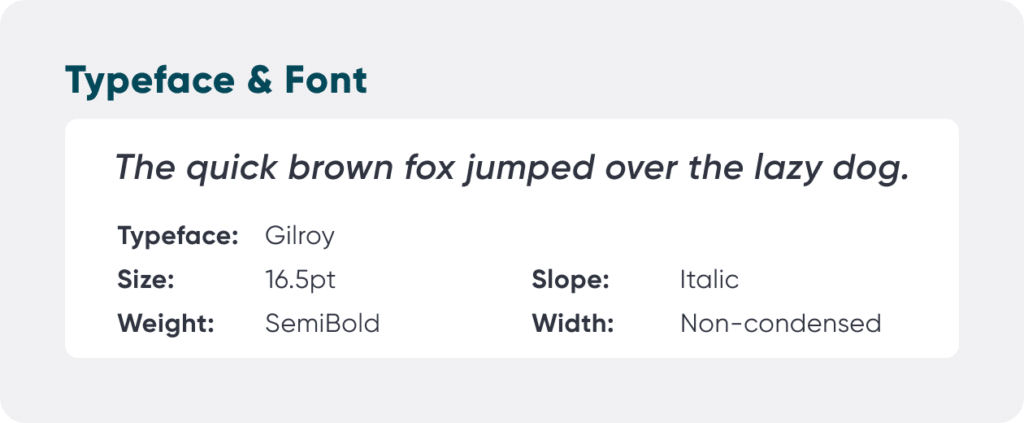
A font is part of a typeface or font family, and includes specifications such as size, weight, slope, and width. So Gilroy is the typeface, while Gilroy 18pt SemiBold Italic represents a specific font within that typeface. However, in everyday language the terms “typeface” and “font” are used interchangeably, which is the case in this post.
Create a free account, or login.
Unlock this tutorial and hundreds of other free visual analytics resources from our expert team.
Already have an account? Sign In
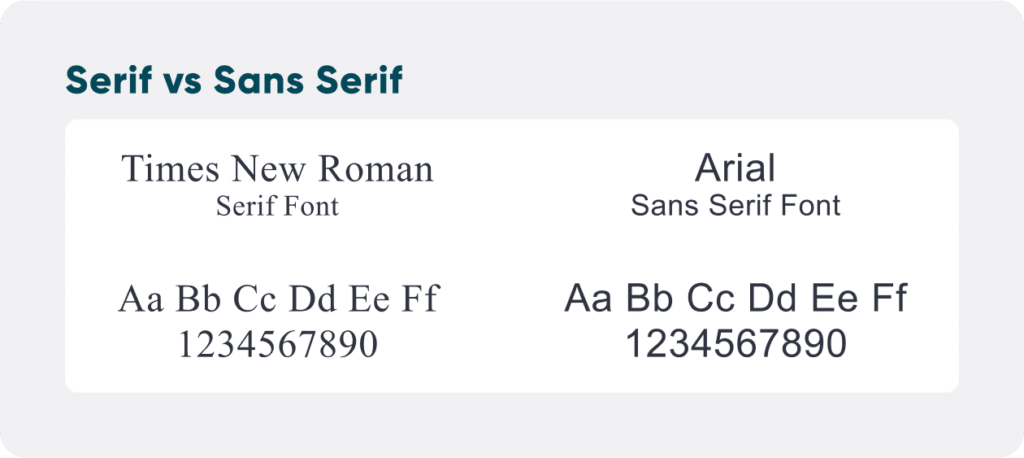
Additionally, you may find the terms “serif” and “sans serif” in discussions of fonts. Every typeface can be classified into one of these two categories. “Serifs” refer to the small strokes at the ends of letters, numbers, and symbols, while a “sans serif” typeface does not have these strokes. Times New Roman is an example of a serif typeface, whereas Arial is an example of a sans serif typeface. Sans serif fonts have gained popularity in design in recent years, and are often associated with modernity, simplicity, and clarity. Major companies like Apple, Google, and Microsoft utilize sans serif fonts in their branding.
Picking a font: Simple fonts work best
In some cases, you might not have to worry about choosing a font for your dashboard project. Many companies usually have a designated font or font pair documented in their brand guidelines. However, there are instances where you may have the freedom to choose the fonts you’d like to use. There is a caveat to consider – if your dashboard is intended to be viewed in Tableau Public, Tableau Cloud, or Power BI, only certain fonts will display as expected. For your convenience, here’s a list of web-safe fonts for Tableau Public / Cloud and web-safe fonts for Power BI.
So, what does this mean for you? While you have the freedom to choose any font you like to create your image assets in Figma, such as a background architecture for the dashboard, all fonts used in Tableau need to be one of the web-safe options, otherwise they will not render as expected. Given this, consider which fonts will complement the web-safe font you’ve selected. Alternatively, you can opt to use a web-safe font for your entire design, such as Arial, Calibri, or Times New Roman. A good rule of thumb is that simple fonts tend to offer the best results.
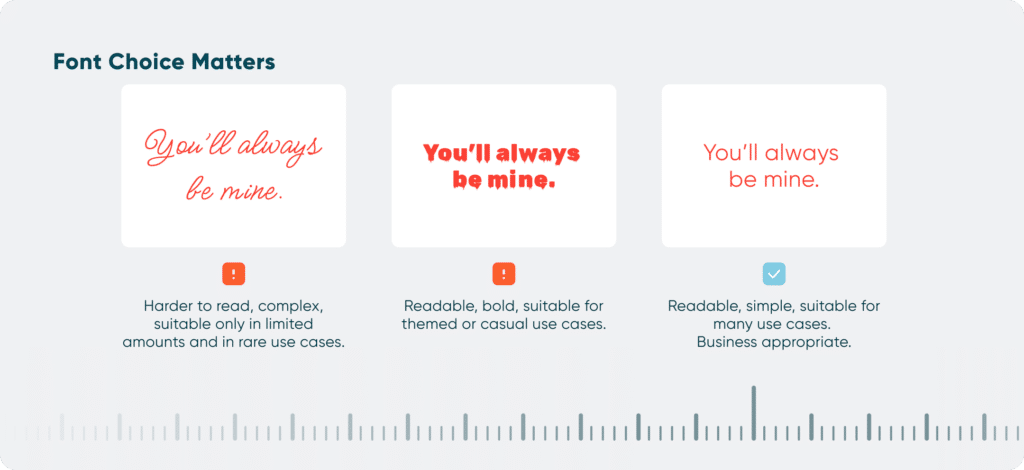
In addition to the look and feel of your dashboard, prioritize readability and accessibility of your font. Scripts, calligraphy, and heavily embellished fonts are often hard to read and may discourage viewers from taking more than a glance at your dashboard. If you do want to use an elaborate font, consider limiting its use to the dashboard title and in a size that ensures easier readability.
Generally, sans serif fonts complement serif or script fonts well. I recommend using sans serif for the bulk of your dashboard, and reserving serif or more decorative fonts for titles, subtitles, and special callouts. Once you’ve selected your font, I strongly encourage you to develop a typographic hierarchy so that your dashboard is polished and cohesive.
How to Design a Typographic Hierarchy in Tableau
Text properties in Figma
Now, let’s dive into Figma. In addition to selecting the font family, Figma allows you to adjust the fonts in your designs using the Text properties panel located in the right sidebar.
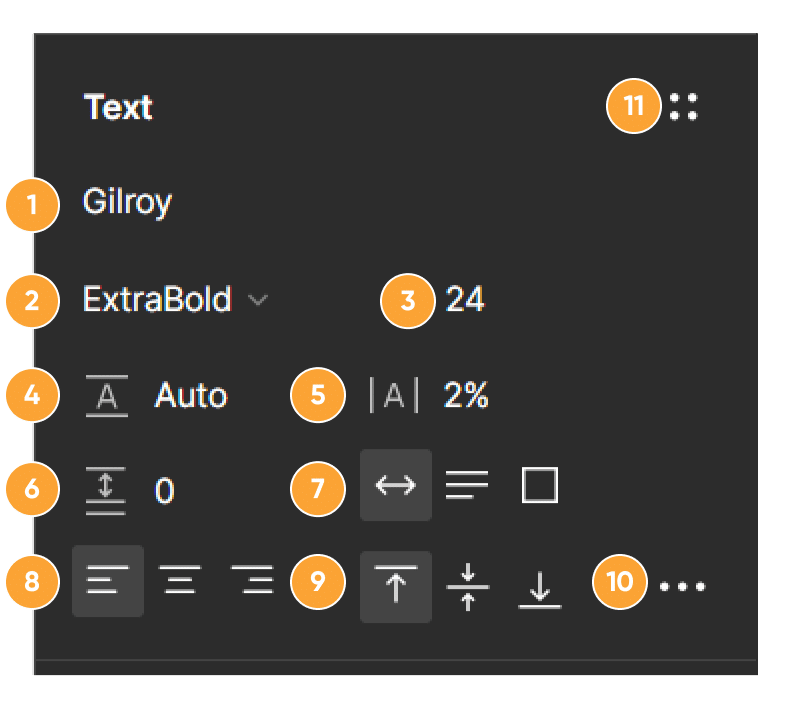
- Type: Choose from a list of font families.
- Text style: Use the dropdown to choose the weight of your text.
- Text size: Use the dropdown to choose the size of your text. Important Note! Figma sizes text in pixels (px), not points (pt) which are used for text size in software like Tableau and Power BI. Pixels are not the same as points, so size 12pt text is equivalent to size 16px. For this reason, I do not recommend designing with a text size smaller than 12px in Figma, which equates to 9pt font.
- Line height: Adjust the vertical distance between text lines. This is useful for creating a dashboard that either feels more or less condensed, depending on your use case.
- Letter spacing: Adjust the distance between letters. This is especially useful if your font family does not include a condensed font option.
- Paragraph spacing: Adjust the vertical distance between paragraphs.
- Adjust how text wraps or overflows within a container.
- Text alignment: Choose whether the text is left, center, or right aligned within the text box.
- Choose the vertical alignment of the text within the text box.
- Type settings: Open the type settings panel for more detailed editing.
- Styles: Allows you to create, view, or apply a text style. We will cover text styles in greater detail later in this post.
To make additional adjustments to the text, you can use the Type Settings panel to reveal the following settings:
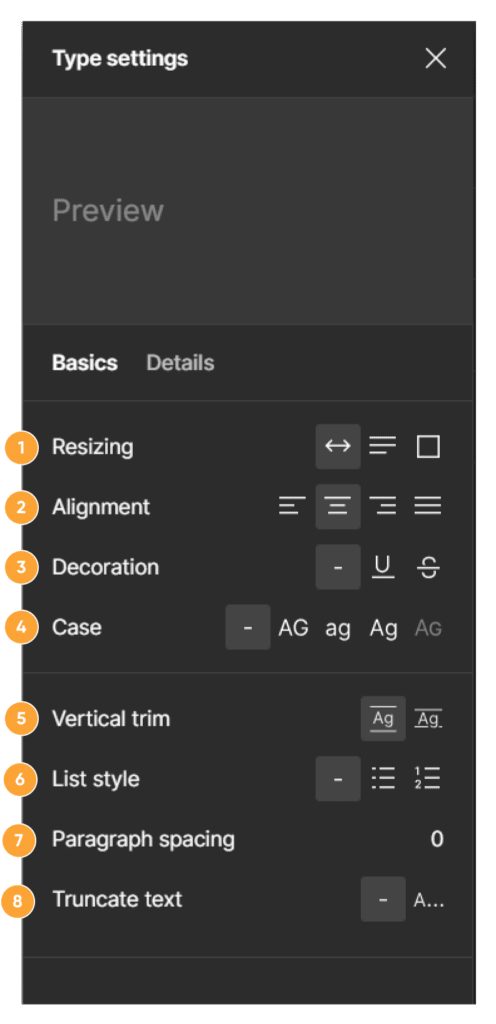
- Resizing: Adjust how text wraps or overflows within a container.
- Alignment: Choose whether the text is left, center, or right aligned within the text box.
- Decoration: Add an underline or strikethrough to text.
- Case: Choose whether your text is uppercase, lowercase, capitalized, or small caps.
- Vertical trim: This removes the extra space above and below text. Important Note! I recommend applying a vertical trim when you need icons or other visuals to align with text.
- List Style: Apply bulleted or numbered list formatting.
- Paragraph Spacing: Adjust the vertical distance between paragraphs.
- Truncate text: Choose to hide overflow content. This can be beneficial to show stakeholders what long strings would look like in a dropdown or a condensed table.
While the flexibility of Figma can initially be daunting, relying on brand guidelines and typographic hierarchies can streamline the text adjustment process. And remember, simple fonts won’t let you down.
Text styles in Figma
Once you’ve selected your font(s) and established a typographic hierarchy, Figma makes it easy to use fonts consistently with the text styles feature. You can create a text style for each element in your hierarchy, such as titles, subtitles, body copy, table headers, axis labels, or tooltips.
![]()
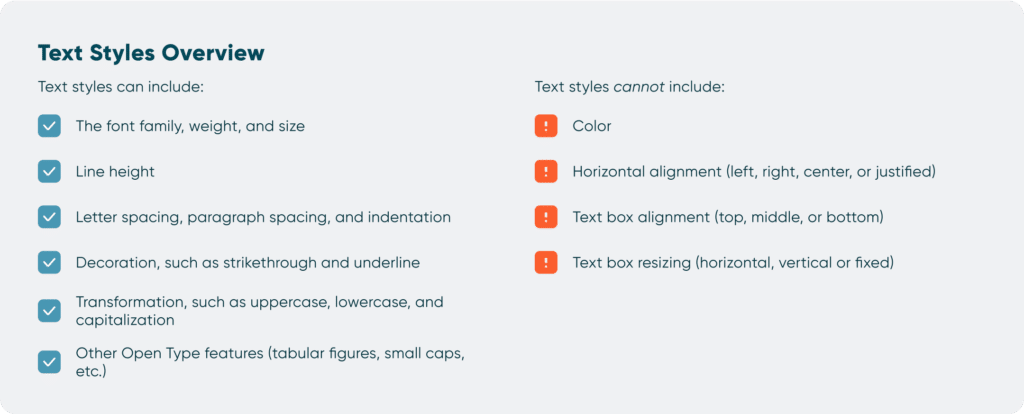
Each time you add one of these elements, simply apply the text style you’ve already created – there’s no need to manually reapply or try to remember the font settings each time. However, it is important to note that only some features can be included in a text style. Below, I’ve outlined what is and what is not included:
Why bother creating text styles in Figma? First, it will save you so much time. By applying text styles throughout your wireframe, you can swiftly make adjustments. Maybe a stakeholder comes back to tell you that they want to use Arial instead of Roboto. Or perhaps you discover that the original font combination you picked doesn’t mesh as well as you thought. Simply change the text style, and all the text with that associated style will change in one sweep. That certainly beats editing each text box individually! Second, using text styles that come from a typographic hierarchy is a big step towards ensuring your dashboard appears polished and carefully crafted. Consistency across titles, headers, and other text elements create cohesion and foster trust in your dashboard. 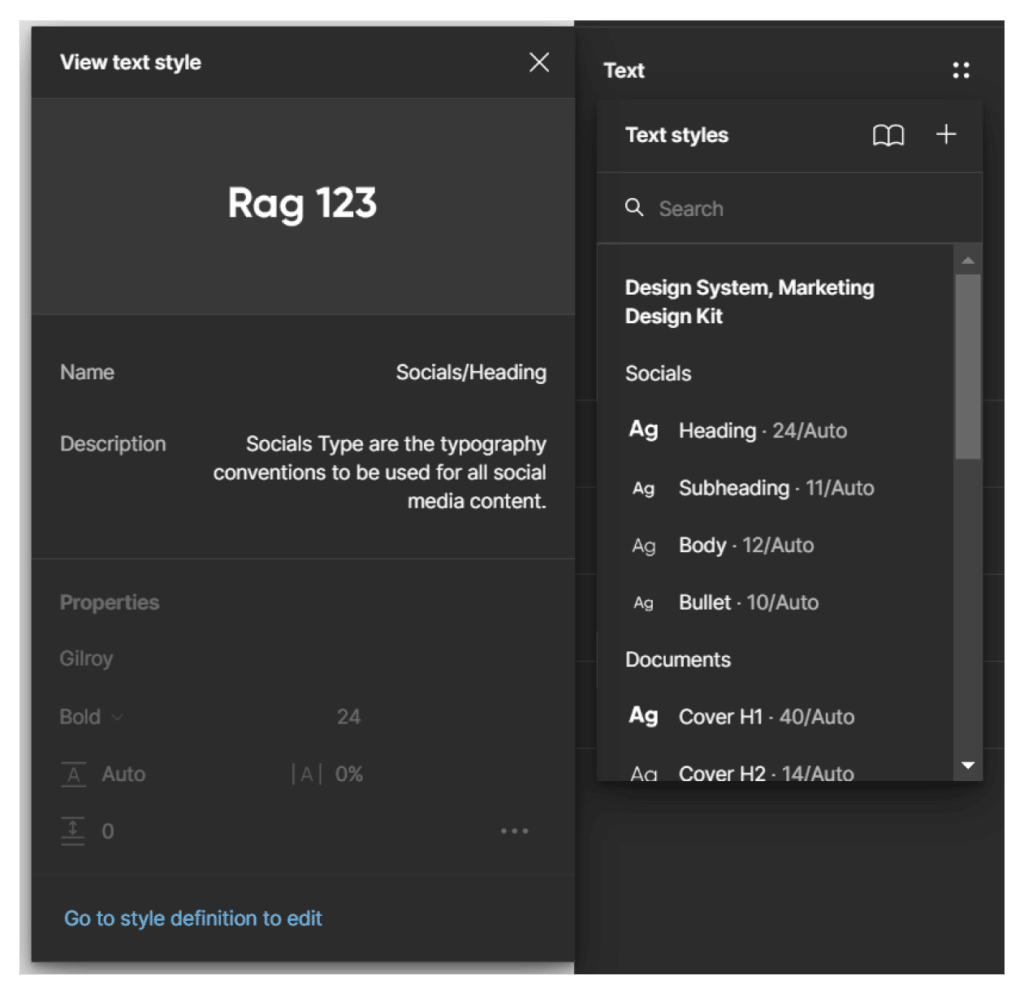
How to Create Better Dashboard Layout Designs with Figma
We’ve only just scratched the surface with fonts, not to mention what is possible in Figma. Stay tuned for future posts on design and Figma!
Happy vizzing,
Alyssa

Written By
Alyssa Huff

Peer Review
Rafael Simancas
Sr. Manager, Brand Strategy

Peer Review
Jason Penrod
Director, Information Design
Related Content
Applying Gestalt Principles to Dashboard Design
Have you ever heard the Gestalt Principles referenced when people are talking about data visualization or design? The Gestalt Principles…
How to Design a Typographic Hierarchy in Tableau
For most Tableau authors, typography is not the first thing they think about when they develop a dashboard, let alone…
3 Reasons to Learn Figma as a Data Analyst

Figma isn’t just for designers. If you’re a data engineer, analyst, Tableau / Power BI user who has been curious…