Dashboard Element 4: The Global Filters Tab
I often see corporate Tableau “dashboards” built with nothing more than a large text table and a dozen or more filters along the top or side of the crosstab. Sadly, I’d even go as far to say that this is what the majority of dashboards look like when I enter a new engagement. While there is some value in using Tableau purely as a querying tool – most notably the way this type of view helps validate raw data – it misses the point of how data visualization can help us analyze data.
So how do we get users to evolve past the three-decade-old, Excel-like views? If I have stakeholders that simply can’t let go of filters seven and above, I like to build in a dashboard element I call the global filters tab. This feature helps prioritize filters, but also provides the flexibility to access lesser-used filters. This post will show you how to create a global filters tab in Tableau so you can keep your dashboards clean while keeping your stakeholders happy.
This is the fourth in a five-part series about my go-to elements of Tableau dashboards. For future updates, subscribe to our mailing list.
Tableau Dashboard Element: The Global Filters Tab
How to make a global filters tab in Tableau
I’m a minimalist when it comes to dashboard design. I work hard to maintain focus and prioritize only the most pertinent elements for each individual view. For this reason, I actually don’t have a public corporate example of a global filters tab to share with you. So we will add one to the Descriptive dashboard in the Super Sample Superstore workbook.
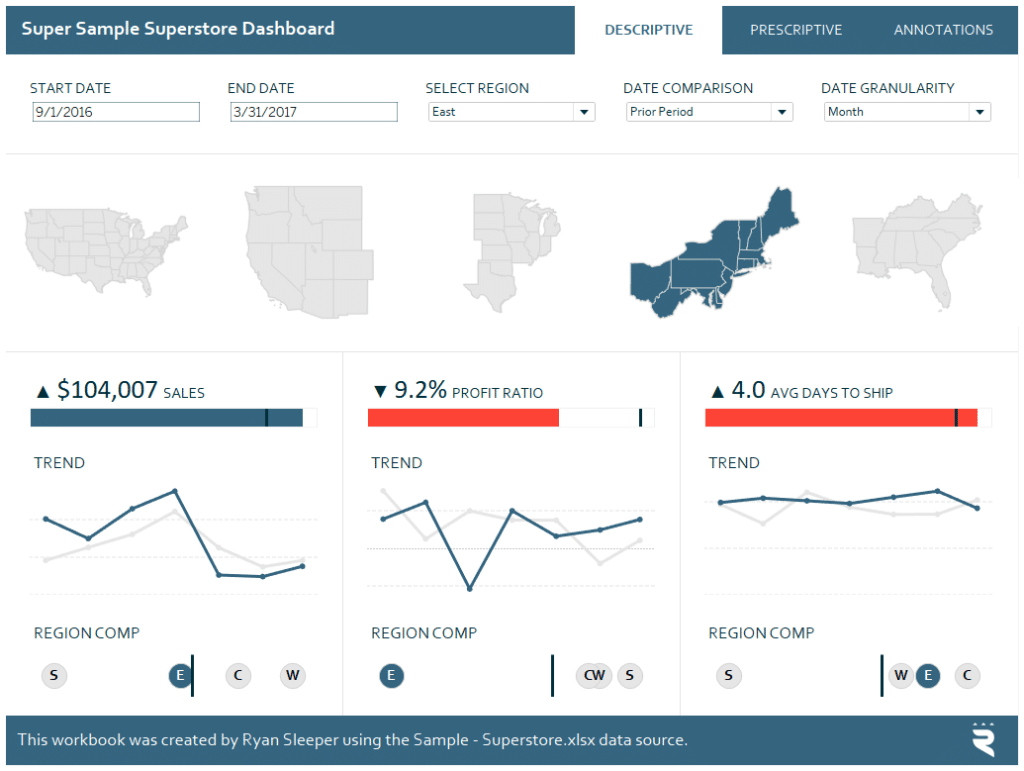
As you can see on the filters row, there are five parameter controls that are being used to filter the view. Let’s say in addition to filtering the date range, region, and comparison period, our stakeholder requested that we add ten more filters: Customer Name, Segment, Ship Date, Country, State, Returned, Ship Mode, Category, Sub-Category, and Product Name.
I hope you laughed at that because this does happen. I don’t know about you, but I’m not muddying up this beautiful dashboard by forcing ten more filters onto it. Instead, we will create a global filters tab; this acts as a proverbial rug to sweep all of our dirt under.
To create a global filters tab, start a new worksheet and put anything on the Text Marks Card. For such occasions where the dimension is completely arbitrary, I like to create a calculated field called “Blank” that contains just two quotation marks (“”).
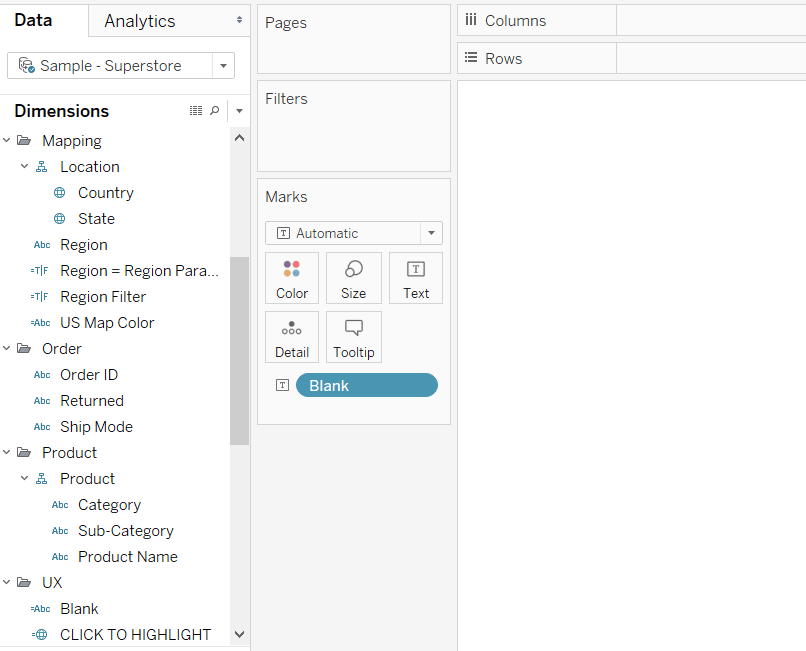
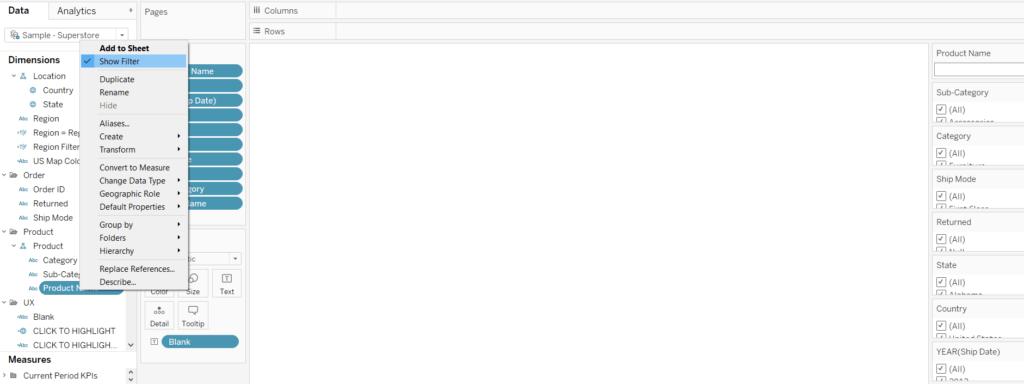
Once you have something on the view, right-click on each field you would like to filter by, and choose “Show Filter”.
Create a free account, or login.
Unlock this tutorial and hundreds of other free visual analytics resources from our expert team.
Already have an account? Sign In
By default, all of the filters will be shown along the right side of the worksheet in their default format. You can re-order these filters, place them in different locations on the worksheet, and/or change their format to your liking.
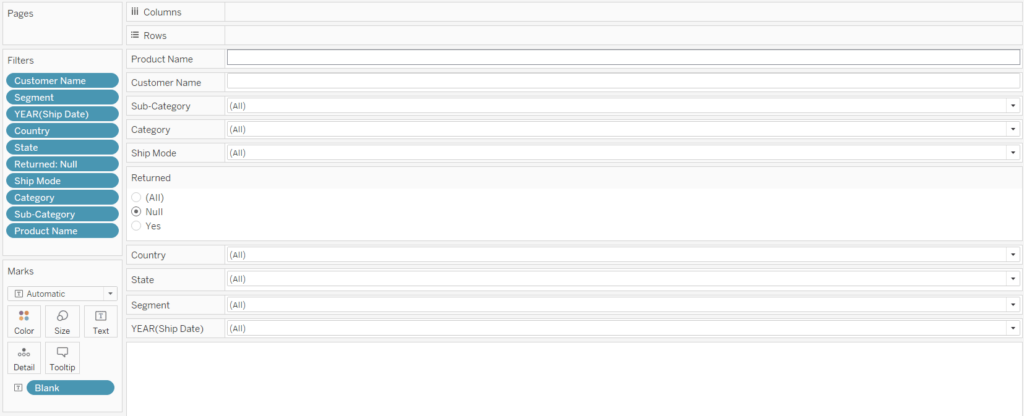
Next, ensure all of the filters are global by right-clicking each one on the Filters Shelf, hovering over “Apply to Worksheets”, and choosing “All Using Related Data Sources” (or “All Using This Data Source”).
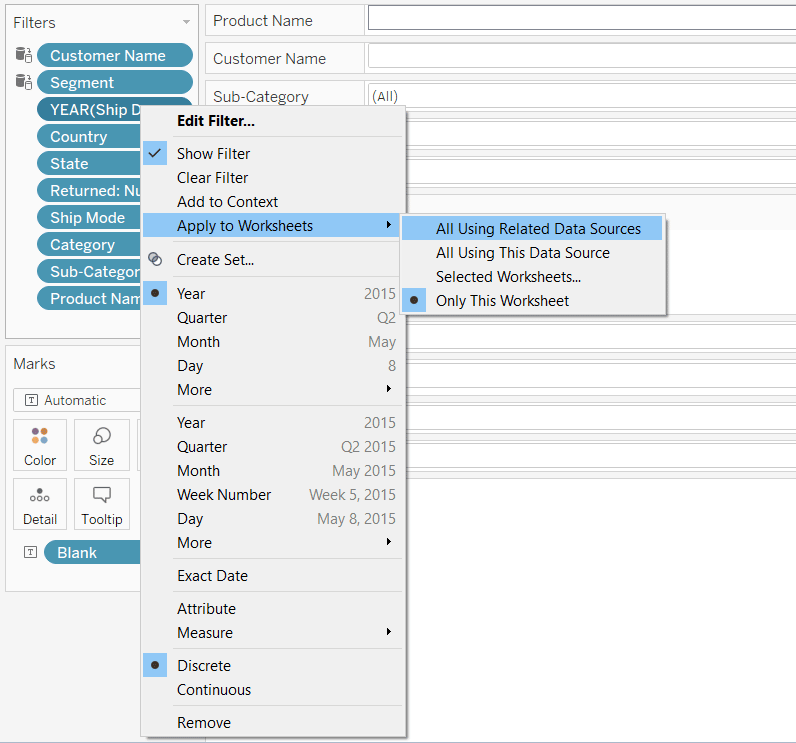
Now when any filter is changed on this tab, it will filter every individual worksheet in this workbook. To link this global filters tab to the dashboard, I’ll use the tactic outlined in the post, How to Add a Button to a Tableau Dashboard.
Note that buttons will get better very soon in Tableau 2018.3, but this method still provides the most flexibility. The steps are:
Create a new worksheet and put something on the Text Marks Card; again, I like to use the Blank dimension here. Once something is on the Text Marks Card, you can modify the text to say whatever you want. I’ll put a call to action that explains what will happen when the user clicks on the button.
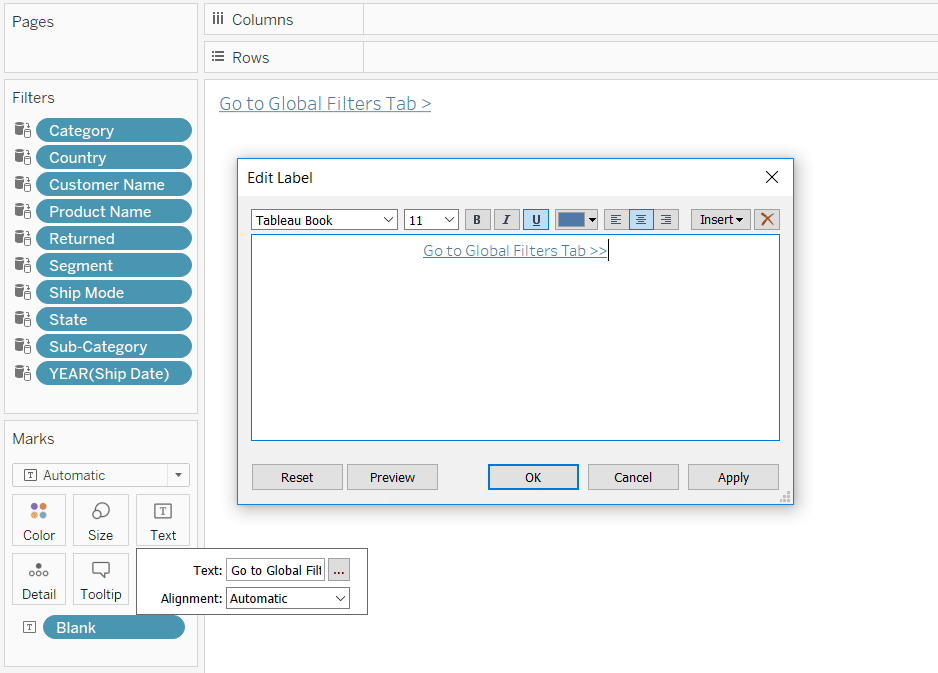
Next, place the newly created worksheet wherever you would like on your dashboard.
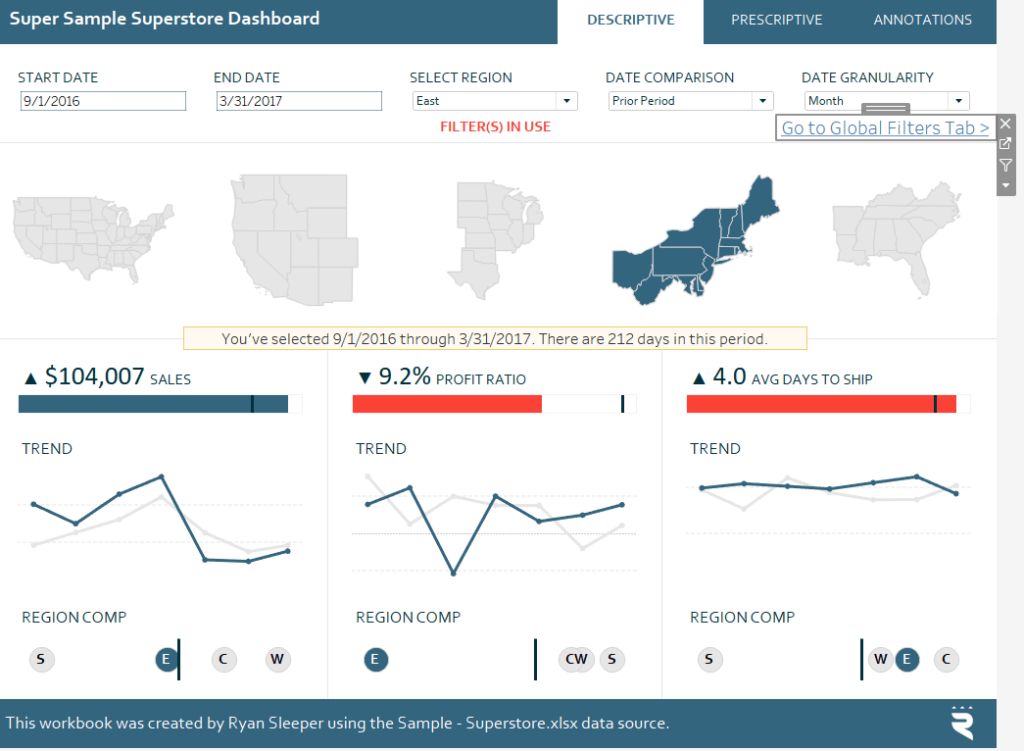
Lastly, add a Filter dashboard action that will navigate the end user from the dashboard to the global filters tab when they click on the new button.
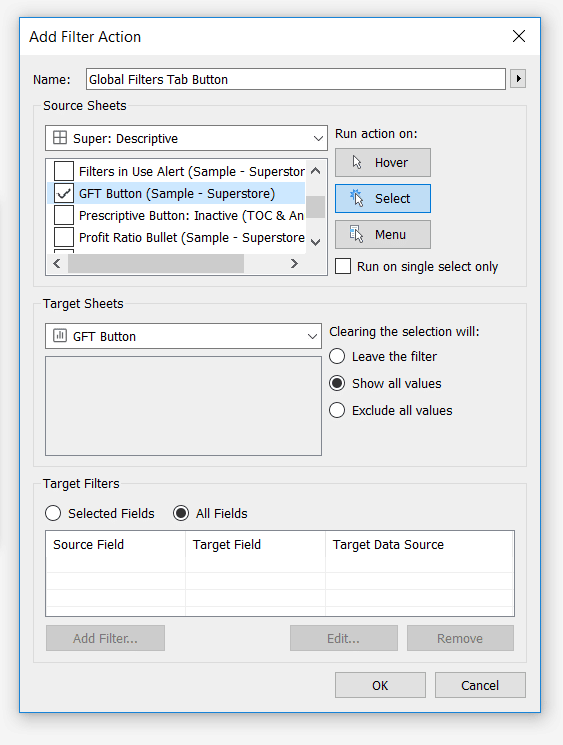
Now when a user clicks the Go To Global Filters Tab “link”, they are redirected to the Global Filters tab. Of course, you can set this dashboard action to execute on hover or menu. If this tactic is particularly relevant to you, you can always take my Global Filters worksheet a step further and make it into a nicely formatted dashboard of its own.
Thanks for reading,
– Ryan
Related Content
3 Innovative Ways to Use Filters in Tableau
Tableau filters are a dashboard engineer’s best friend. They help us convey a story, enhance the user experience and stay…
Ryan Sleeper
Link Tableau dashboards with a seamless navigation menu This video shows you how to create a user-friendly navigation experience by…
The Definitive Guide to Buttons in Tableau
The Button. Seemingly simple — yet so powerful. As humans, we are well versed in buttons and have been trained…

