3 Ways to Drop the Mic with Drop Lines in Tableau

When Playfair Data does visual analytics consulting, we always strive to reduce the time to insight, increase the accuracy of insight, and make data more engaging. A little-known feature in Tableau Desktop, drop lines, accomplishes all three by drawing a line from a data point to its value on a y and/or x-axis. However, default Tableau drop lines come with several limitations including they (1) do not work on Tableau Cloud / Tableau Server / Tableau Public, (2) have restricted formatting options, and (3) can only be dynamically turned on by clicking (and not hovering).
This tutorial will show you how to turn on Tableau drop lines, but also some tips and tricks to help you get around every one of these limitations. That’s right – Tableau drop lines that work on Tableau Server / Public / Cloud, have unlimited formatting options, and can be activated just by hovering over data points.
By the end of this post, you will be able to draw drop lines from marks on a line graph to the performance value on the y-axis and date on the x-axis. This approach adds precision to any analysis looking at trends over time, such as a stock’s performance.
How to add Tableau Drop Lines
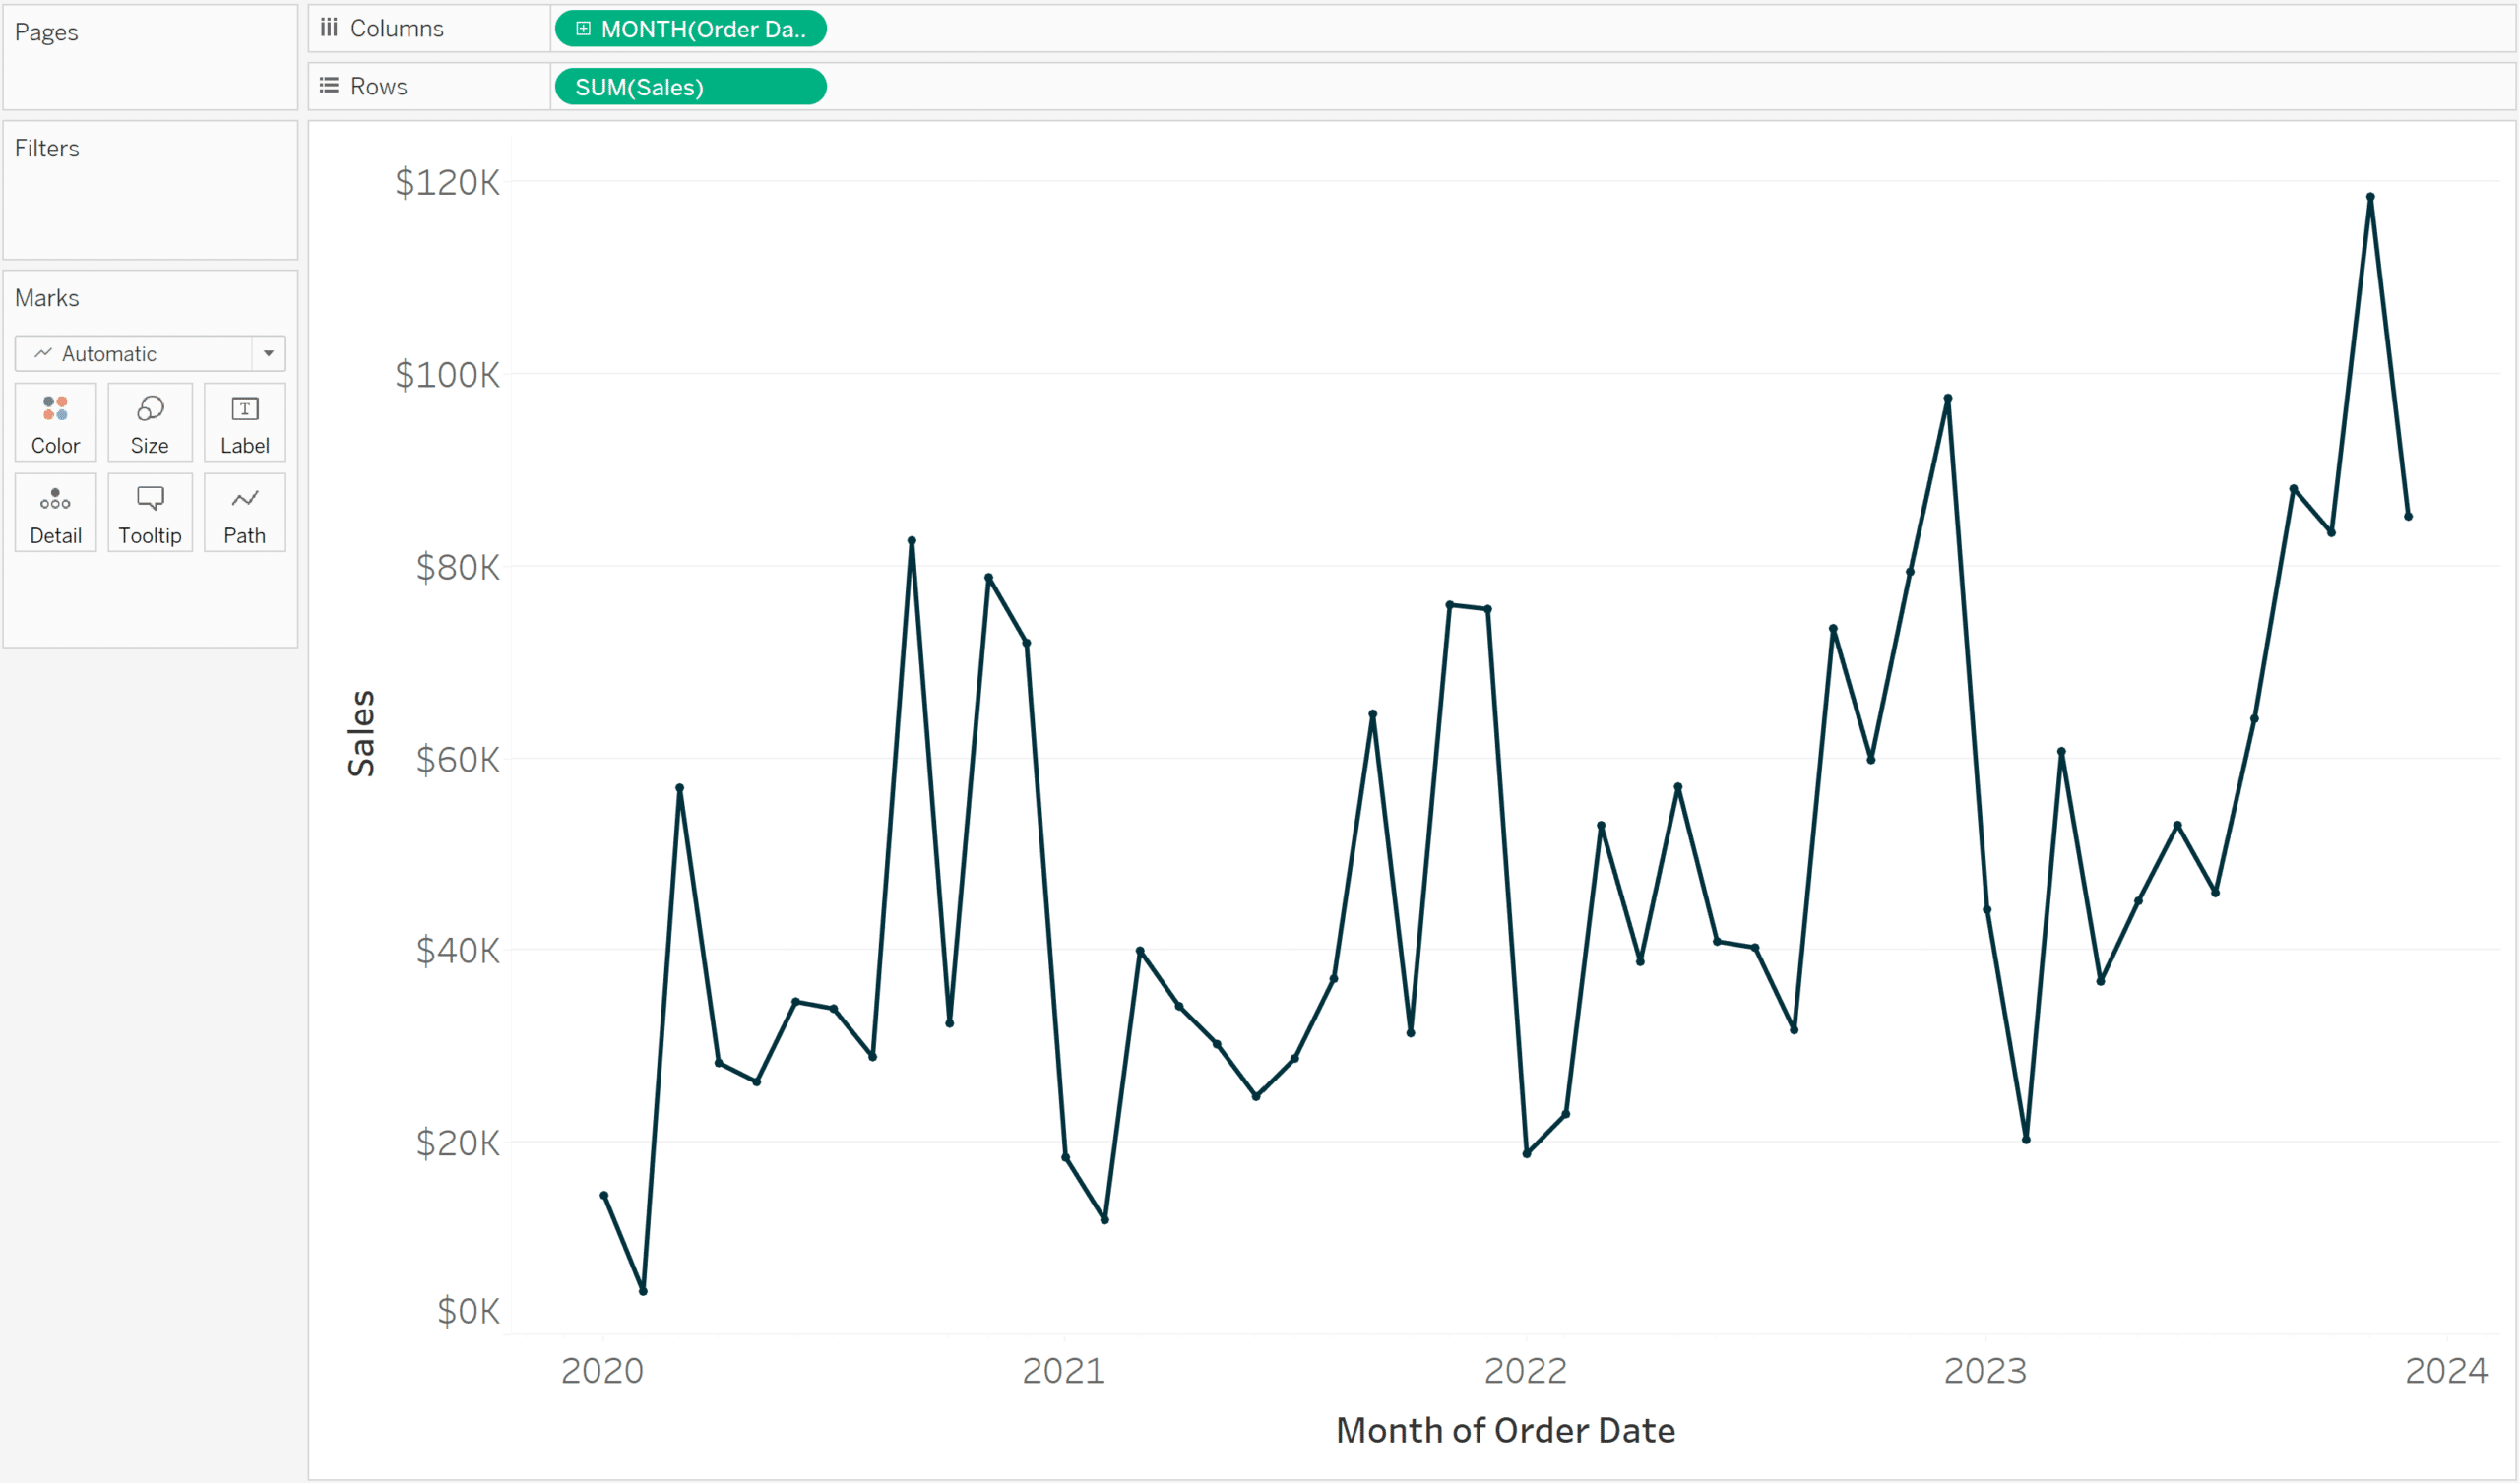
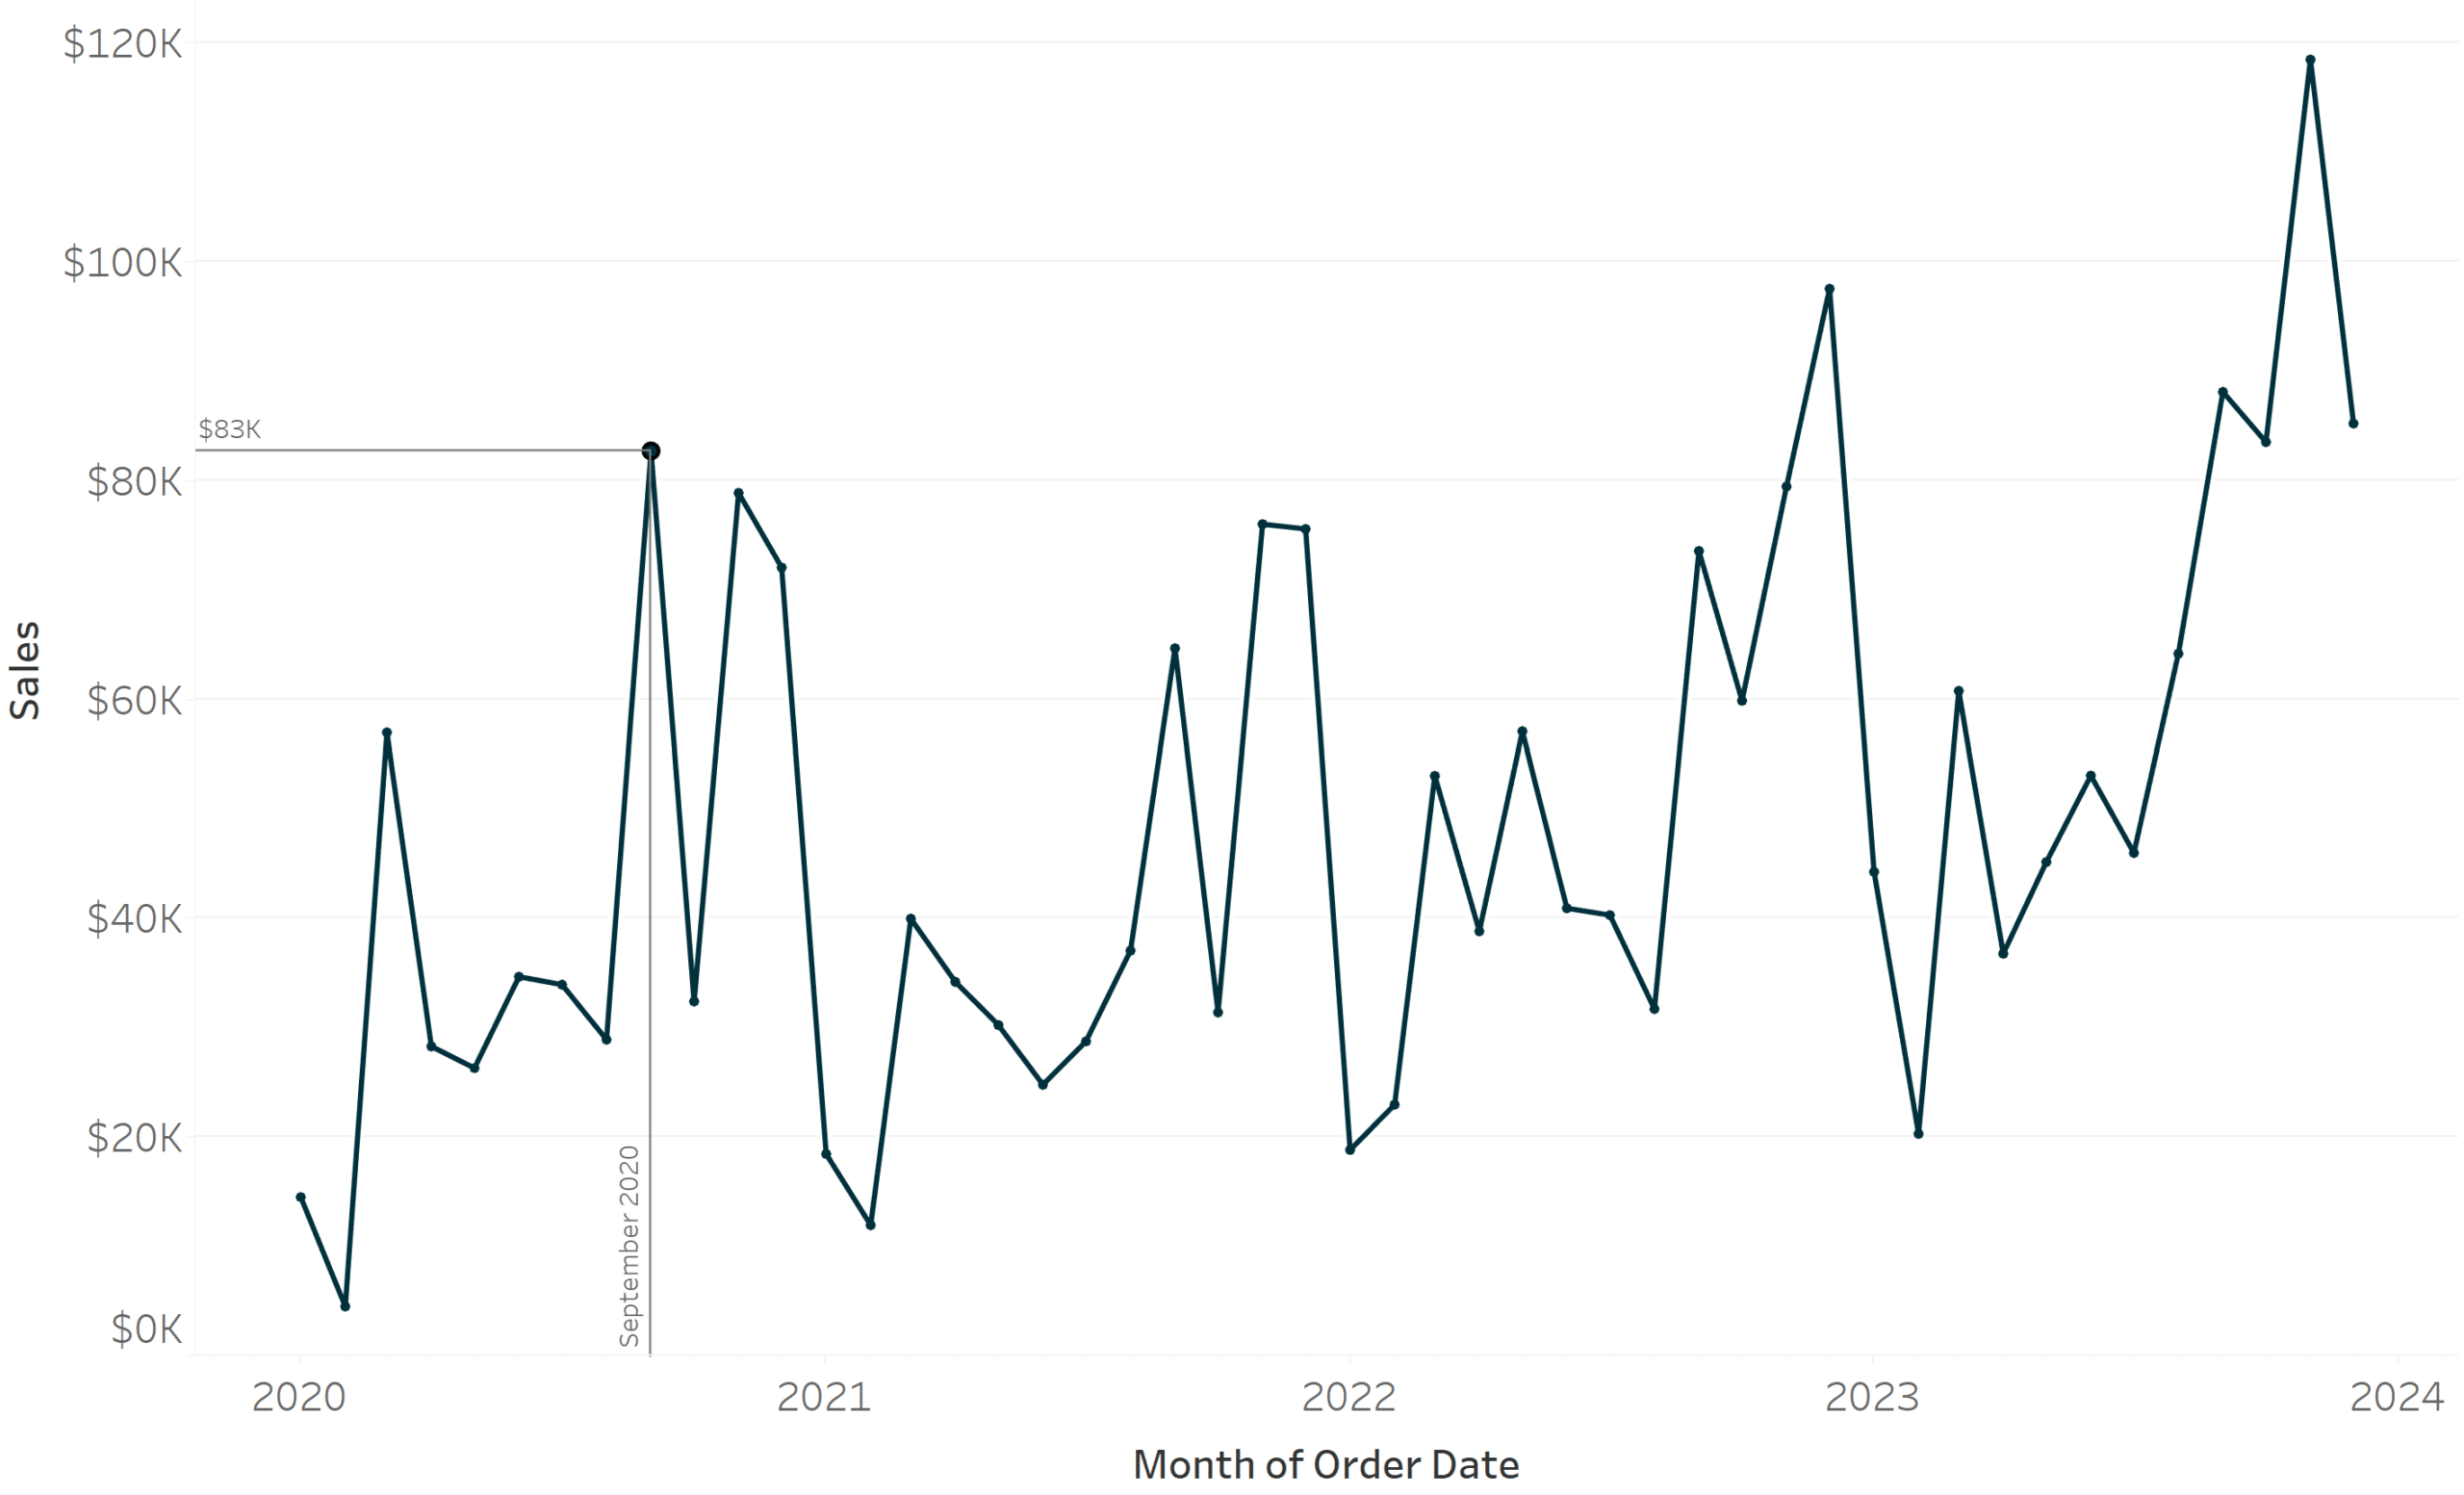
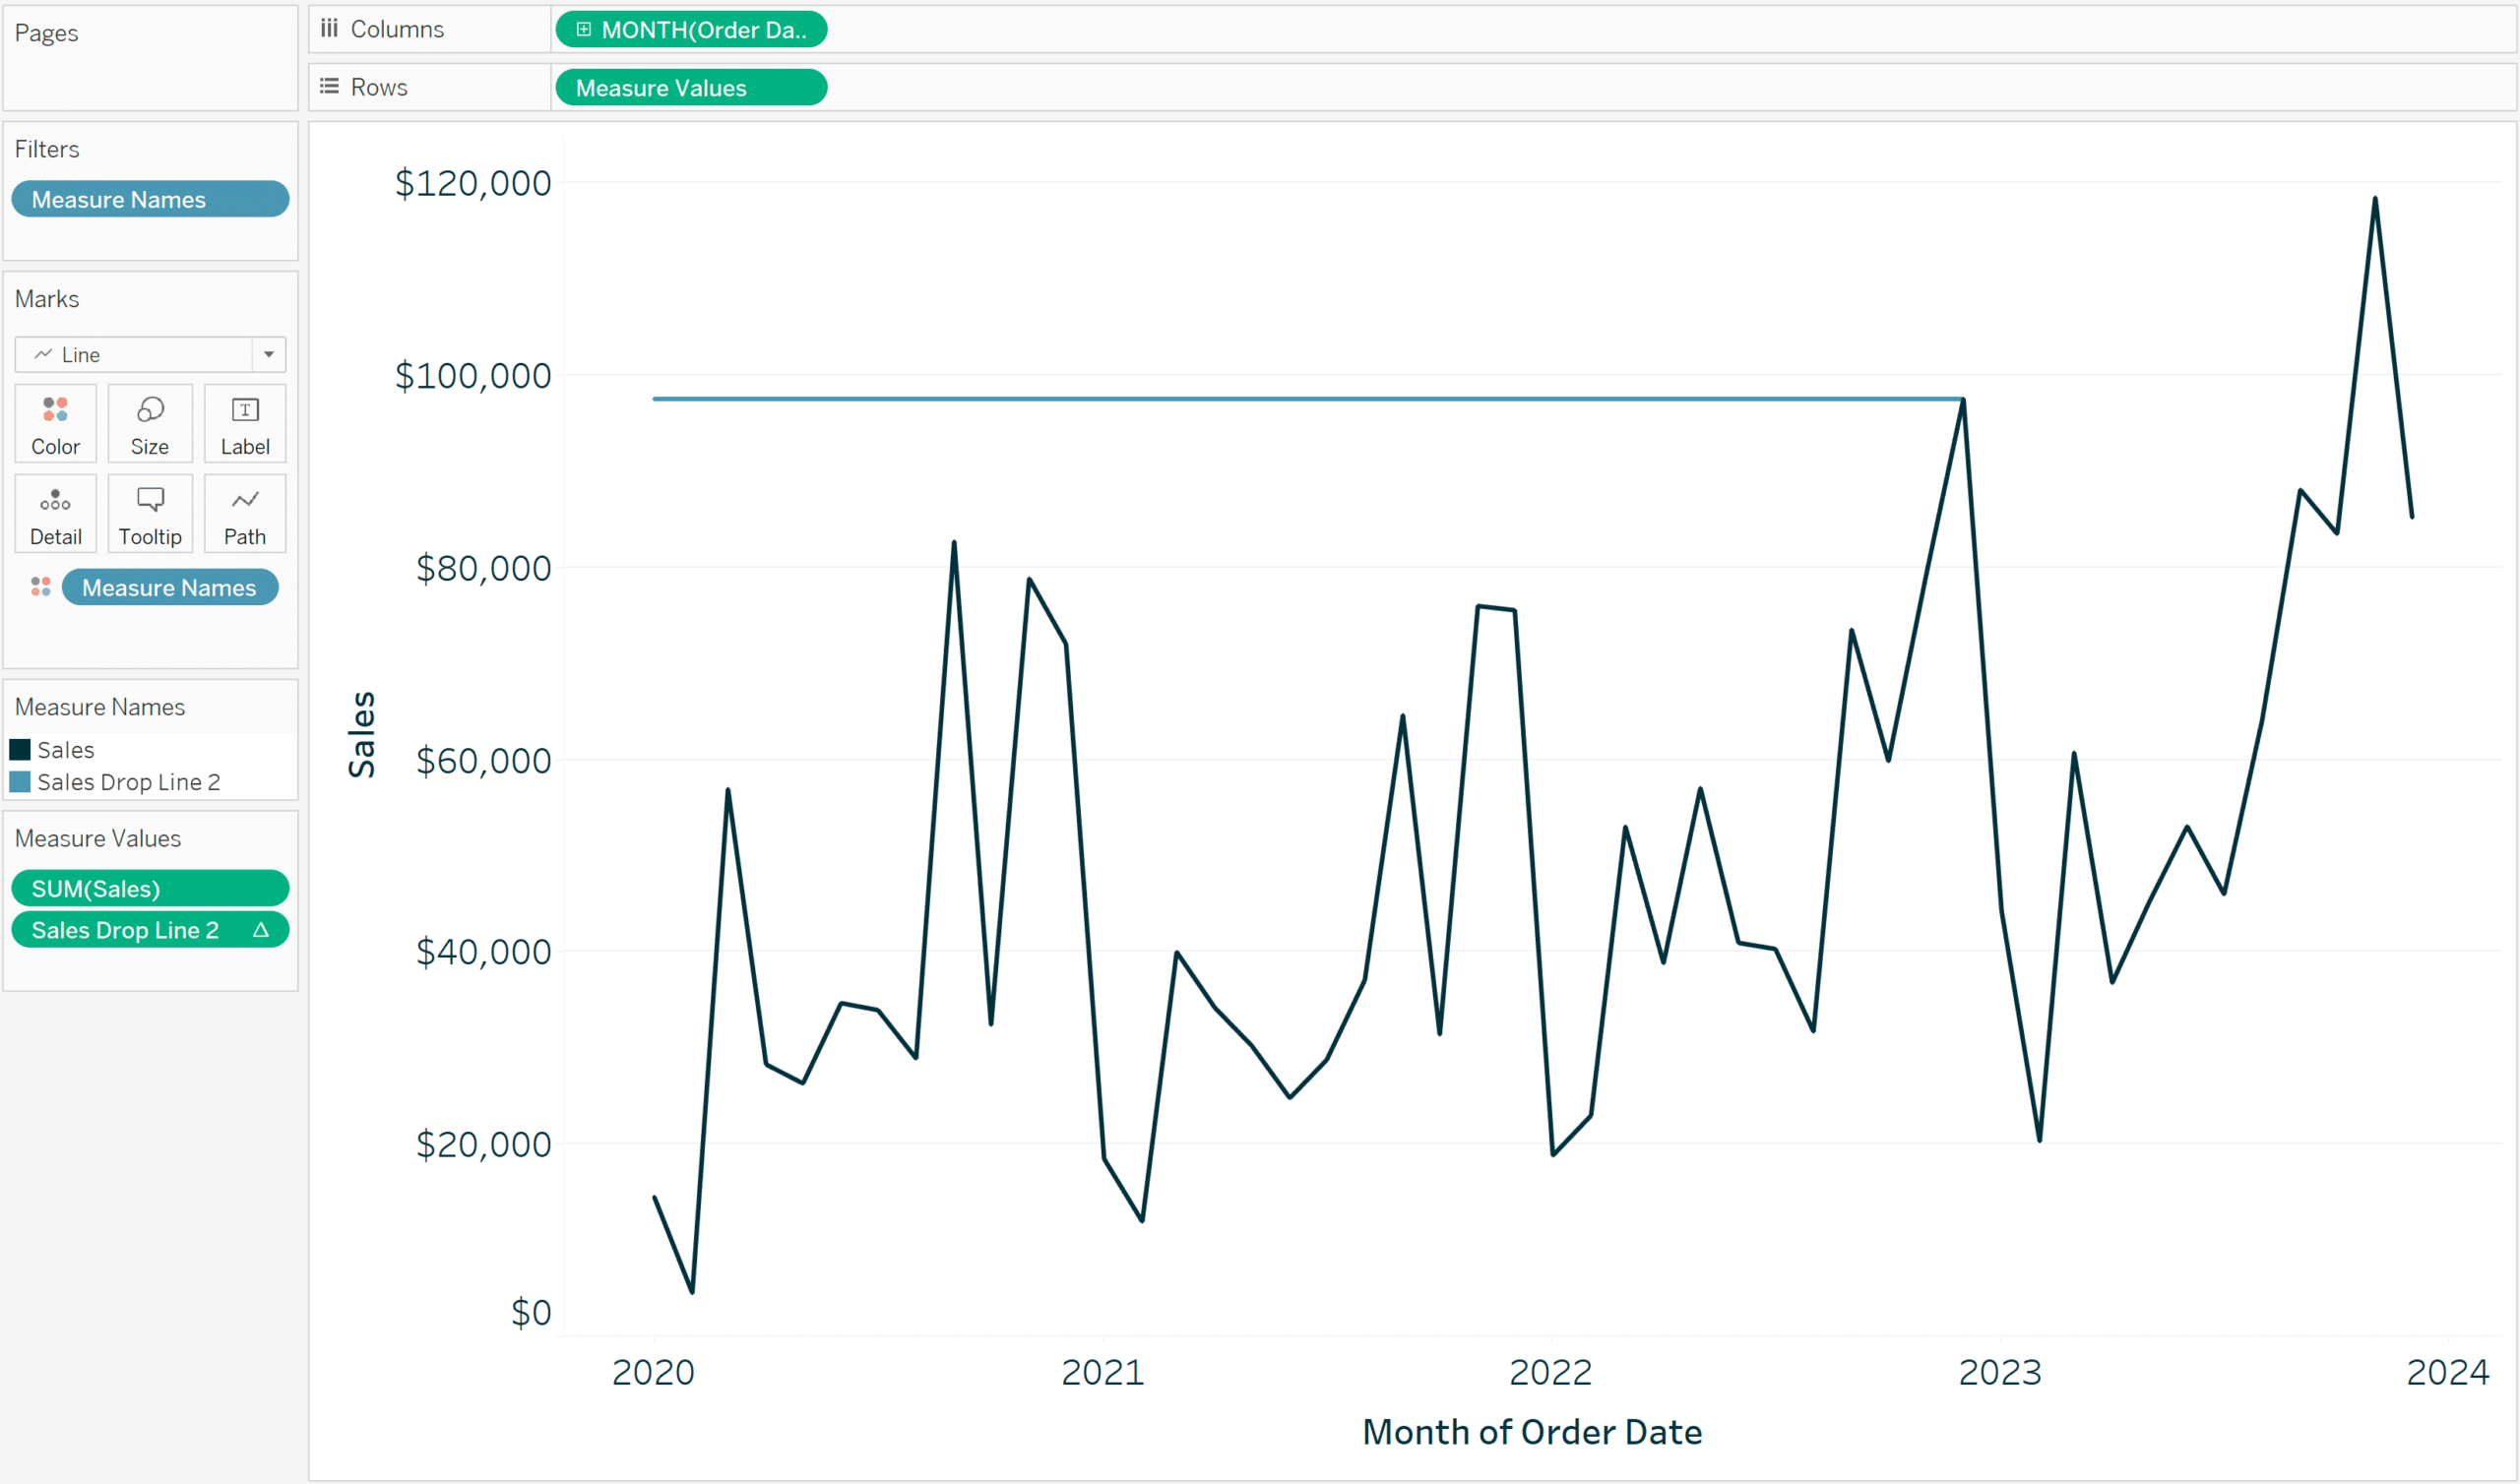
For the following examples, we will use this Sales by month of Order Date line graph from the Sample – Superstore dataset. Be sure to make your date field is continuous, which will create a continuous x-axis that we can later add a drop line. I’ve placed the Sales field on the Rows shelf and continuous MONTH([Order Date]) on the Columns shelf.
Continue reading with a free account, or login.
Unlock this tutorial and hundreds of other free visual analytics resources from our expert team.
Already have an account? Sign In
By continuing, you agree to our Terms of Use and Privacy Policy.
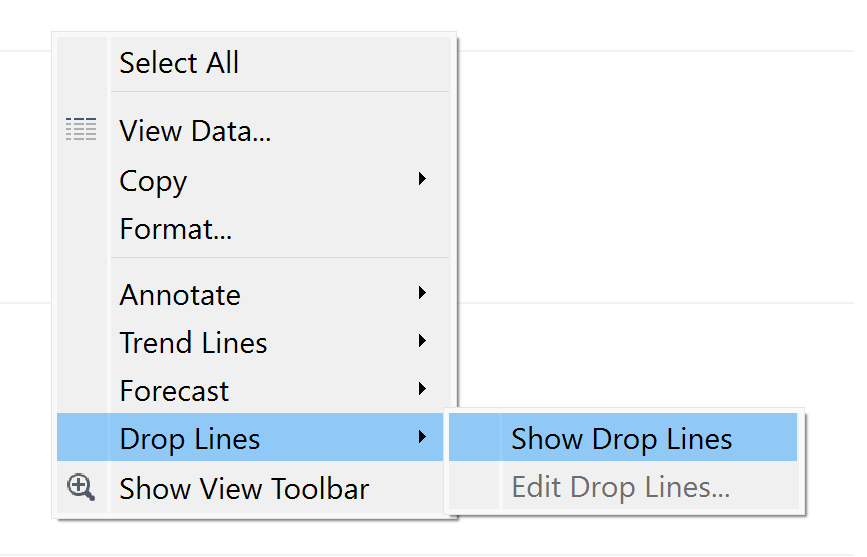
To add drop lines in Tableau, right click somewhere within the visualization, hover over Drop Lines, and select Show Drop Lines.
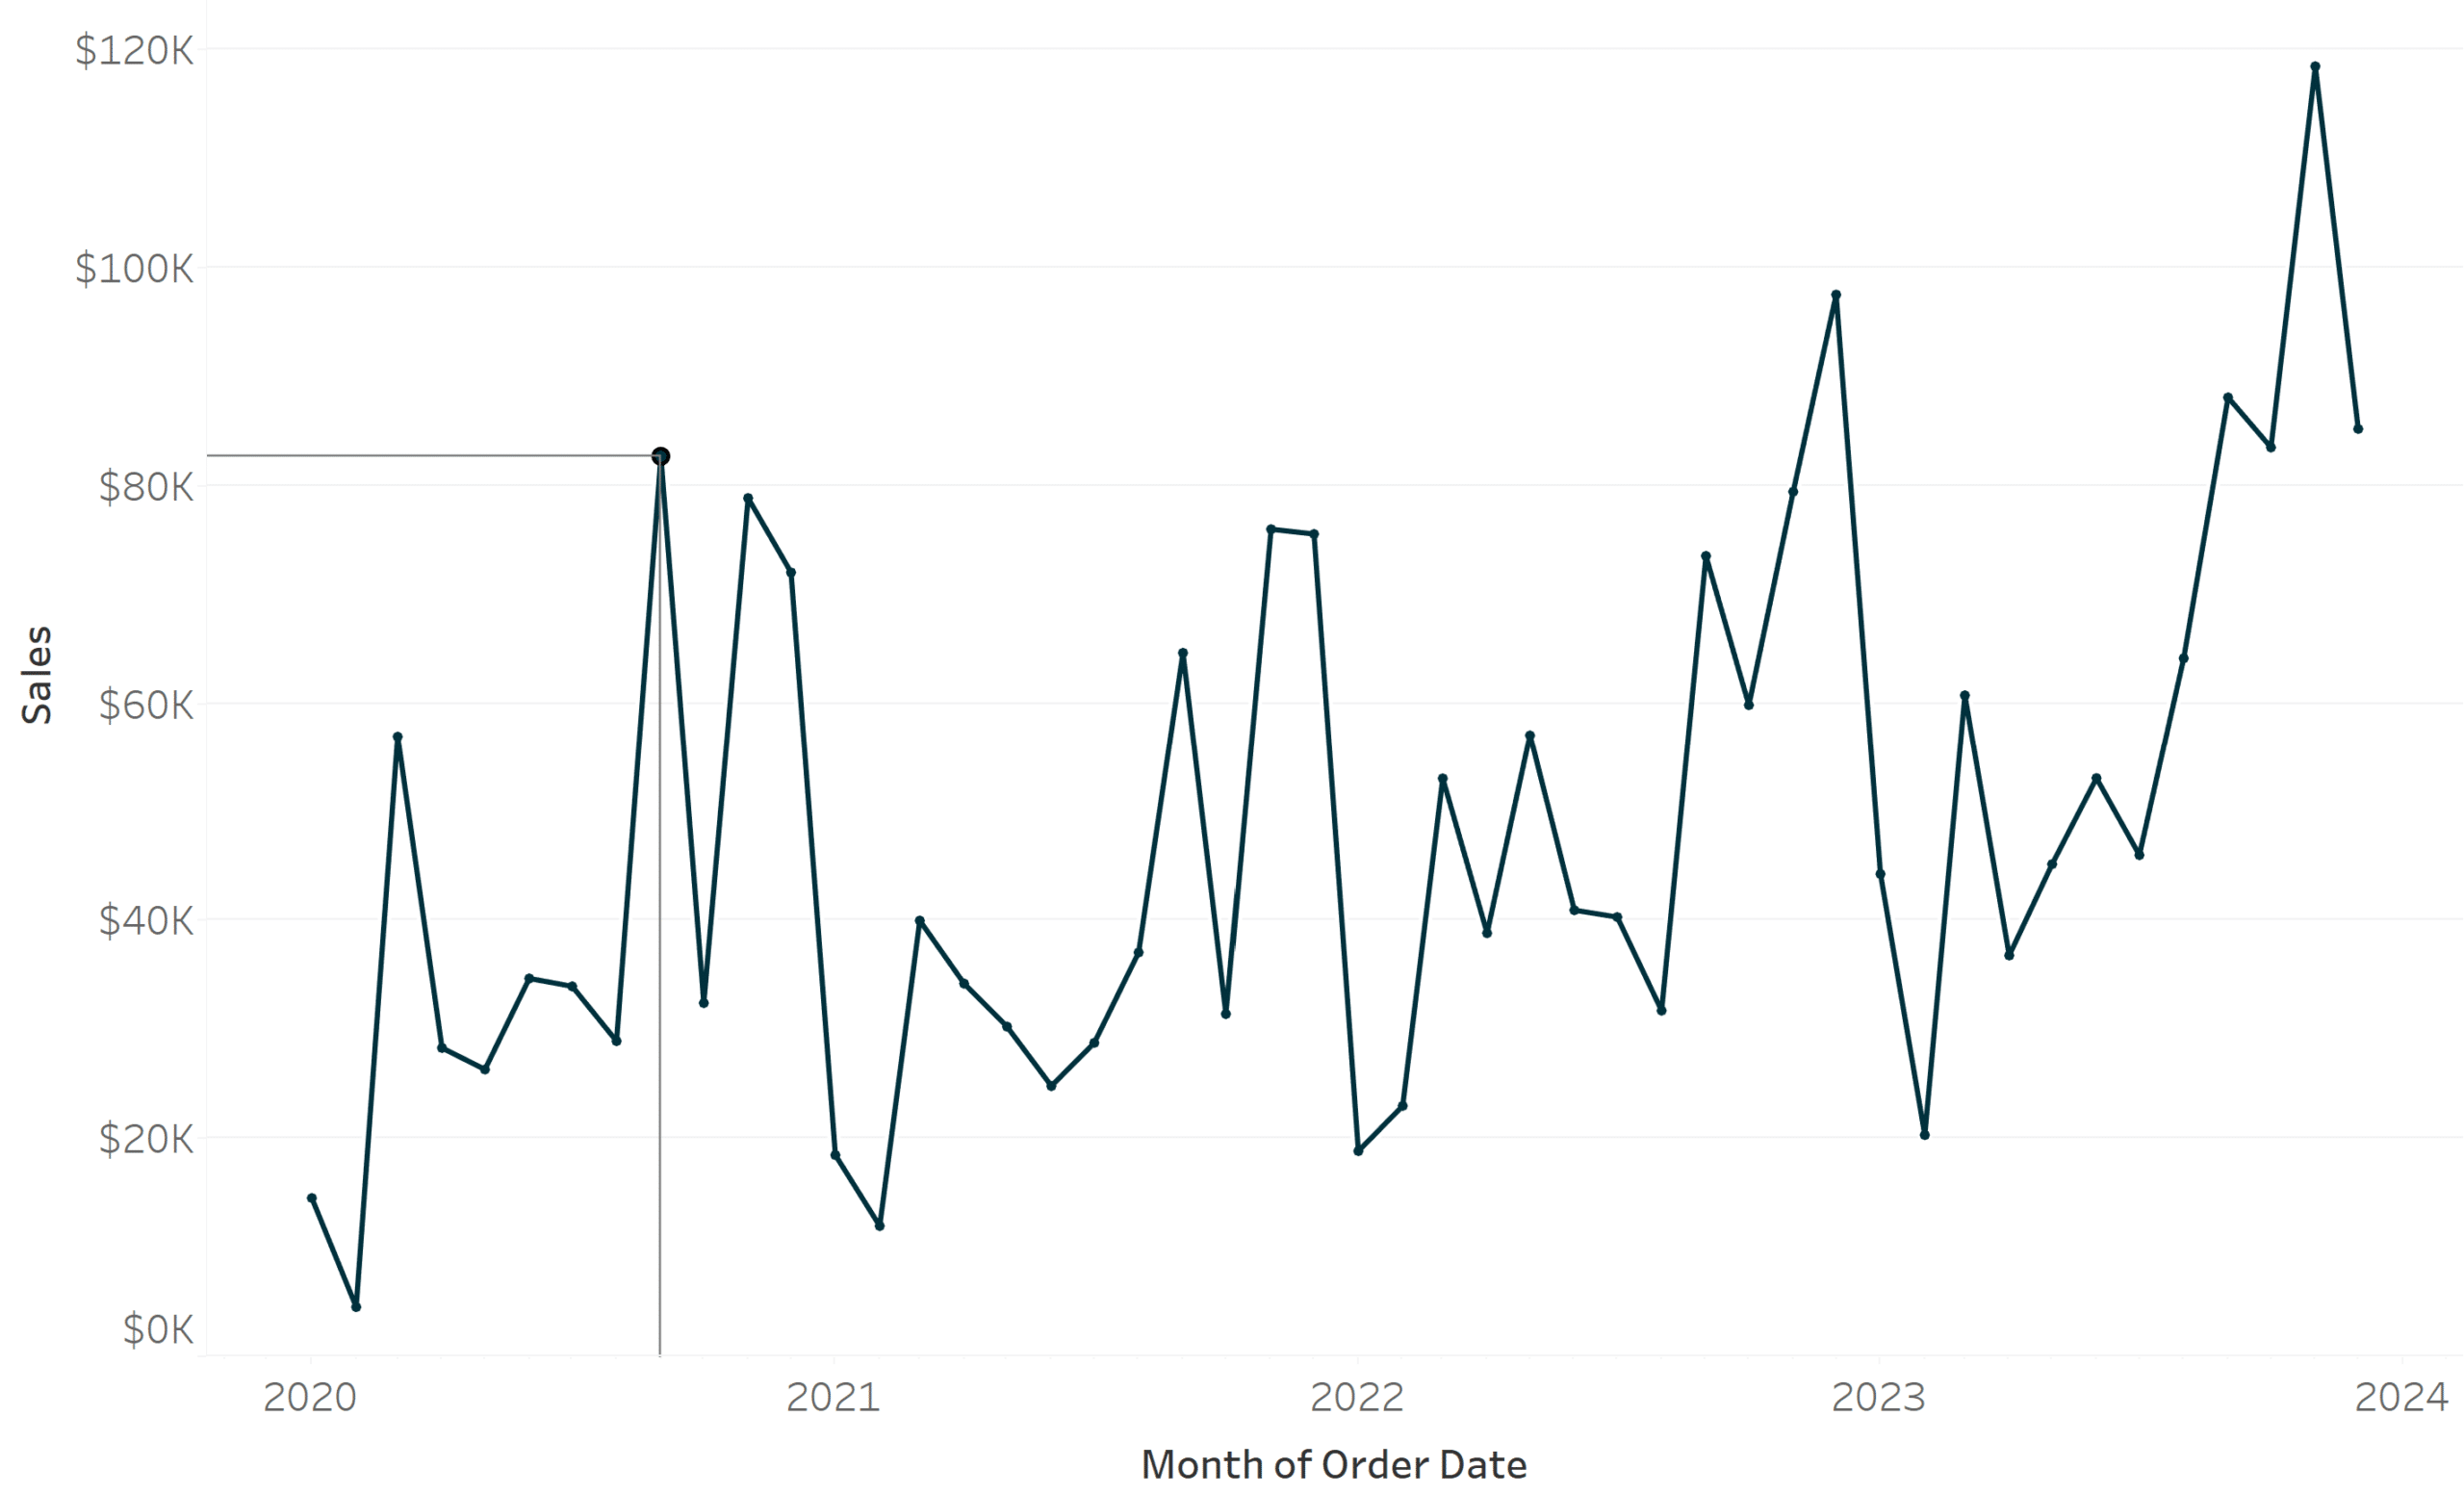
You won’t see anything change at first, but now if I click a mark on the view, a line is drawn from that data point to its values on both the y-axis and x-axis.
To turn on the drop line labels, right click anywhere in the visualization again, hover over Drop Lines, and select Edit Drop Lines. This menu will allow you to turn drop lines on and off per axis, choose whether the lines appear upon selection or all the time (which is quite messy), and turn labels on by choosing Automatic.
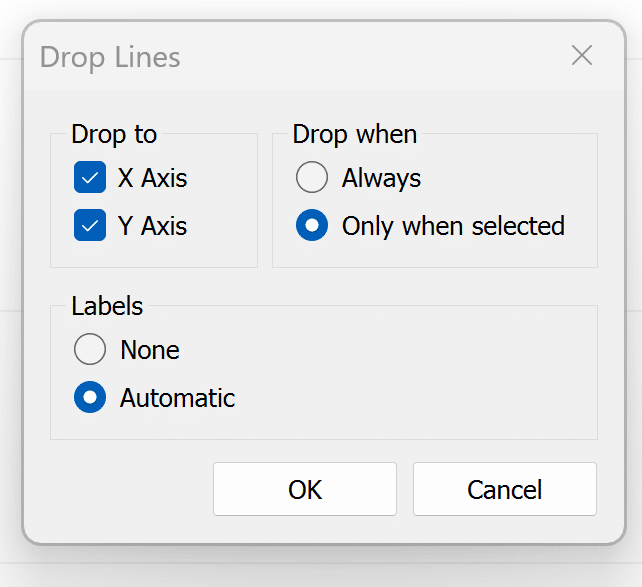
With these selections in place, reselecting a data point will not only draw a line to the y-axis and x-axis, but will display the respective labels for the selected data point.
These drop lines have made the analysis more precise and arguably more engaging, but they will only appear in Tableau Desktop and not in an interactive version of Tableau such as Tableau Server, Tableau Cloud, or Tableau Public. Further, the drop lines will only appear upon selection and it would be nice to have some flexibility to have them appear upon hover.
![]()
Lastly, the formatting options of the lines and their labels are limited. To format drop lines, you can right click anywhere in the view, select Format, navigate to the last tab of options (for Lines), and use the Drop Lines dropdown menu. Or instead, keep reading for solutions to all the limitations of default Tableau drop lines!
How to make it work with Tableau Server / Tableau Cloud / Tableau Public
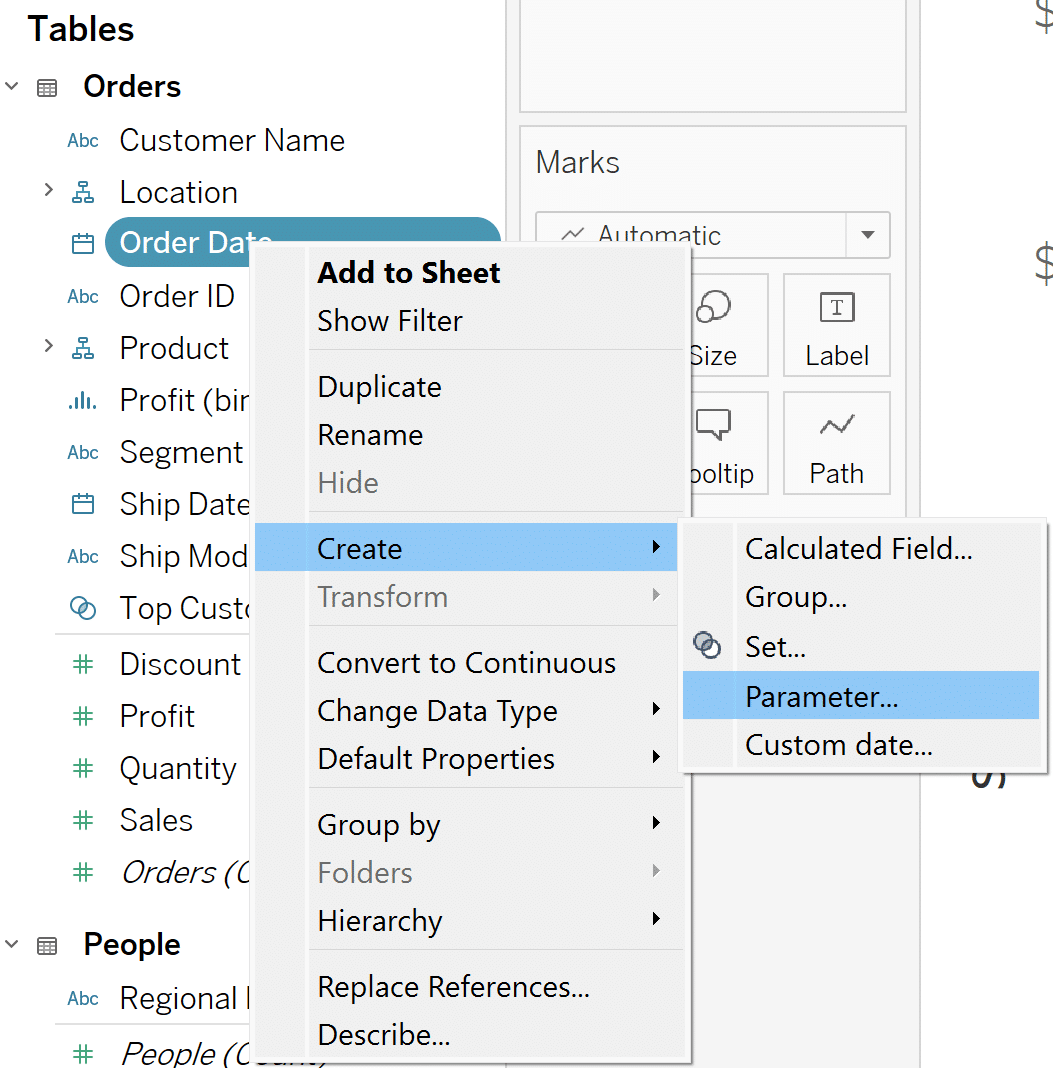
The trick to using drop lines that work on any cloud-based version of Tableau, unlocking additional formatting options, and even customizing the user experience of when they appear, involves parameters, actions, and reference lines. To begin, make a parameter that includes allowable values of all of the dates being used from the field on the x-axis. The easiest way to do this in the Sample Superstore dataset is to right-click on Order Date from the Data pane, hover over Create, and choose Parameter.
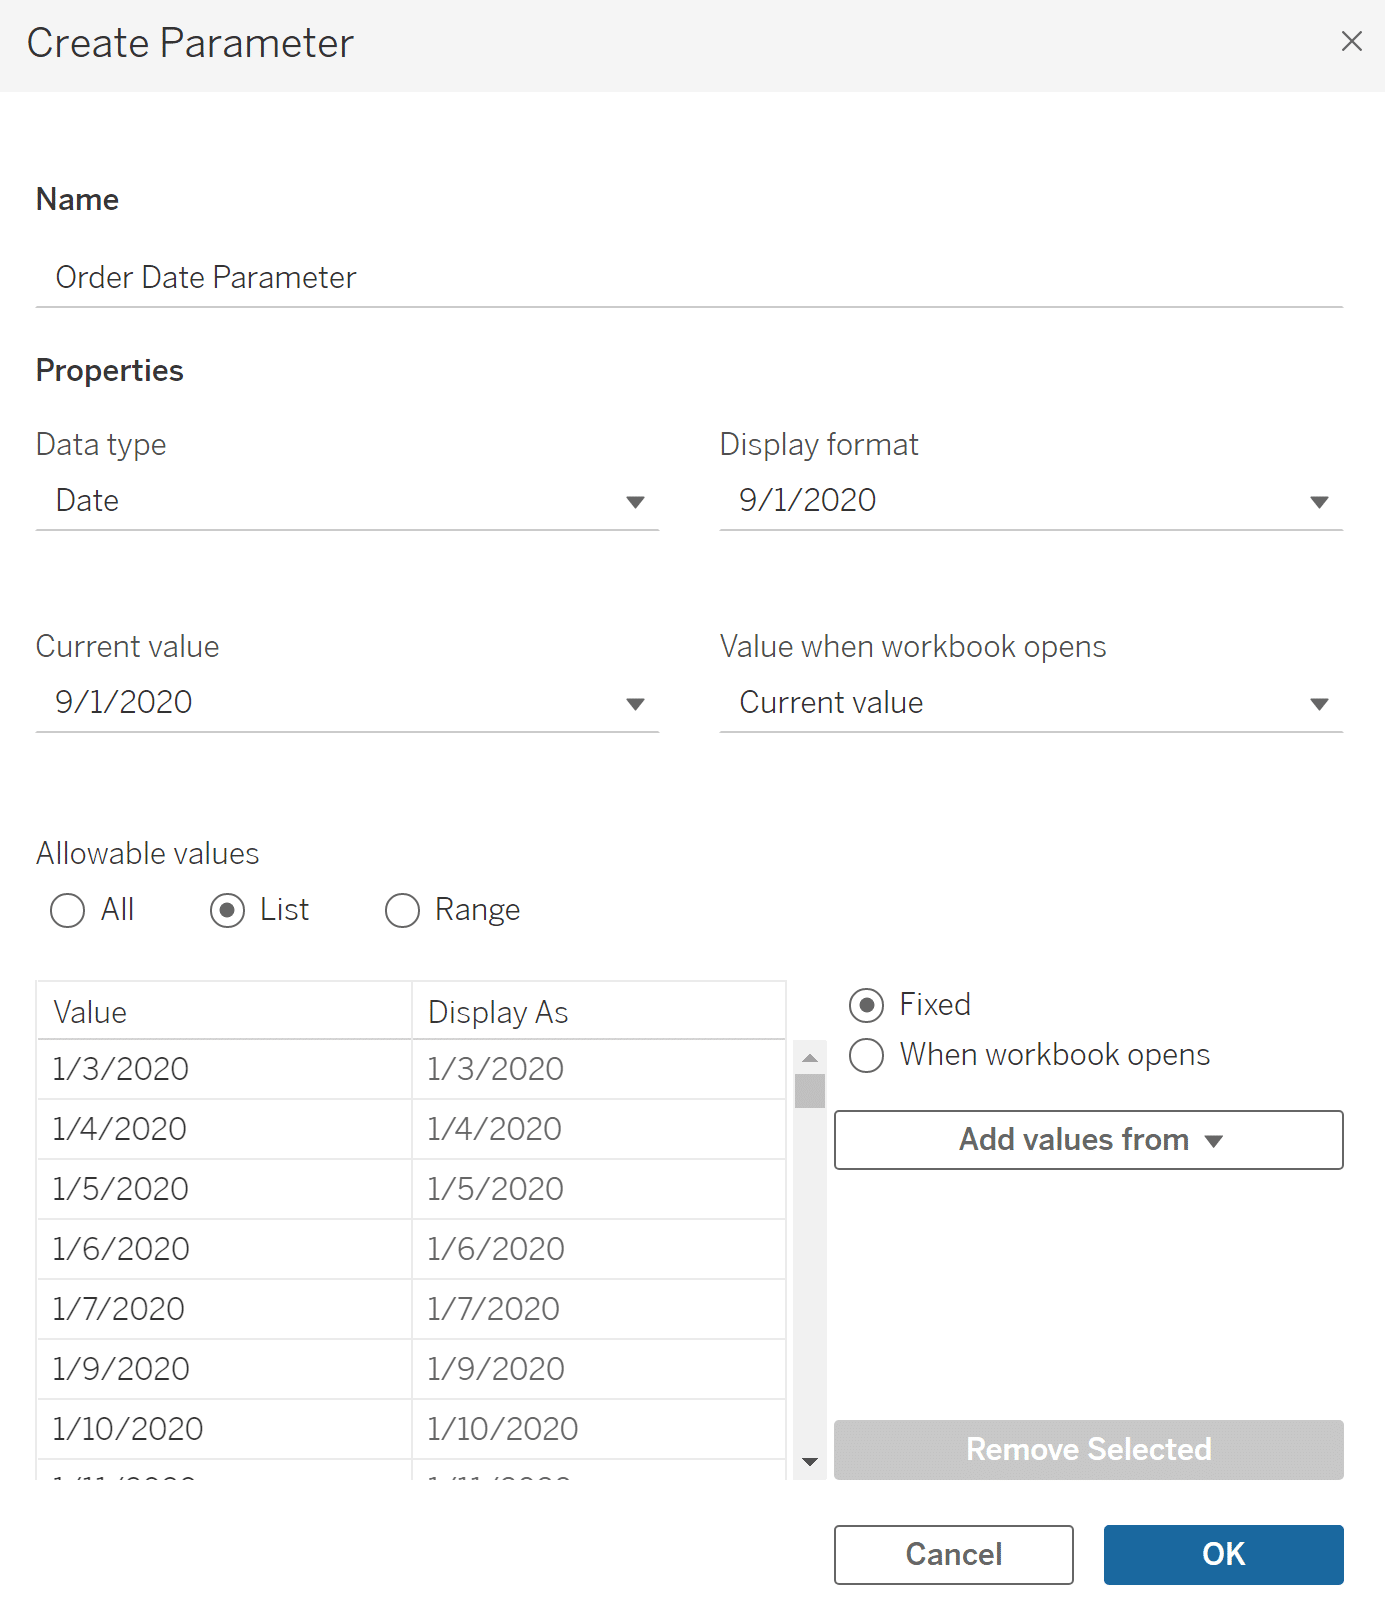
The benefits of creating a parameter this way are that the parameter is created with the same data type as the field it was created from and the list of allowable values is automatically populated with the dimension members from that field. To demonstrate this is working in a later step, I will change the current value of the parameter to 9/1/2020, the same date being highlighted in the default example above, and click the Okay button to close this dialog.
The next step is to create a calculated value that will be used to draw a reference line to the selected value on the y-axis. The formula for Sales would be:
SUM(IF DATETRUNC(‘month’,[Order Date]) = [Order Date Parameter] THEN [Sales] END)
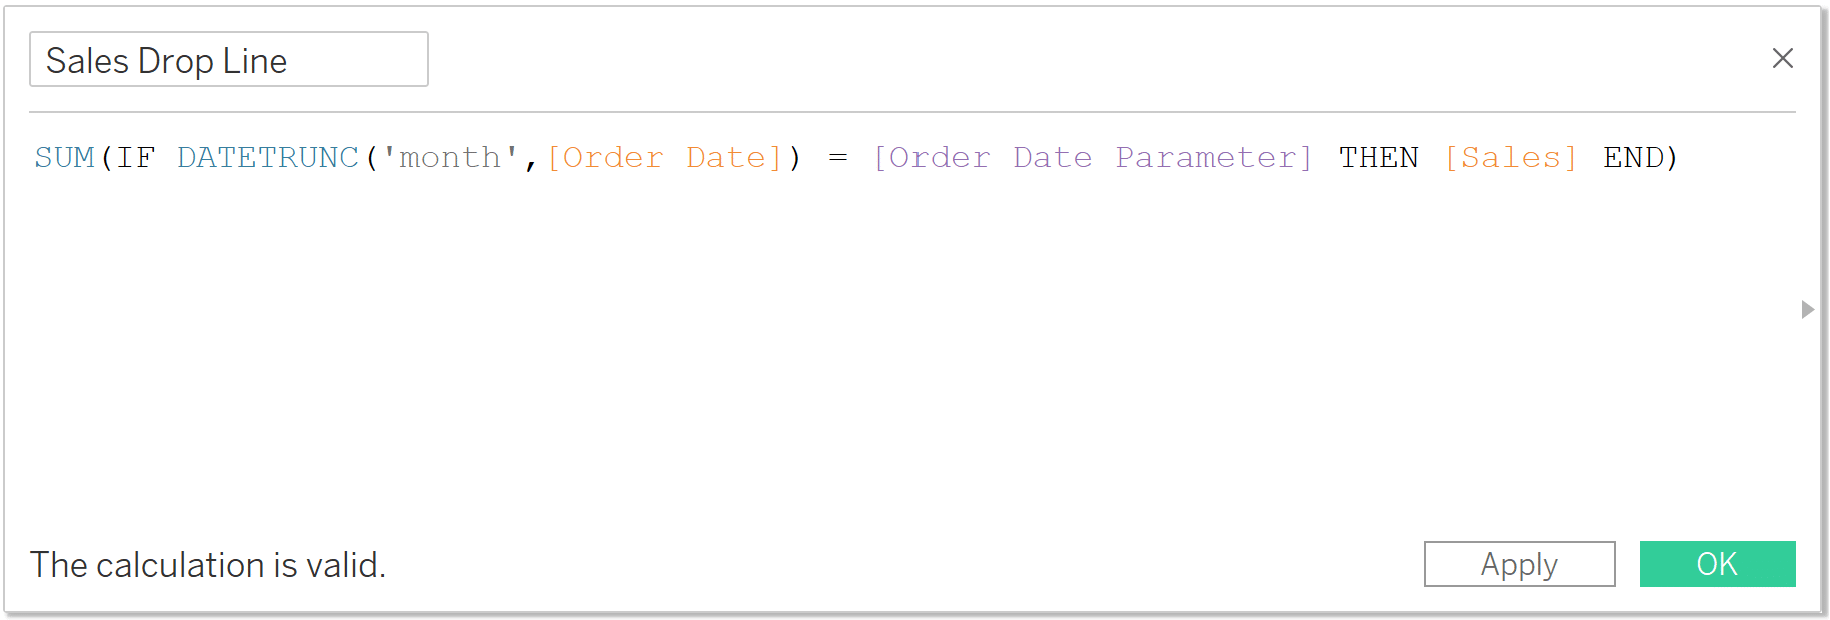
This calculated field tells Tableau to only generate a Sales value when the value for the Order Date field, truncated at the monthly level, matches the current value of the Order Date Parameter field.
How to Isolate Comparison Date Ranges in Tableau
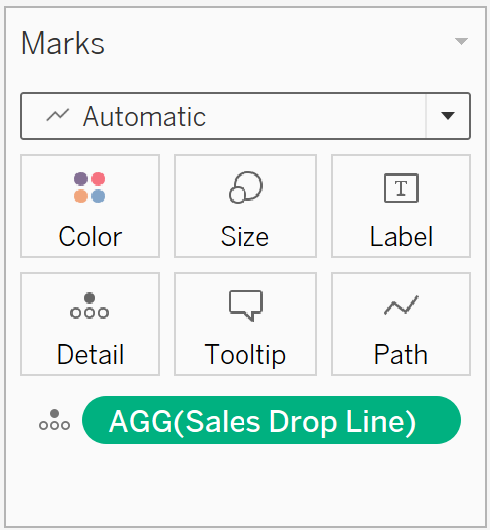
Next, place this newly created calculated field on the Detail property of the Marks card. This will ensure it’s available to choose as a reference line in a future step.
Now I will add this as a reference line by right-clicking on the y-axis and choosing Add Reference Line. Since we put the Sales Drop Line on the Detail property, it’s available to choose as an option within the Value dropdown. And since we’re using a reference line, we can now format the line color, line weight, and reference line label.
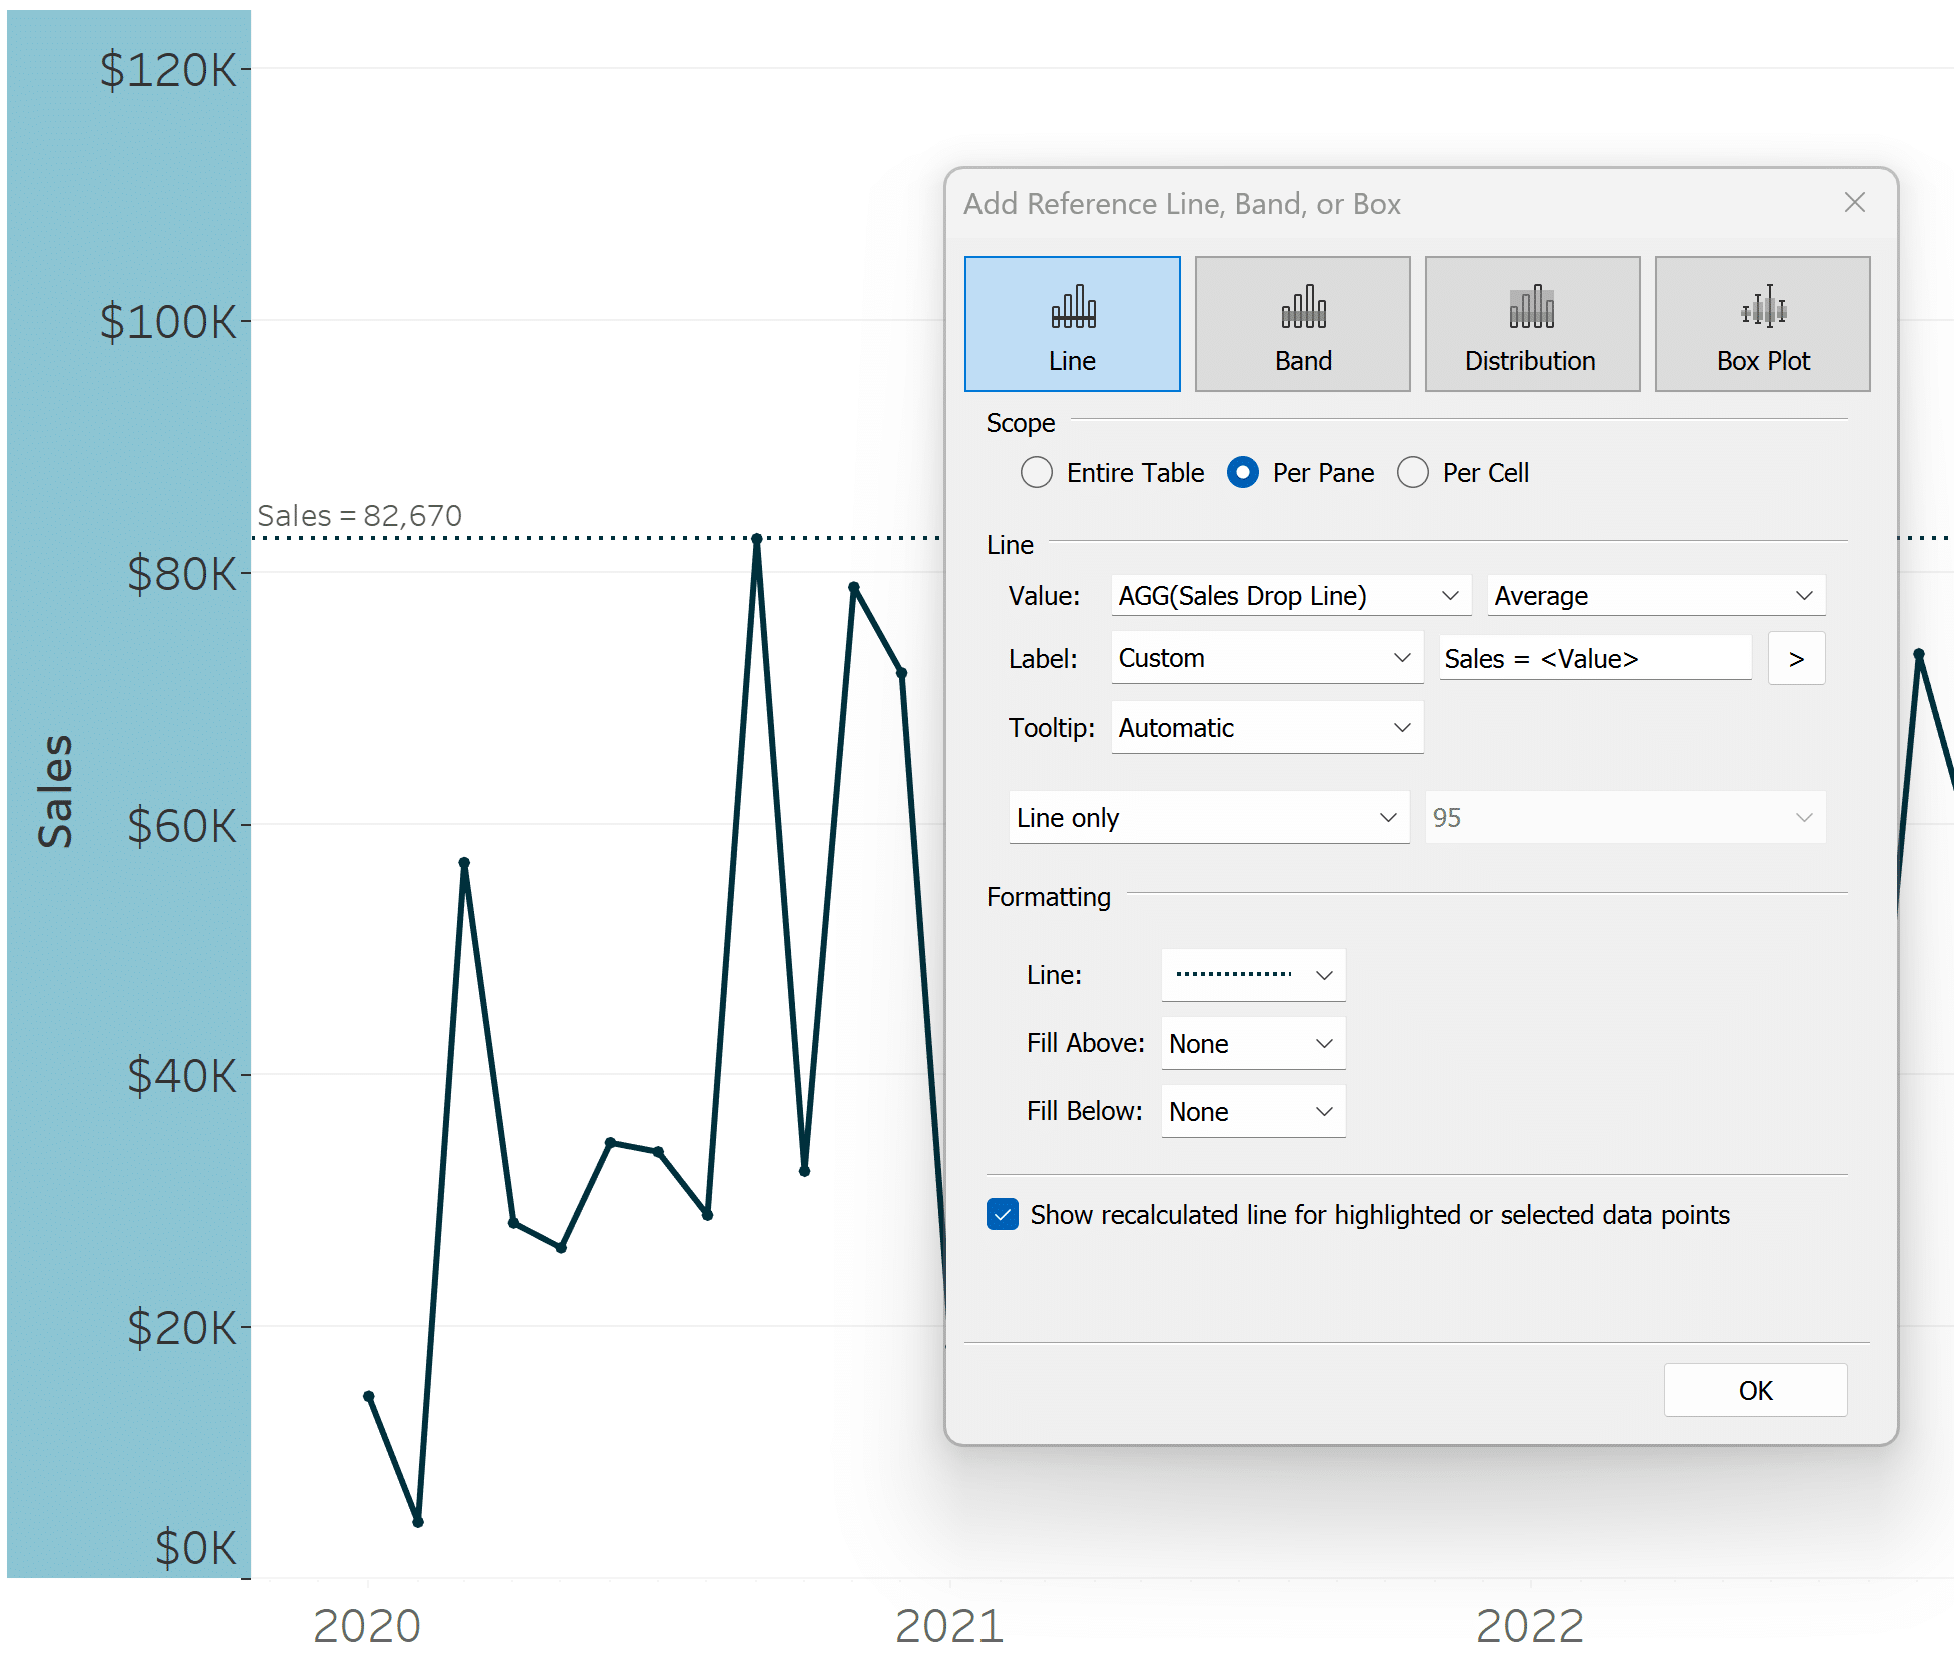
For further text formatting options, you can right-click on the reference line and choose Format.
Ten Tableau Text Tips in Ten Minutes
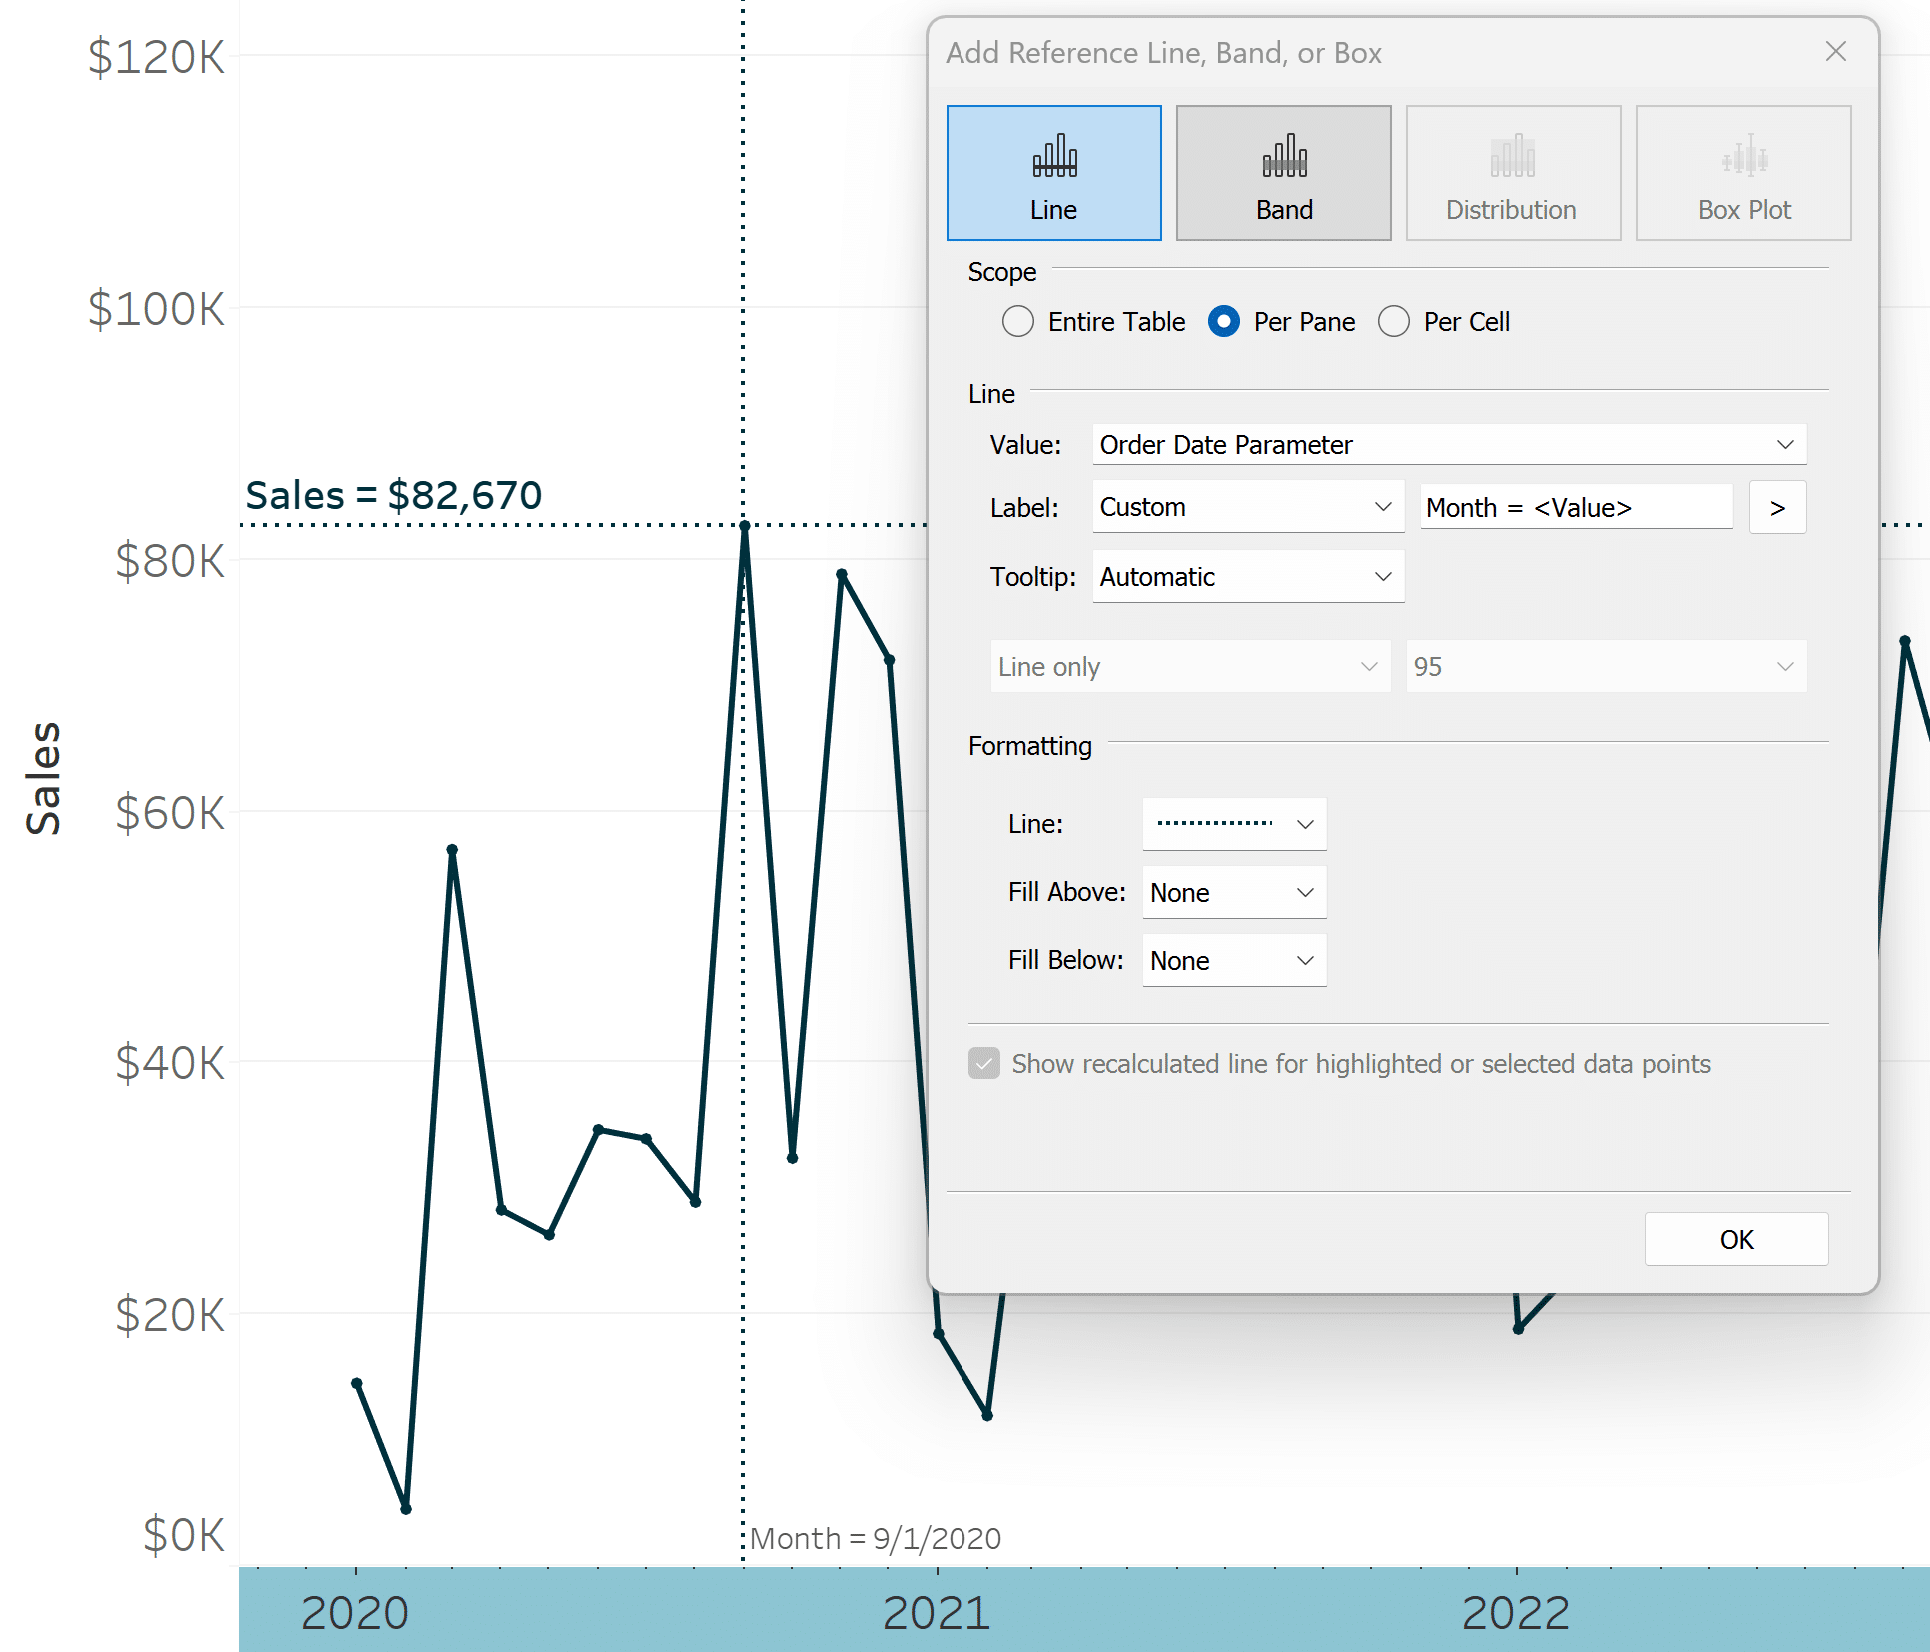
The drop line / reference line for the x-axis is slightly easier because it is generated from the Order Date parameter itself, and parameter values are automatically available from the list of options in the Value dropdown within the Add Reference Line dialog. To add the reference line for the date field, which is currently generating the x-axis, right-click on the x-axis and choose “Add Reference Line”. Then use the Value dropdown to select Order Date Parameter. Again, you have some customization options within this dialog.
To get the reference lines to move to the selected mark, we will add a worksheet action by clicking Worksheet in the top navigation and choosing Action. We want to change the value of the Order Date Parameter field, so we will click Add Action and choose Change Parameter. This is also where I can choose to have the selection work on hover instead of select.
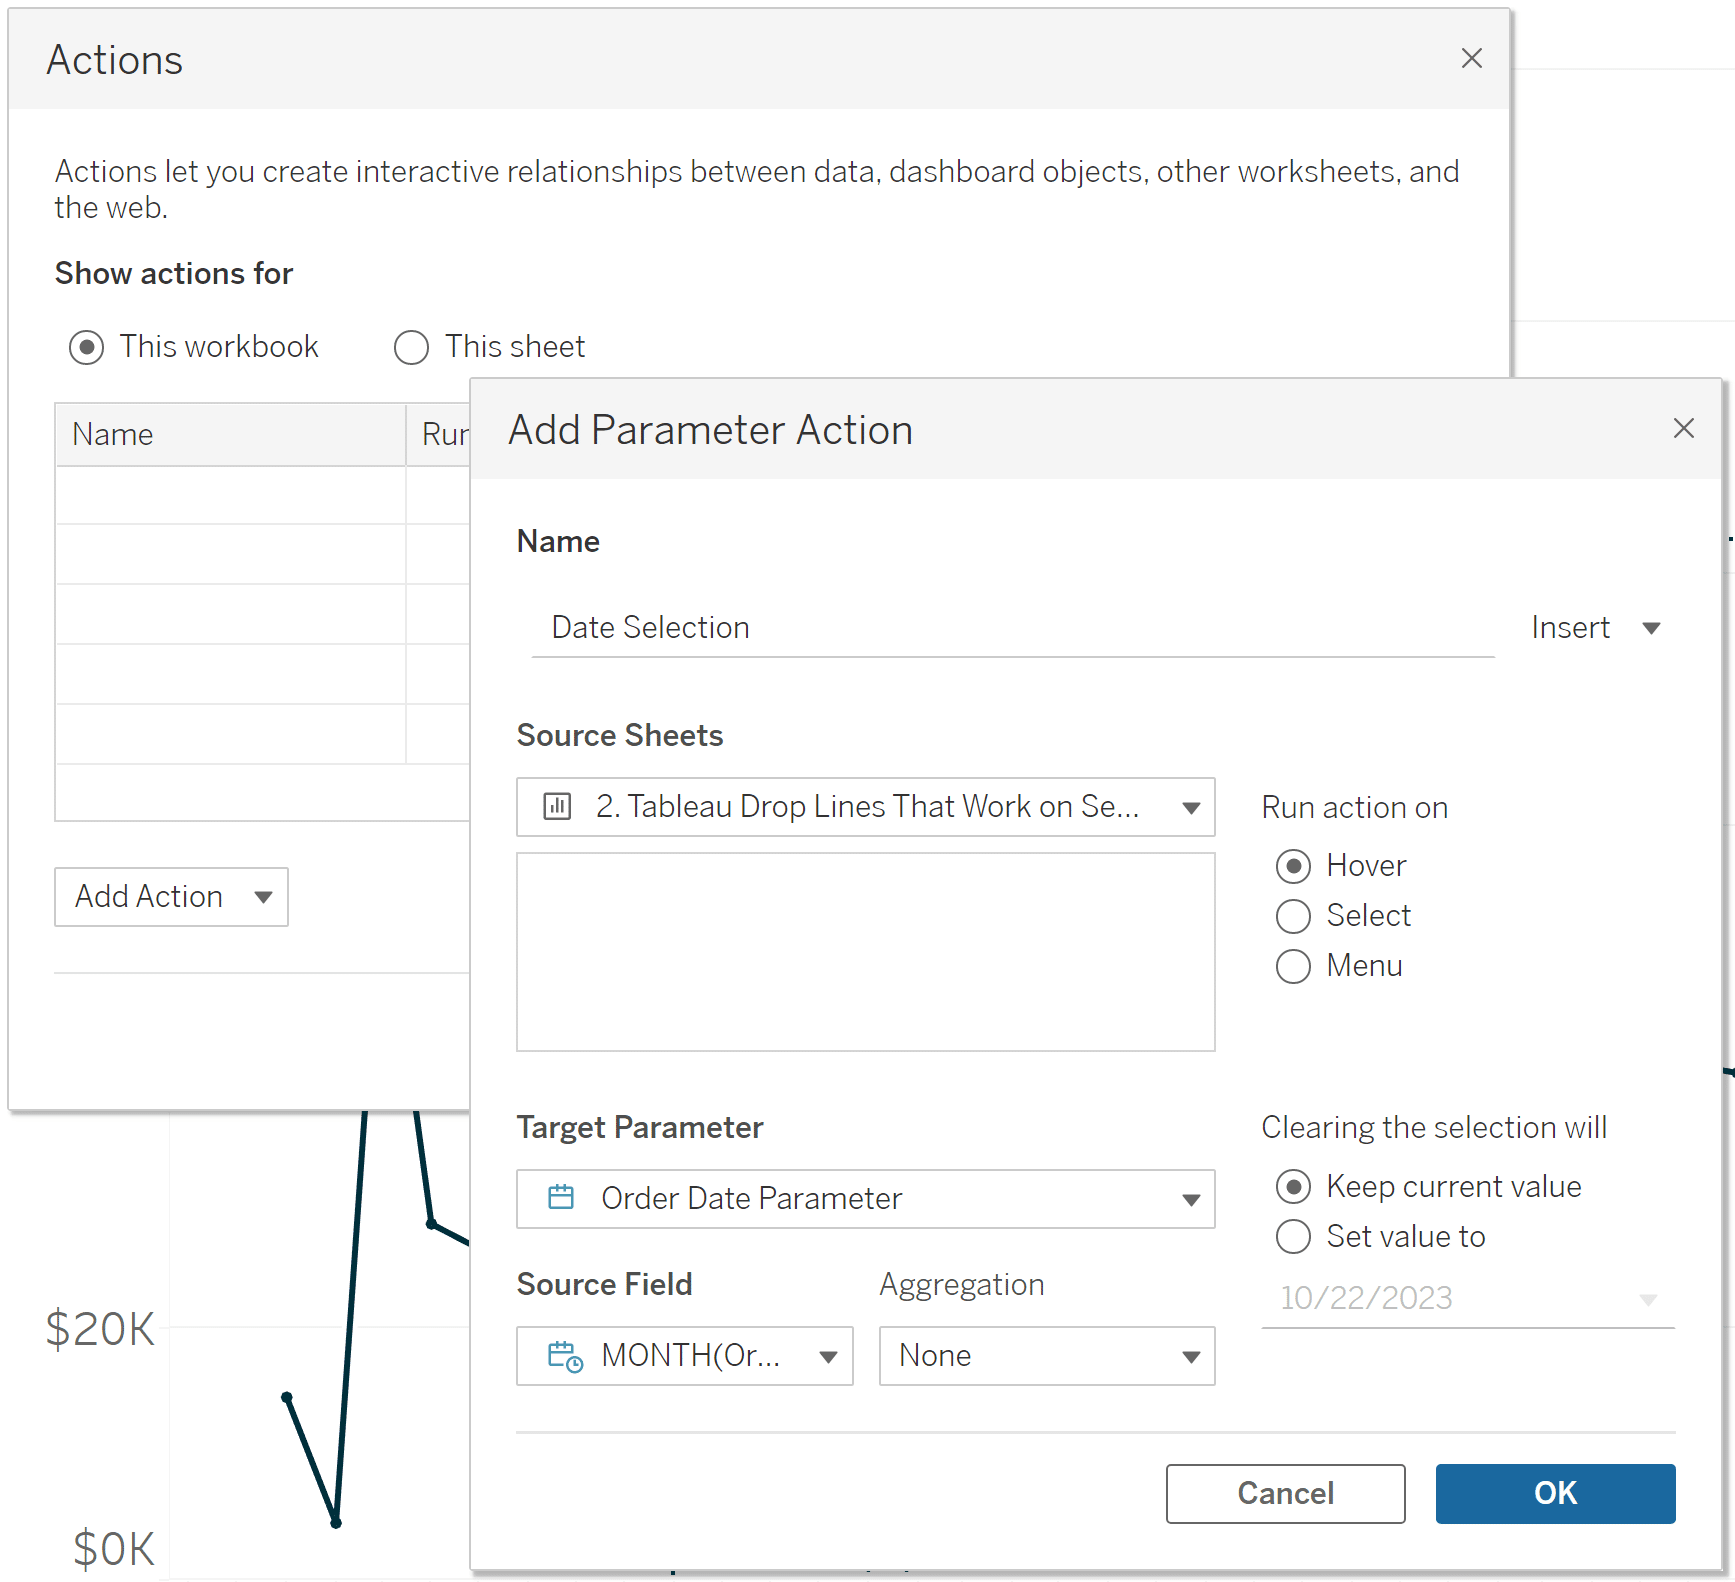
Now hovering over a mark will feed the value for whatever date I’m hovering over to the Order Date Parameter, which populates the Sales Drop Line calculated field, and moves the reference line!
3 Creative Ways to Use Tableau Parameter Actions
One disadvantage to the reference lines approach is they are drawn across the entire view and do not stop / get cut off at the selection. The next section will show you how to make completely customized drop lines that only draw a line from the data point to the axes.
How to make completely customizable Drop Lines in Tableau
To make customizable drop lines for line graphs that cut the line off at the mark, we will need to start with a calculated field that forces the line to only show up for values preceding the selected mark. For the Sales measure, the formula is:
IIF(ATTR(DATETRUNC(‘month’,[Order Date])) <= [Order Date Parameter]
,WINDOW_MAX(SUM(IF DATETRUNC(‘month’,[Order Date]) = [Order Date Parameter] THEN [Sales] END))
,NULL)
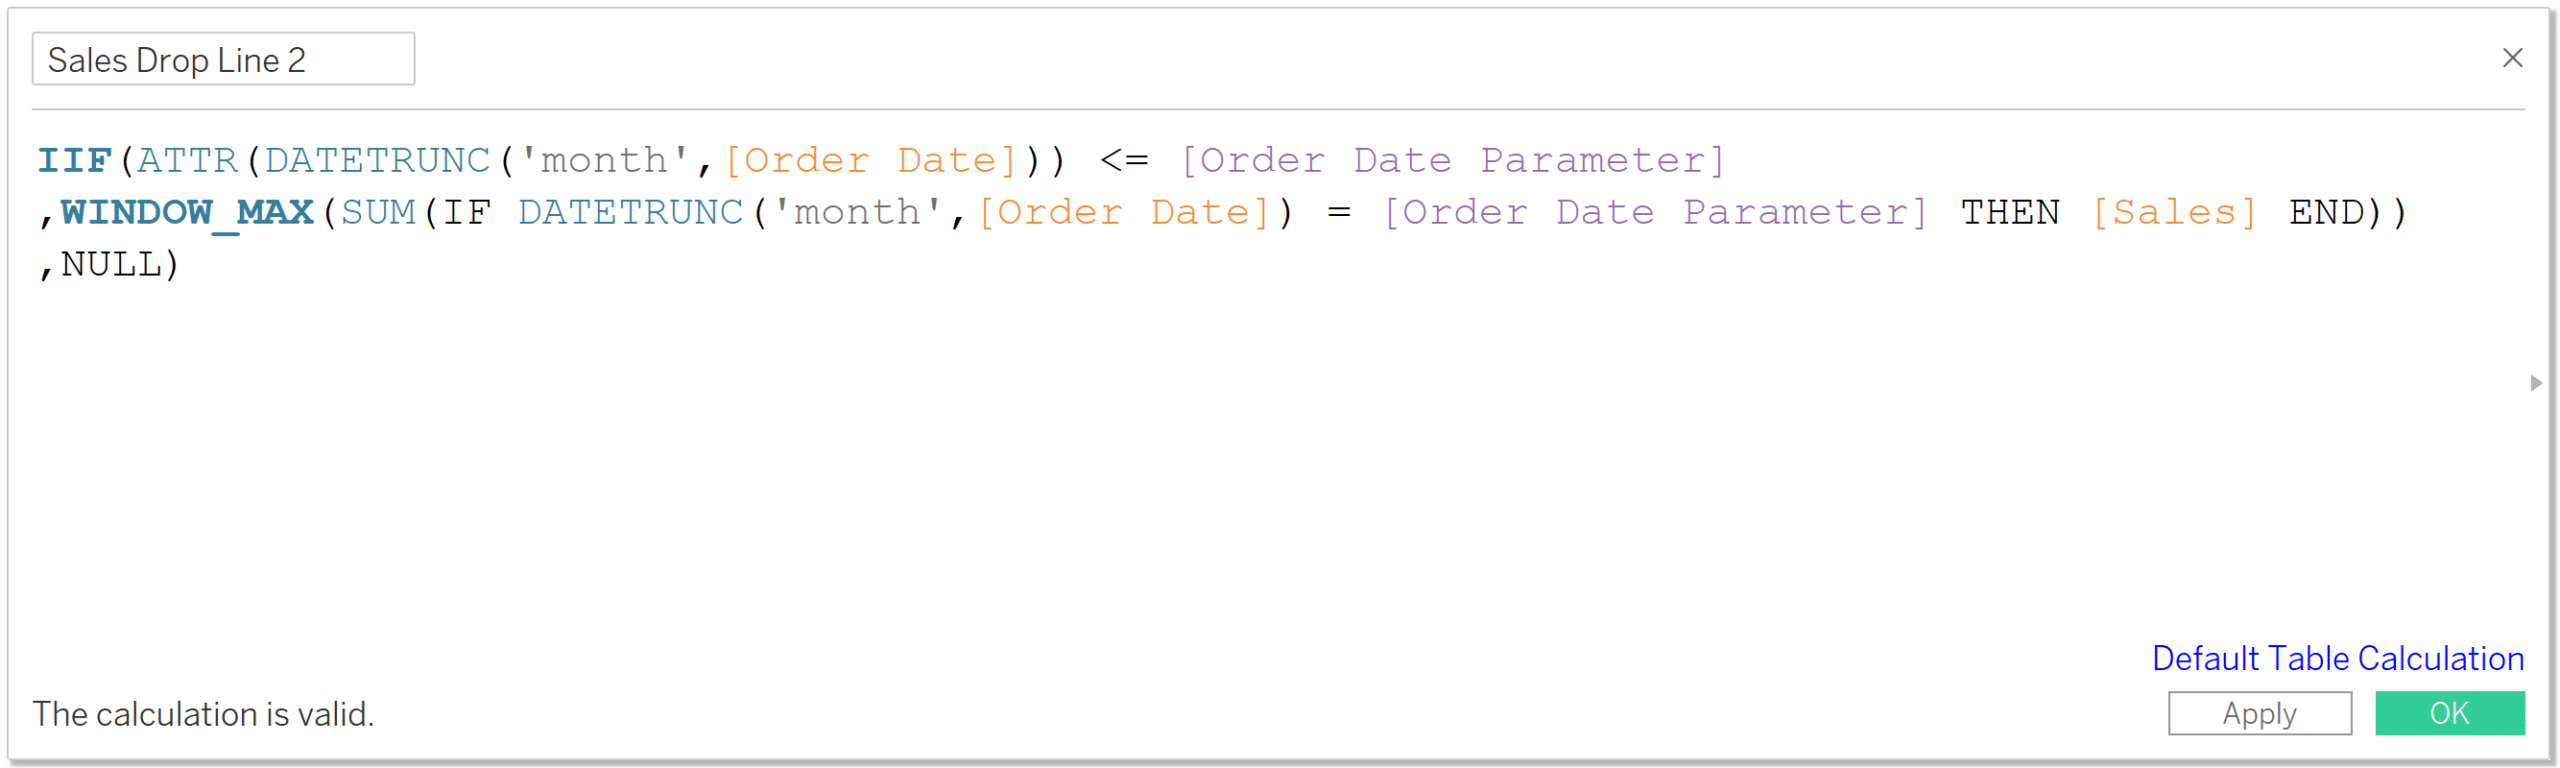
For ease of reading this relatively long calculated field, I have added line breaks, but those are not needed. You would replace the Sales field form the Sample Superstore dataset with whatever measure you are analyzing.
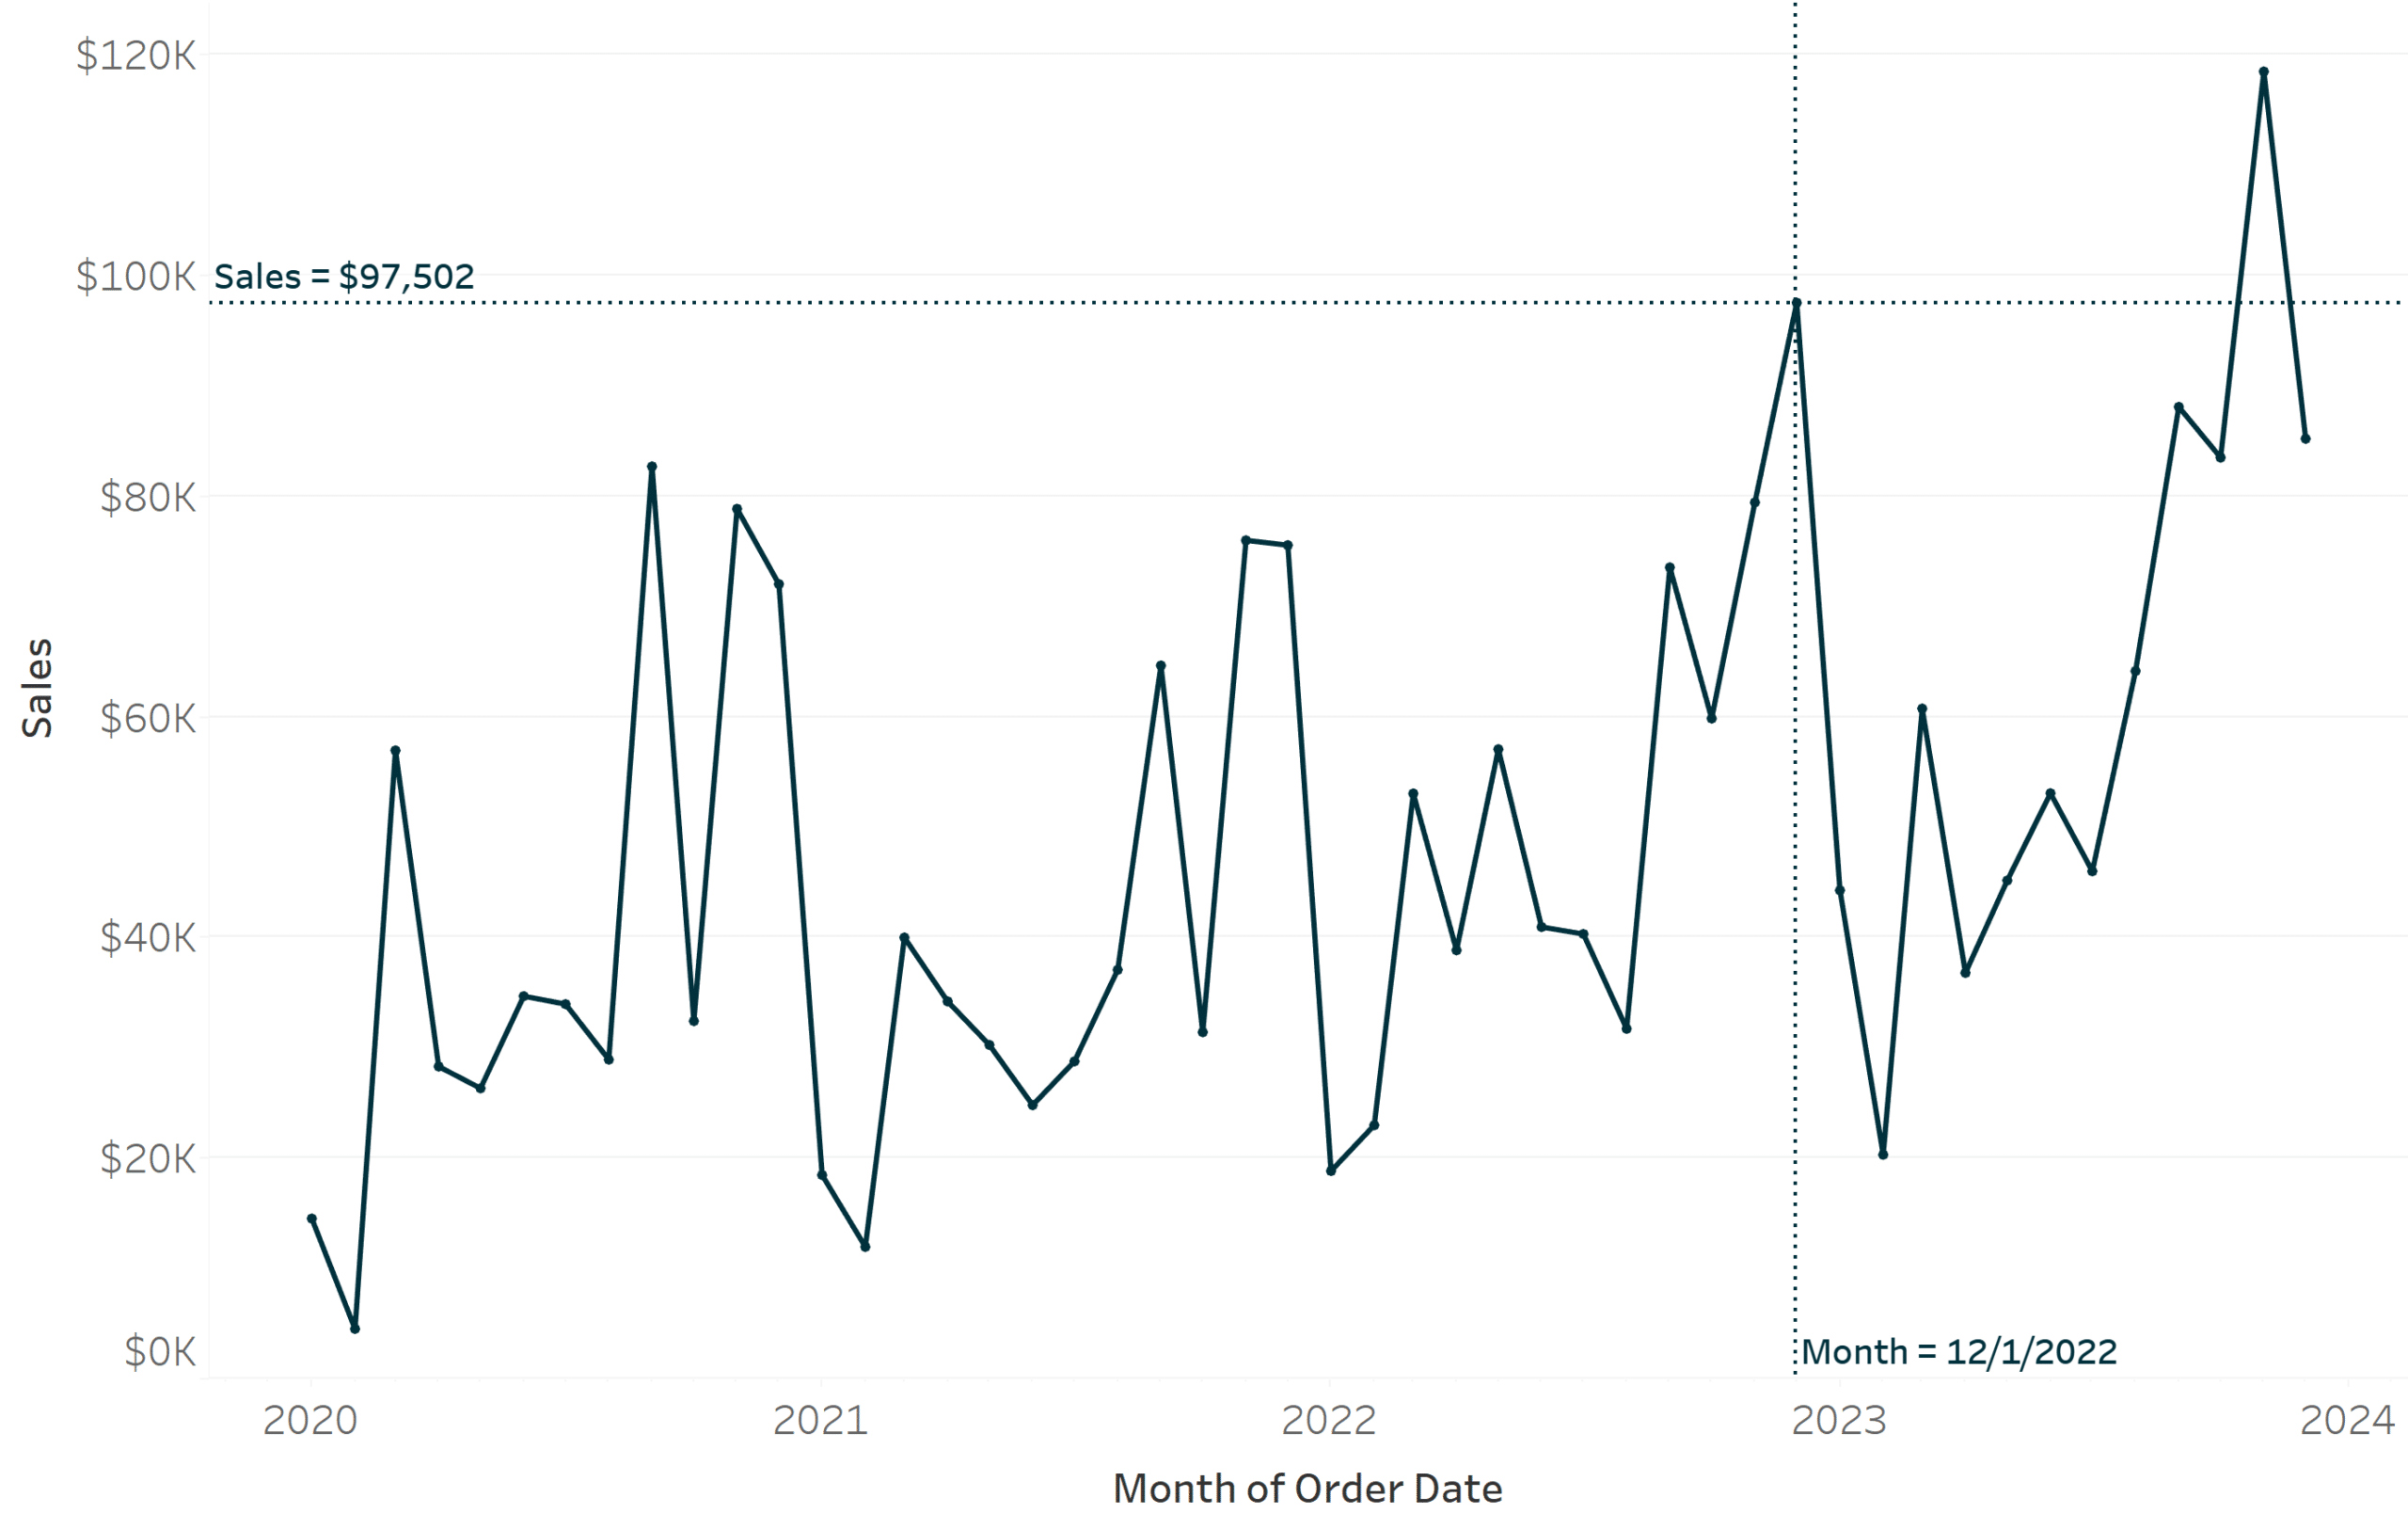
This formula says if the date is less than the selected date, look up the value for the selected date and show it for all preceding dates. If December 2022 was selected, which has a value of $97,502, a flat line would be drawn at $97,502 for December 2022 and all dates leading up to that month (but none after).
How to Color Entire Tableau Charts Based on Current Performance
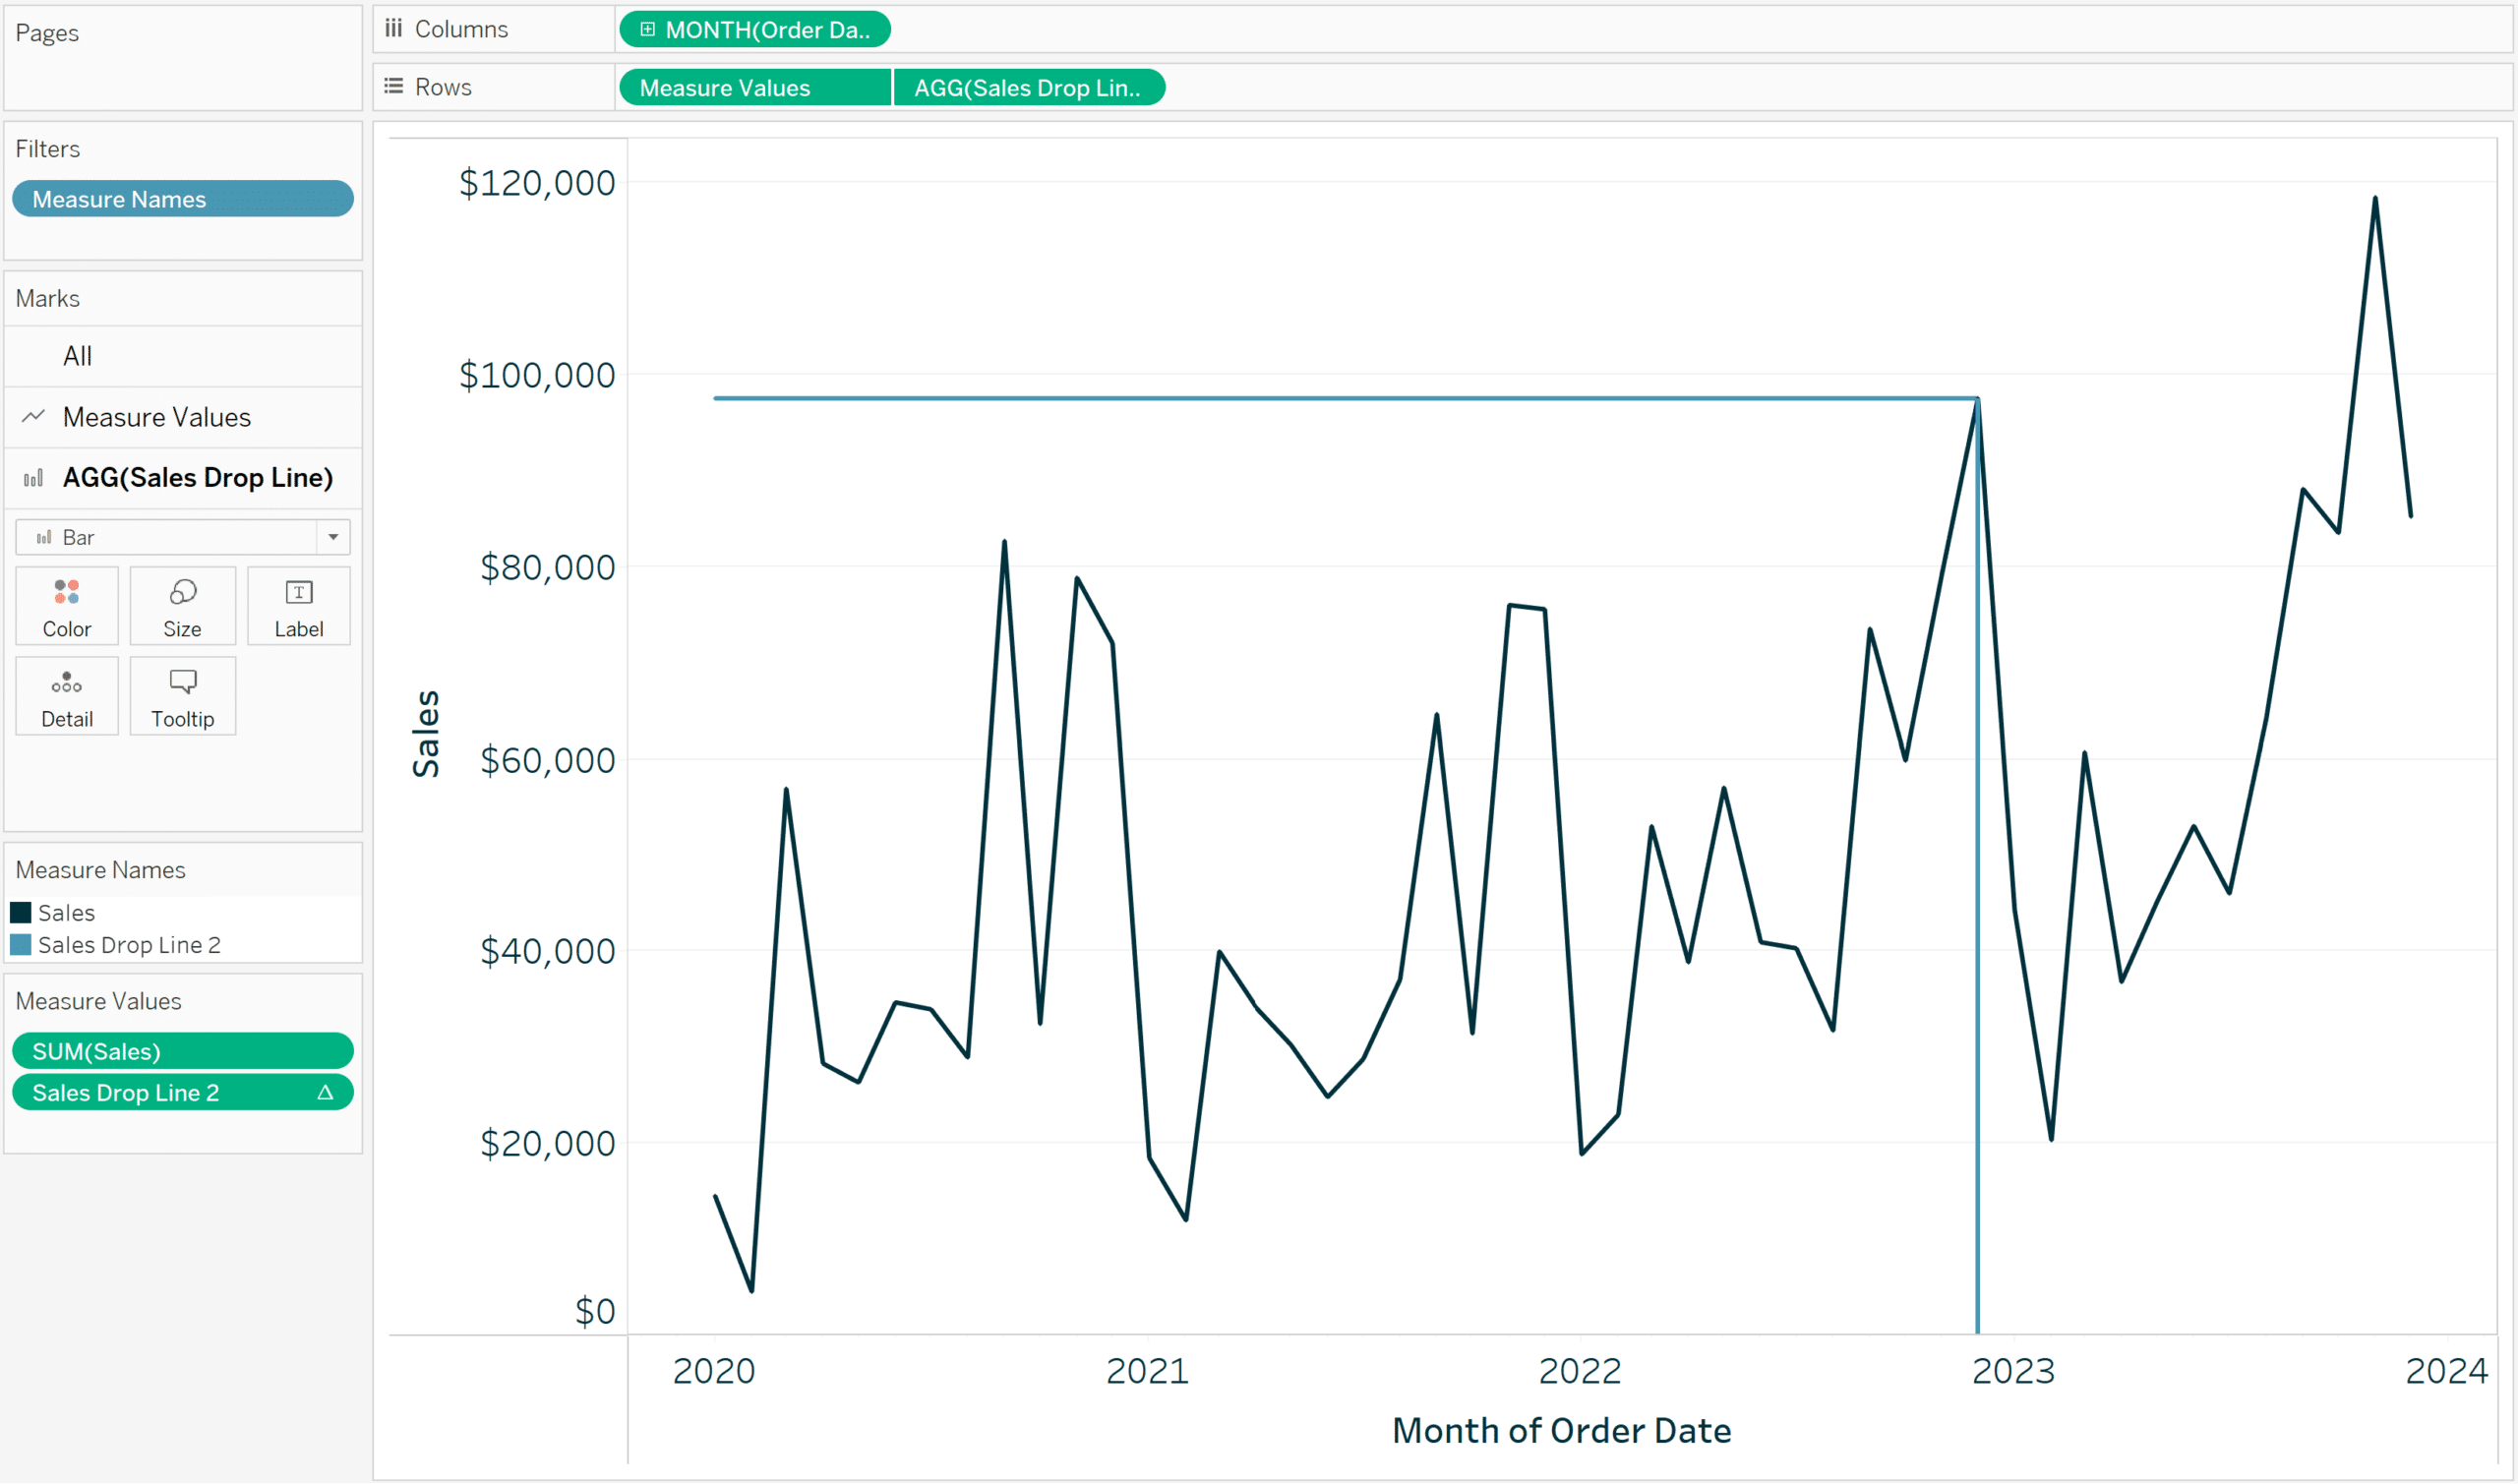
To utilize this calculated field, we will also need to structure our line graph differently. To rebuild the chart to use custom drop lines, place the generated Measure Values field onto the Rows Shelf, remove every measure except for Sales and Sale Drop Line 2 from the Measure Values shelf, change the mark type to Line, and place continuous Month([Order Date]) onto the Columns shelf.
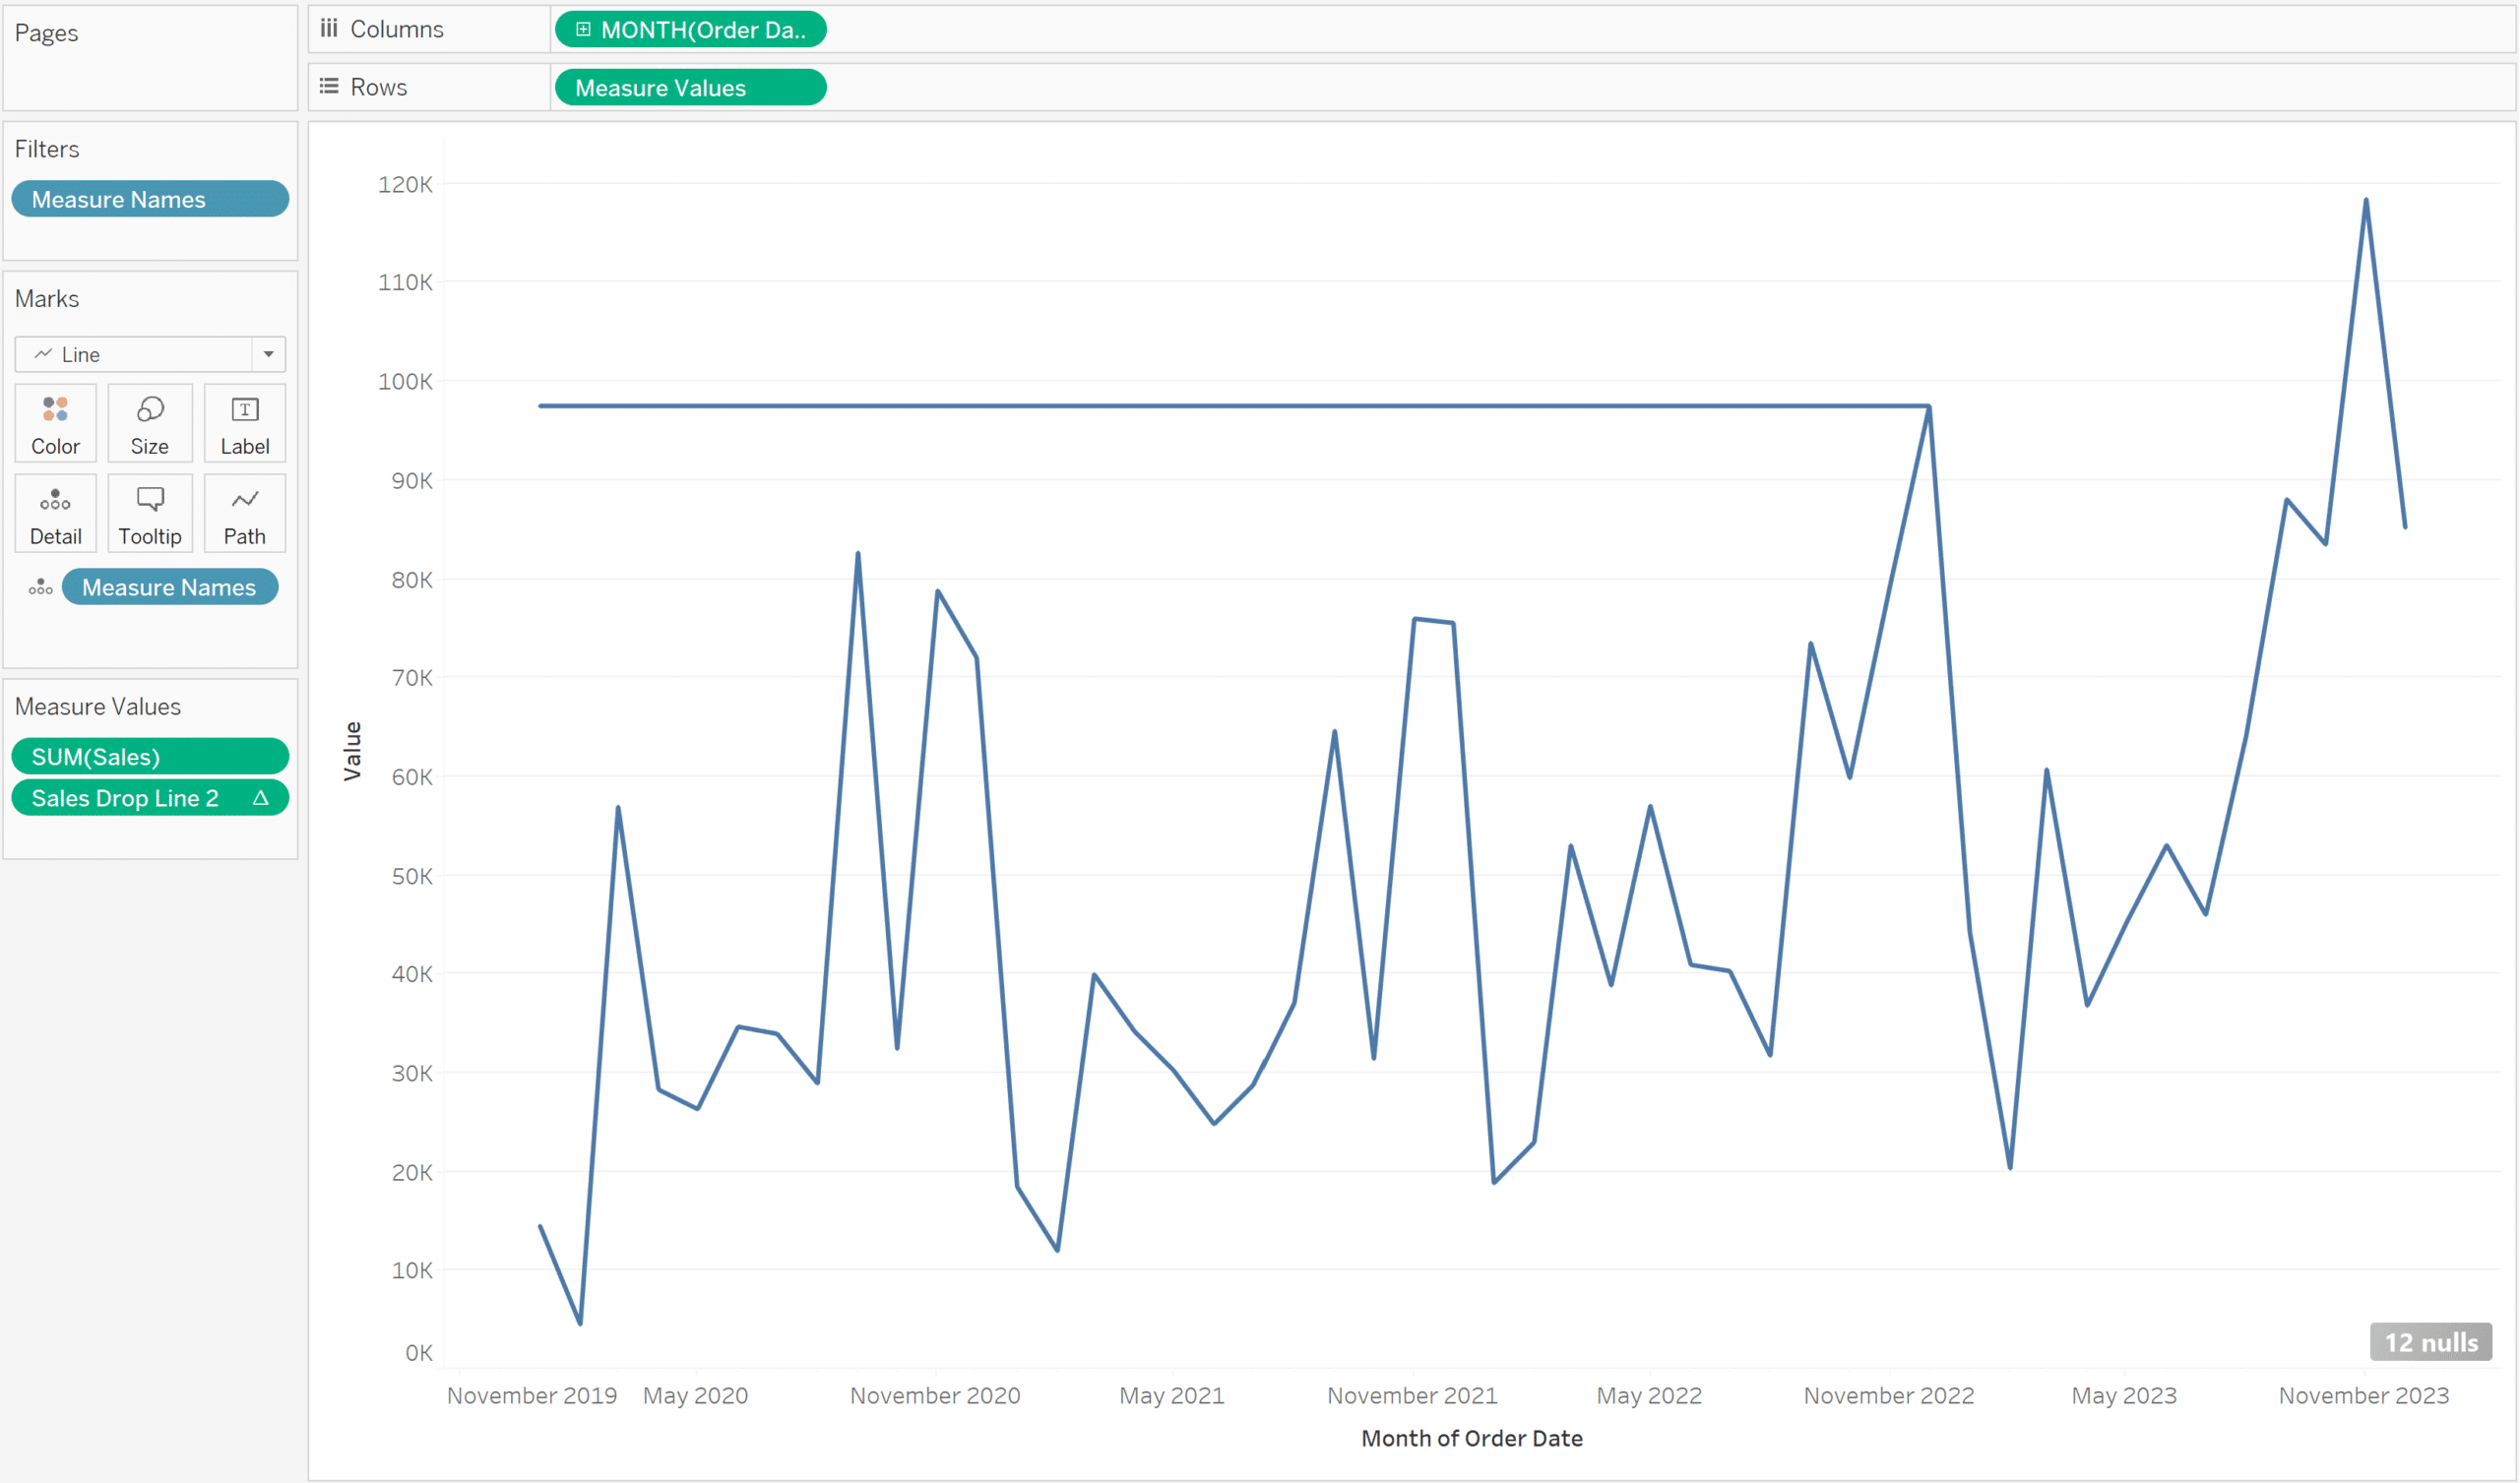
You can already see this coming together as we have our base line graph from the first two examples, but the Sales Drop Line 2 field is drawing a line that get cuts off at the selected date. Here’s how the view looks after doing some formatting including adding Measure Names to the Color property of the Marks card so I could choose a different color for the first drop line, removing the Null values indicator in the bottom right-corner, and updating the font sizing.
The trick to getting the vertical drop line to appear involves using the original Sales Drop Line calculated field on a dual axis and changing the mark type to Bar. As a reminder, the formula for that calculated field is:
SUM(IF DATETRUNC(‘month’,[Order Date]) = [Order Date Parameter] THEN [Sales] END)
This formula says that if the month of the date field matches the current value of the parameter, then show the Sales value. To add this as a second axis, place Sales Drop Line onto the Rows shelf after the generated Measure Values field, click into its pill from the Rows shelf, synchronize the axes by right clicking on either one and choosing Synchronize Axis, and change the mark type of the second axis to Bar.
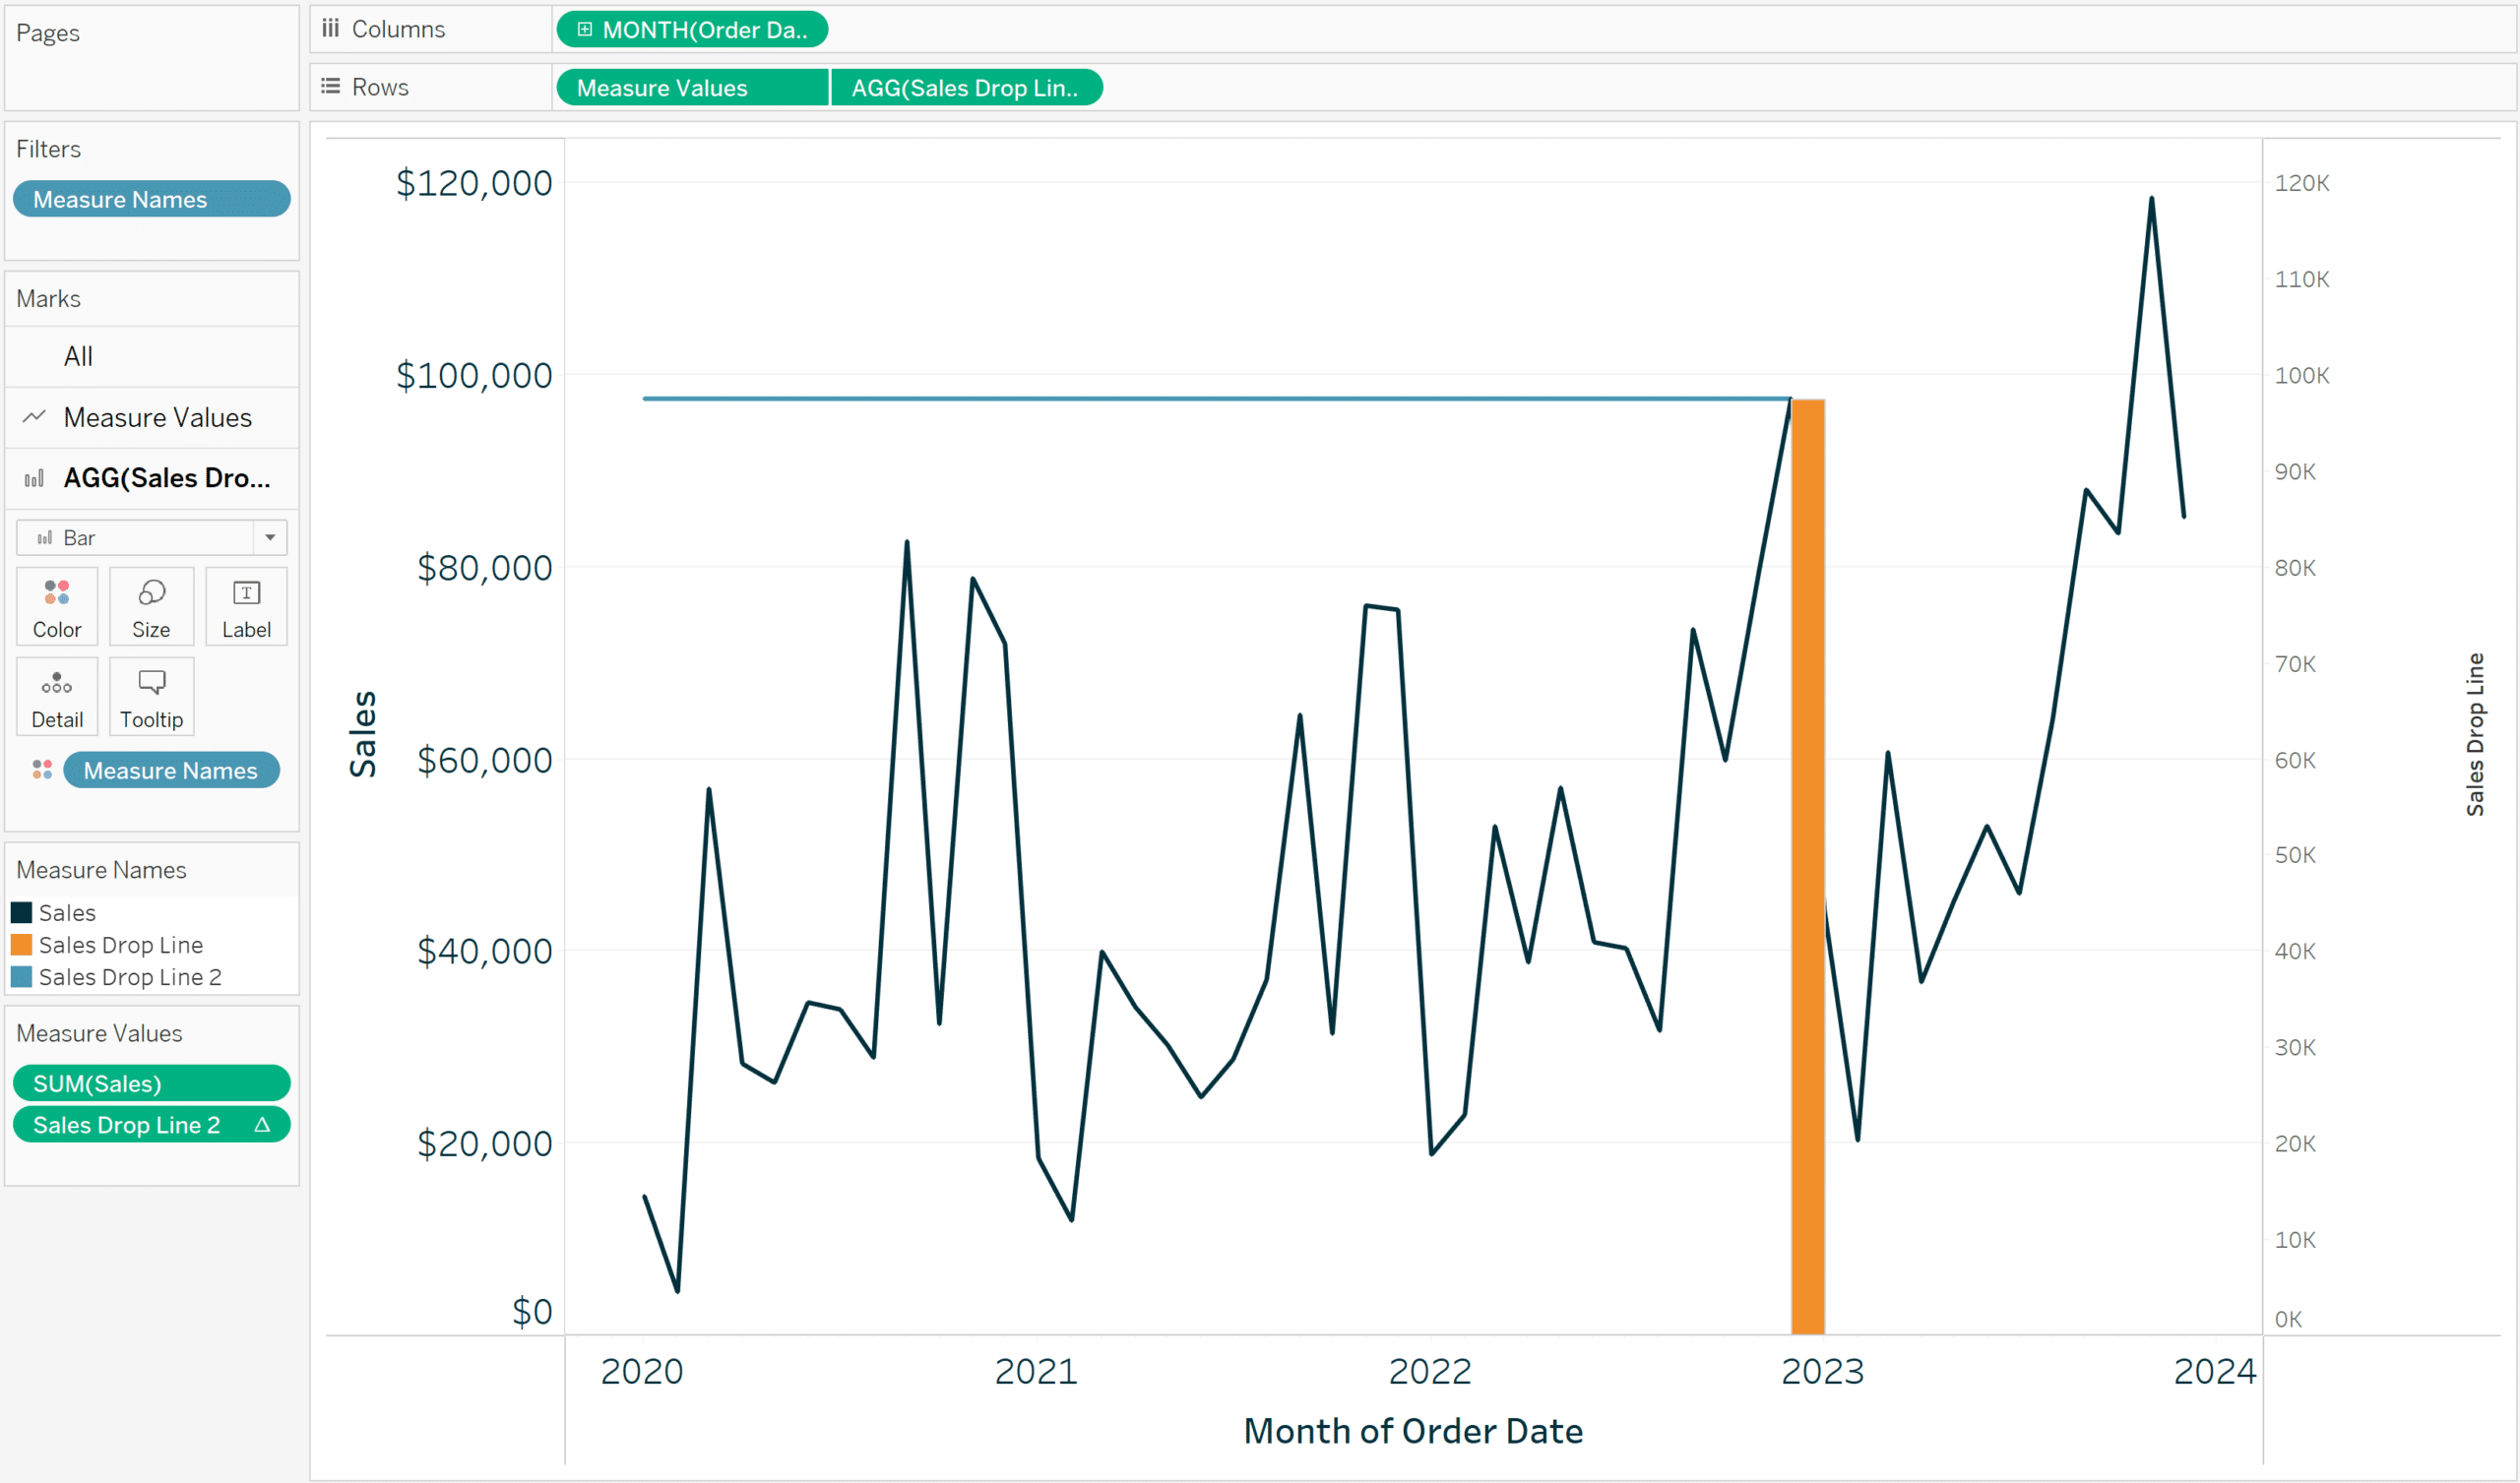
Now that each measure has its own Marks card, I can format them independently. Here’s how my chart looks after hiding the right axis by right clicking on it and deselecting Show Header, changing the size of the bar to make it match the weight of the horizontal drop line, and changing the color of the vertical drop line to match the horizontal drop line.
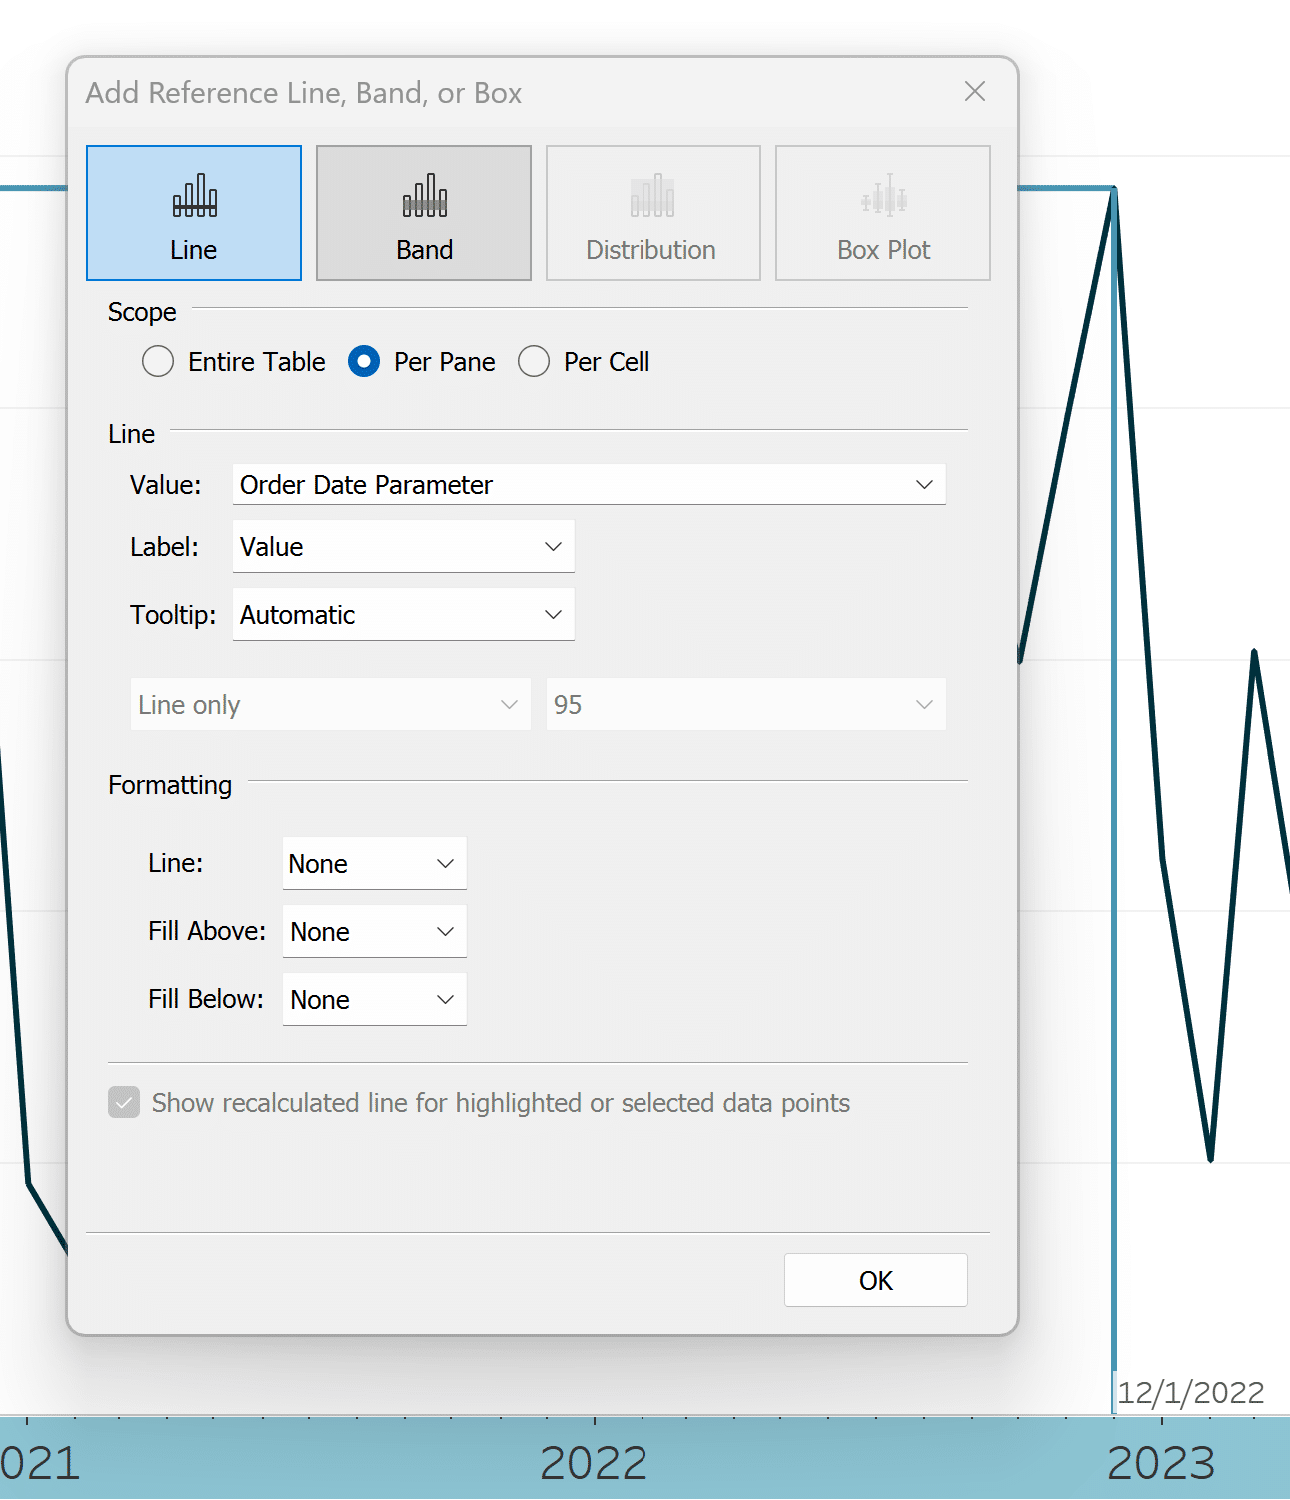
To add labels to both of these drop lines, you can use a reference line, but set the format of the line to None. This results in a customizable label, but an invisible reference line. To demonstrate, I will start by adding a label to the x-axis by right clicking on it and choosing Add Reference Line. Here are my settings after choosing Order Date Parameter as the value, choosing Value for the label, and setting the Line formatting to None.
Now that the reference line is on the view, I can right click on the reference line label and choose Format; this will open the Format Reference Line pane on the left side where I can completely customize the look of the label.
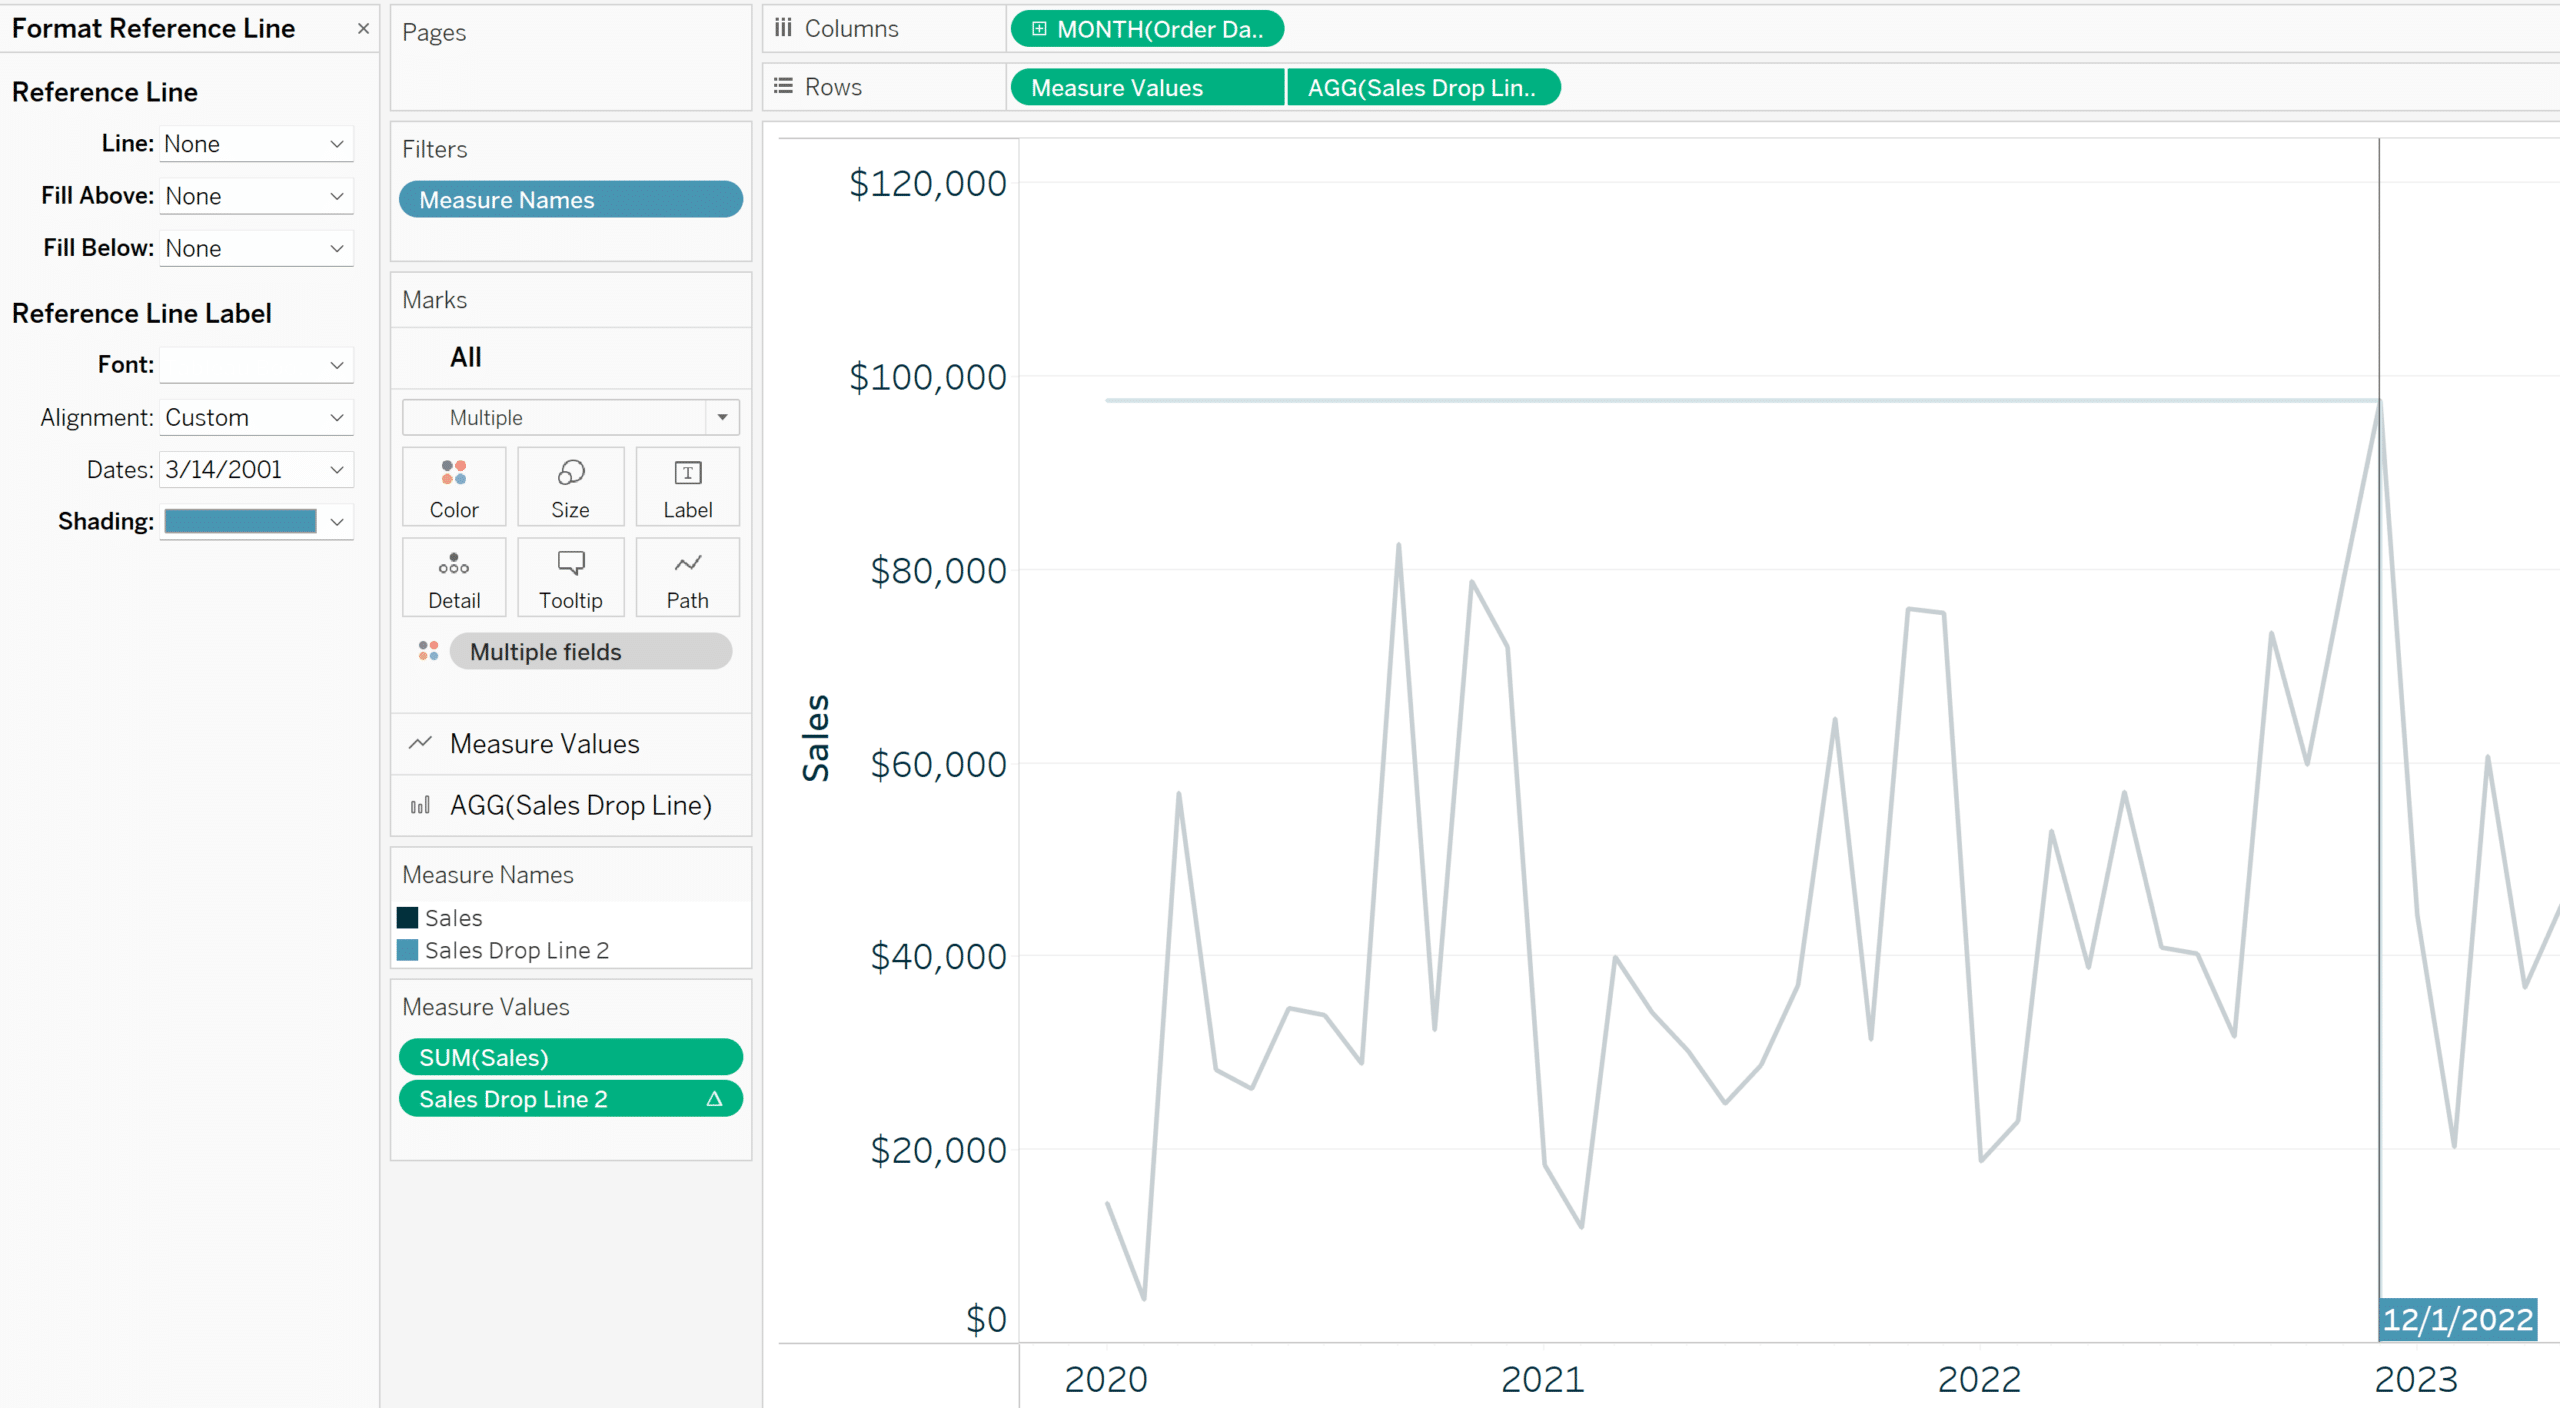
To add a similar label to the y-axis, start by placing Sales Drop Line on the Detail property of the Marks card for the first axis. Remember, the left axis is now constructed from Measure Values, and we only want to show the value of the selected date on the label.
![]()
By adding Sales Drop Line to the Detail property, it will be available to me to add as a reference line. Here is how my final view looks after adding the second reference line, updating the formatting to match the vertical drop line, and doing some final cleanup on grid lines and row / column dividers.
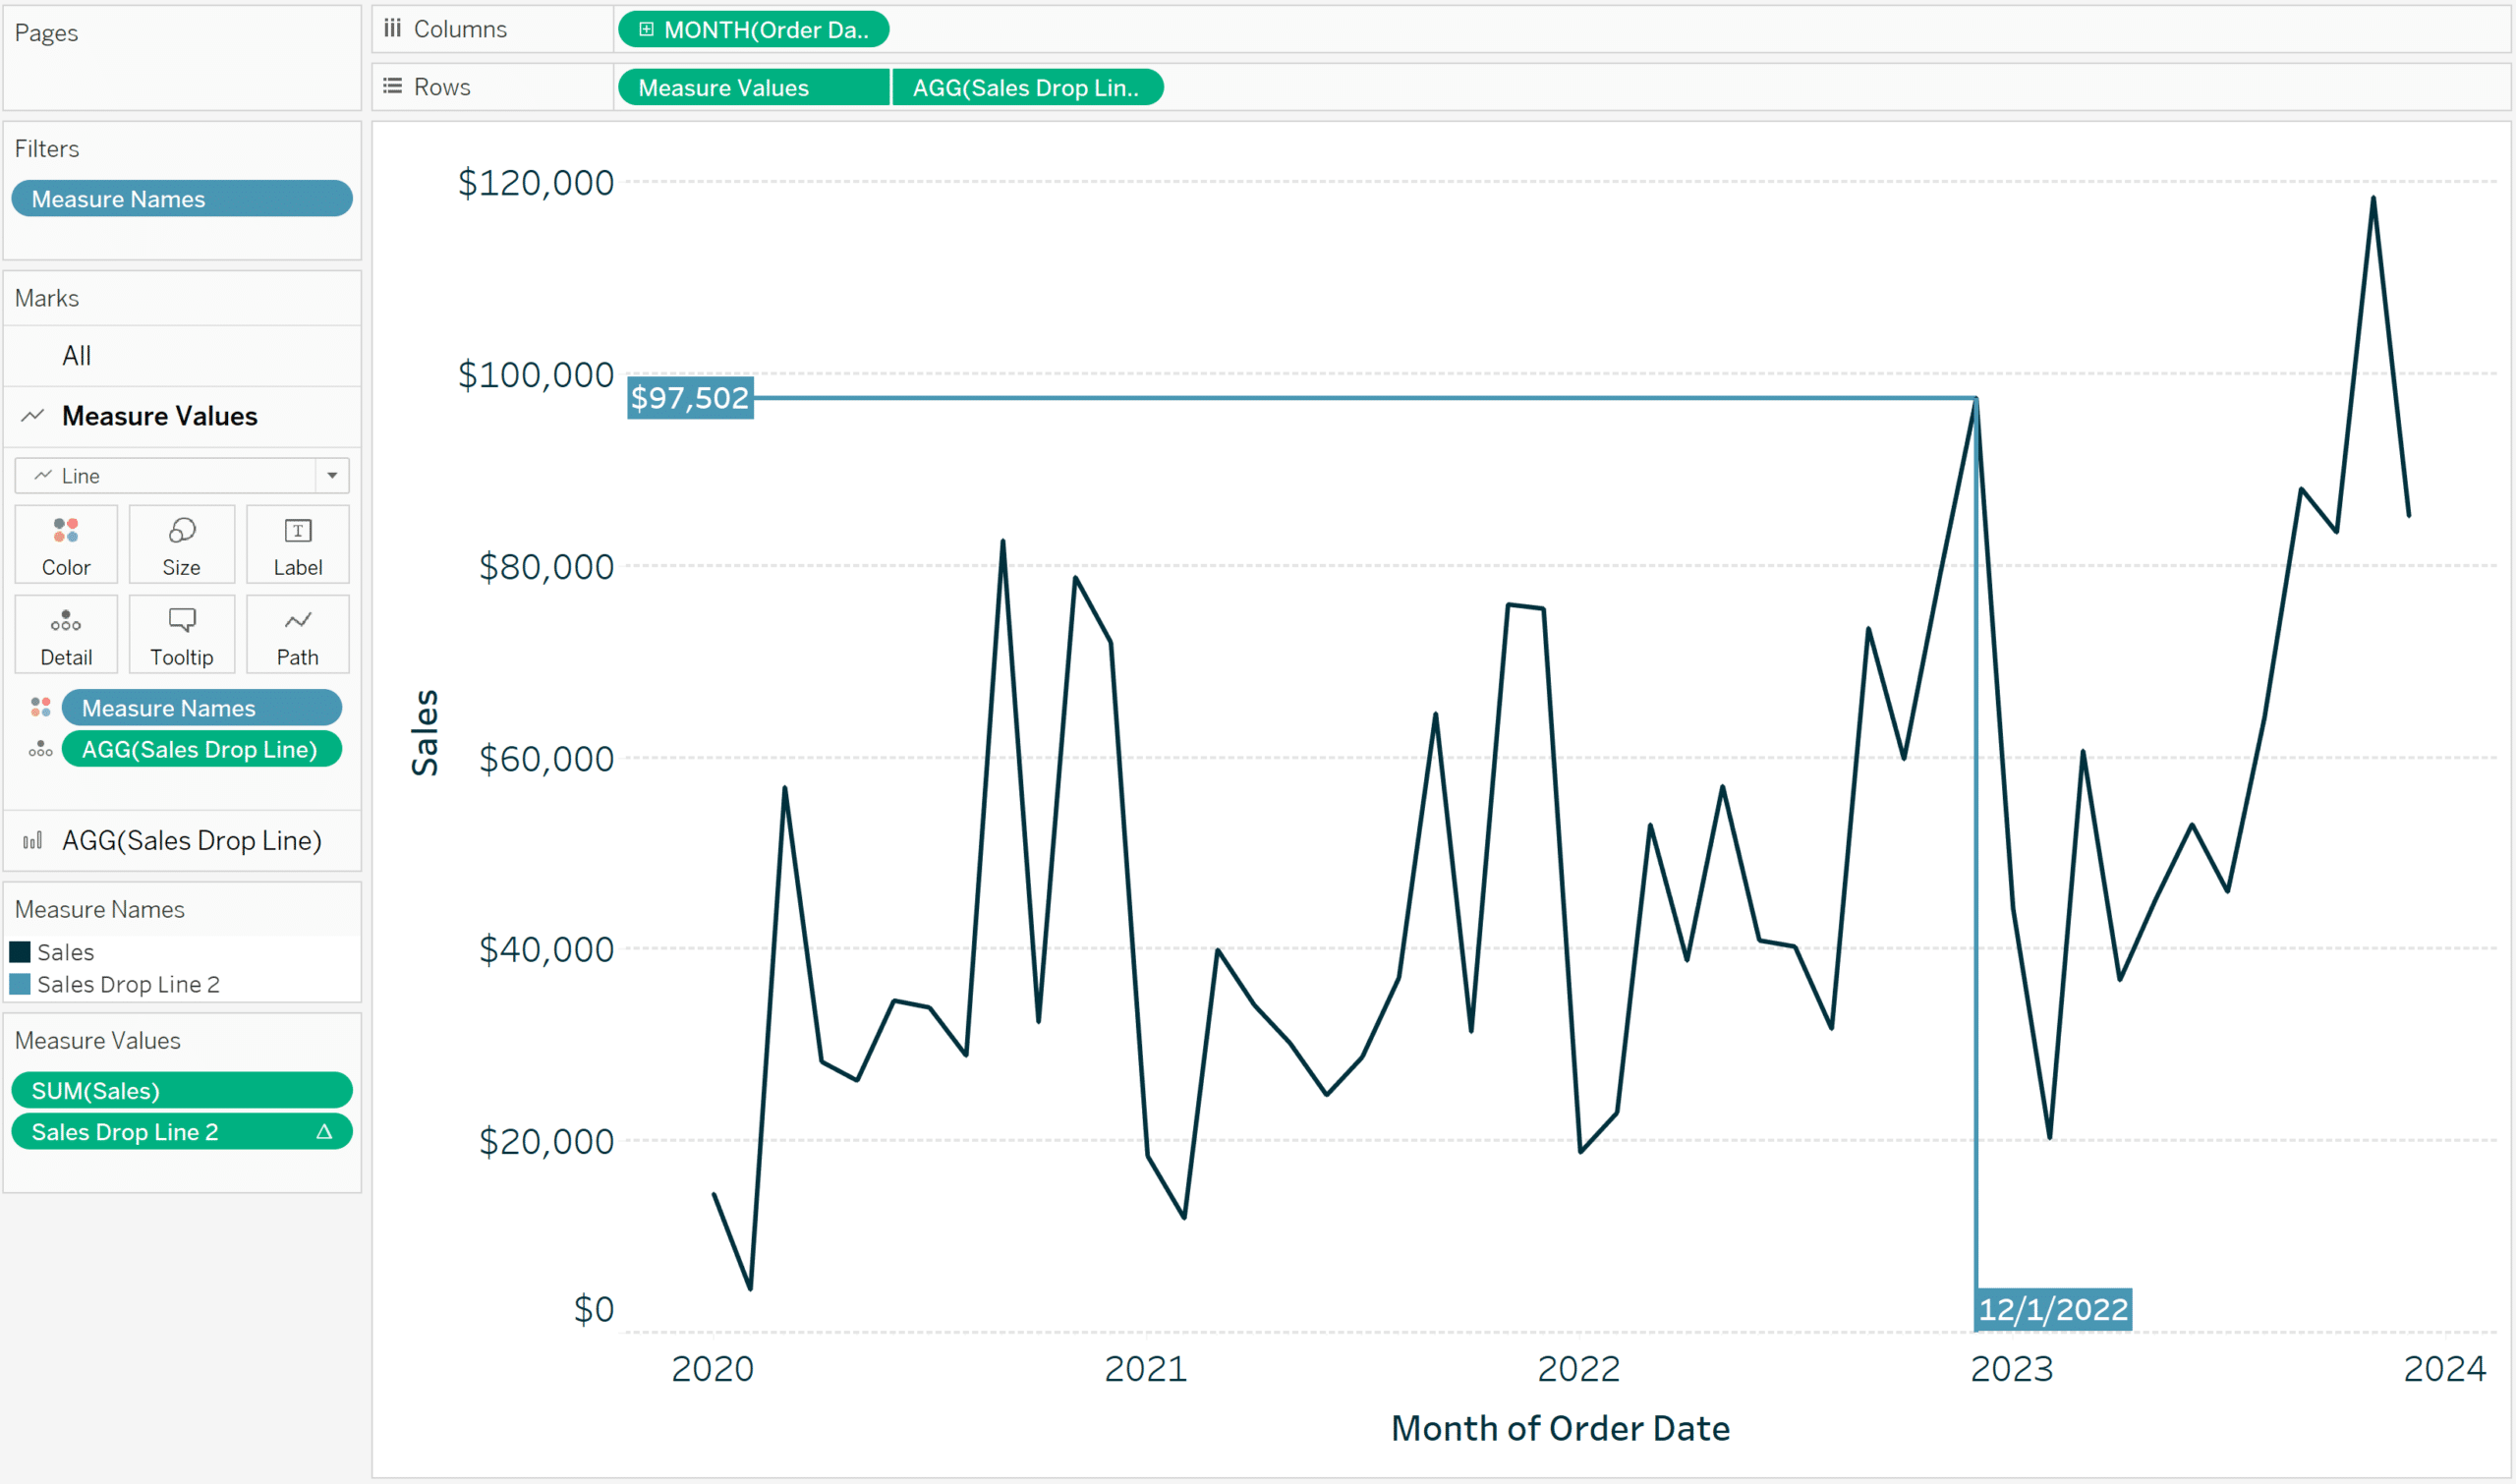
Now if I were to add a worksheet action that changes the Order Date Parameter value when I hover over different dates, the custom drop lines will dynamically move to the selected date. You can even customize these drop lines further if you would like using Tableau’s dotted line patterns and floating these custom drop lines as transparent sheets over other charts.
3 Creative Ways to Use Transparent Sheets to Add Context in Tableau
Thanks for reading,
– Ryan


Written By
Ryan Sleeper
Related Content
3 More Ways to Make Lovely Line Graphs in Tableau

Tableau line graphs are one of the most widely used visualizations on dashboards today – it’s hard to beat a…
3 Ways to Make Splendid Slope Graphs in Tableau
I always say that one specific chart type per analytics scenario will help you capture roughly half the insight. Comparing…
3 Innovative Ways to Highlight Selections in Tableau

In this tutorial I will demonstrate three ways to use different mark types with transparent sheets to highlight a selection…